Preoperative prostate biopsy and multiparametric magnetic
resonance imaging: reliability in detecting prostate cancer
_______________________________________________
Francesco Porpiglia1, Filippo Russo2, Matteo Manfredi1, Fabrizio Mele1, Cristian Fiori1, Daniele Regge2
1Division of Urology, University of Turin, San Luigi Gonzaga Hospital, Orbassano, Turin, Italy; 2Radiology Unit Institute for Cancer Research and Treatment, Candiolo, Turin, Italy
ABSTRACT ARTICLE INFO
______________________________________________________________ ______________________
Purpose: The aim of the study was to analyse and compare the ability of multipara-metric magnetic resonance imaging (mp–MRI) and prostate biopsy (PB) to correctly identify tumor foci in patients undergoing radical prostatectomy (RP) for prostate cancer (PCa).
Materials and Methods: 157 patients with clinically localised PCa with a PSA <10 ng/ mL and a negative DRE diagnosed on the first (12 samples, Group A) or second (18 samples, Group B) PB were enrolled at our institution. All patients underwent mp-MRI with T2-weighted images, diffusion-weighted imaging, dynamic contrast enhanced--MRI prior to RP. A map of comparison describing each positive biopsy sample was created for each patient, with each tumor focus shown on the MRI and each lesion present on the definitive histological examination in order to compare tumor detection and location. The sensitivity of mp-MRI and PB for diagnosis was compared using Student’s t-test. The ability of the two exams to detect the prevalence of Gleason pat-tern 4 in the identified lesions was compared using a chi-square test.
Results: Overall sensitivity of PB and mp-MRI to identify tumor lesion was 59.4% and 78.9%, respectively (p<0.0001). PB missed 144/355 lesions, 59 of which (16.6%) were significant. mp-MRI missed 75/355 lesions, 12 of which (3.4%) were significant. No le-sions with a GSt8 were missed. Sensitivity of PB and mp-MRI to detect the prevalence of Gleason pattern 4 was 88.2% and 97.4%, respectively.
Conclusions: mp-MRI seems to identify more tumor lesions than PB and to provide more information concerning tumor characteristics.
Key words:
Prostatic Neoplasms; Prostate; Magnetic Resonance Imaging; Prostatectomy; Biopsy
Int Braz J Urol. 2015; 41: 124-33
_____________________
Submitted for publication: January 11, 2014
_____________________
Accepted after revision: September 09, 2014
INTRODUCTION
In recent decades, an increase in prostate cancer (PCa) diagnosis occurred because of the introduction of PSA into clinical practice and an
and percentage of biopsy cores positive for PCa), separately or in combination in nomograms (4). Despite the use of these tools, tumor size and aggressiveness are often underestimated (5). Re-cently, some authors have emphasised the role of multiparametric magnetic resonance imaging (mp-MRI) in PCa diagnosis, taking advantage of the anatomical, morphological and functional information that it provides (6-8).
The aim of this prospective study was to analyse the ability of mp-MRI to correctly identify tumor foci in patients undergoing radical prosta-tectomy (RP) for PCa with a PSA <10 ng/mL and a negative DRE and to compare it with the results of PB. The secondary aims were to identify signifi-cant or insignifisignifi-cant lesions and to compare the ability of these results dividing our population in terms of diagnosis at first or second PB.
MATERIALS AND METHODS
Population
The study lasted between September 2010 and November 2012, and it was approved by the ethical committee of our institution, San Luigi Hospital in Orbassano (Turin), Italy. During this period, 178 consecutive patients with PCa
diag-nosed on the first or second PB who underwent mp-MRI prior to RP, as a part of preoperative eva-luation, were enrolled at our institution.
For the purposes of the study, only pa-tients with clinically localised PCa with a PSA <10 ng/mL and a negative DRE were included. The exclusion criteria involved: any previous prostate treatment (TURP, 12 patients; hormonal therapy, 4 patients); contraindications for mp-MRI (i.e., claustrophobia, presence of magnetically activa-ted implanactiva-ted devices, metallic implants in sensi-tive areas; 5 patients). The patients were divided into two groups: Group A, patients diagnosed at the first biopsy; and Group B, patients diagnosed at the second biopsy.
Prostate biopsy
All biopsies were performed at our ins-titution with a transrectal approach under TRUS guidance. First biopsies consisted of 12 samples (Group A) while second biopsies consisted of 18 samples (Group B). Second biopsies were perfor-med in cases of an initial negative PB and per-sistently elevated PSA, according to a systematic template. A modification of the European Consen-sus Meeting on the prostate MRI template (9) was used for this purpose (Figure-1).
A B
mp-MRI
All patients underwent preoperative mp-MRI in the Department of Radiology of I.R.C.C. in Candiolo, using a 1.5 Tesla unit (Signa HDX, General Electric, Milwaukee, USA), with a 4-chan-nel phased-array body coil and an endorectal coil filled with 50 mL of air for signal reception, af-ter intramuscular injection of 20 mg butylscopol-amine bromide. All patients underwent mp-MRI at least 6 weeks after PB, to reduce artefacts due to bleeding or inflammation. All mp-MRI examina-tions were performed according to the same pro-tocol, using the following sequences: a panoramic T1-weighted sequence from the aortic bifurcation to the symphysis pubis for the evaluation of iliac and obturator lymphadenopathies; T2-weighted images (slice-thickness 3 mm, FOV 16 x 16 cm, NEX 2) and T1 fast spin-echo axial images (slice-thickness 3 mm, TR/TE 580/min, FOV 16 x 16 cm, matrix 320 x 256, NEX 2) were used to study pros-tate and seminal vesicles in axial (TR/TE 3020/85), coronal (TR/TE 3620/90) and sagittal (TR/TE 3960/110) planes. Three sequences were obtained on Diffusion-Weighted Imaging (DWI), with ax-ial EPI sequences (slice-thickness 3 mm, TR/TE 7000/min., FOV 16x16 cm, matrix 128x128, NEX 6) with b-values of 0.600 s/mm2, 0.1000 s/mm2
and 0.1400 s/mm2. Dynamic Contrast Enhanced
MRI (DCE-MRI) was performed using axial FSPGR sequences with a temporal resolution of 13s, re-peated for 26 times (TR/TE ~3.5/min., FOV 20x20 cm, matrix 224x192, NEX 0.5). The contrast agent (gadobutrol, Gadovist, Bayer Pharma AG, Berlin) was administered intravenously at an injection rate of 2 mL/s, followed by saline solution flush at the same rate using a power injector (Spectris, Me-drad). The entire prostate was sectioned to achieve 3 mm-thick parasagittal sections. All MRI images were interpreted by the same expert uroradiolo-gist. Positivity for neoplastic tissue was defined by the following: hypointensity in T2-weighted (T2w) images; an Apparent Diffusion Coefficient (ADC) value d1.05 mm²/s with a b-value of 1000 s/mm² in DWI examination; an enhancing area with
ear-suspicious findings. The presence, side and loca-tion of PCa were analysed, and for every lesion, the radiological stage, ADC and pharmacokinetic parameters were analysed using DCE-MRI. For the purpose of the study, very low ADC values were considered as an index of Gleason pattern 4 prev-alence, based on the previously reported correla-tion between ADC and GS (10).
RP
All patients underwent robot-assisted RP at our institution.
Pathologic analysis
All RP specimens were uniformly pro-cessed and submitted in their entirety for histo-logical investigation according to the protocol of Montironi et al.(11). The entire prostate surface was treated with black ink, and the seminal vesi-cles and the apical and basal portions of the gland were removed to create two 4 mm sections. From the remaining gland, 4 mm-thick parasagittal sec-tions were obtained and were further sectioned to achieve 3 mm slices (analogous to slices ob-tained with MRI), which were then sob-tained with haematoxylin-eosin. Tumors were staged accord-ing to the TNM classification system, and the grading was evaluated according to the Gleason Score (12). The volume of each tumor was meas-ured using the ellipsoid formula (length x width x height x 0.52) in mL. The pathologic analysis was conducted by the same uropathologist who was blinded to the MRI results. The following variables were analysed: tumor location, TV, and pathologic GS (pGS).
Map of comparison
Statistical analysis
Using the tumor map obtained by the pathologic analysis as the standard reference, the overlap of the biopsy samples and mp-MRI was evaluated. Lesions were divided into groups ac-cording to the TV (<0.5 and t0.5 mL), the tumor location (basal, equatorial and apical) and the pGS (d6, 7a – 3+4, 7b – 4+3, t8). The sensitivity of mp-MRI and PB for diagnosis was compared us-ing Student’s t-test in the overall population and in Groups A and B. Finally, the ability of the two
exams to detect the prevalence of Gleason pattern 4 in the identified lesions was recorded and com-pared using a chi-square test. All statistical tests were performed using Statistic 7 software (Stat-soft, Tulsa, Oklahoma) and p-values <0.05 were considered as statistically significant.
RESULTS
The overall population consisted of 157 patients: group A consisted of 113 patients diag-nosed at the first prostate mapping, while group B
Figure 2 - Example of two comparison maps between biopsy (a, a'), mp-MRI (b, b') and pathological examination (c, c'). The first case (1) was a naive patient with 12 PB samples (a), with a diagnosis of PCa in 3/12 samples on the right lobe (equatorial, equatorial lateral, basal lateral); mp-MRI (b) highlighted two areas that were suspicious for cancer: the posterolateral equatorial right with extension to the base (diameter 8x5 mm) and the anterolateral equatorial left (diameter 4x5 mm); a histological examination of the surgical specimen (c) demonstrated two tumor foci: a right posterolateral lesion on the basal plane extending to the equatorial plane (vol. 0.75 mL) and a left anterolateral lesion on the equatorial plane (vol. 0.3 mL). The second case (2) was a patient with persistently elevated PSA from whom 18 samples were collected during a second PB (a'). A diagnosis of PCa was made in 3/12 samples from the left lobe (equatorial lateral, basal median, apical median); mp-MRI (b') highlighted two suspicious areas: the posterolateral left on the basal plane (diameter 6x4 mm) and the apical posterior (diameter 14x6 mm); a histological examination of the specimens (c') demonstrated two tumor foci: a left posterolateral lesion on the basal plane (vol. 0.45 mL) and a right posterolateral apical lesion extending to the contralateral lobe (vol. 1.25 mL).
Basal
Basal
Basal L
L L L
L L
R
a
a
b
b
c
c
R R R
R R
Basal
Apical Apical Apical
Apical
Equatorial Equatorial
consisted of 44 patients diagnosed at the second prostate mapping. The baseline characteristics are detailed in Table-1.
The pathologic analysis identified 355 ne-oplastic lesions, 140 (39.4%) with a TV <0.5 mL and 215 (60.6%) with a TV t0.5 mL. The mean TV was 2.21±2.5 mL (median 1.55 mL; range 0.04-15.3 mL). According to the pGS, 150 (42.3%) le-sions had a GS d6, 148 (41.7%) GS=7a (3+4), 31 (9%) GS=7b (4+3) and 26 (7%) a GSt8. Tumor location was also analysed; 118 (33.2%) lesions were basal, 121 (34.1%) were equatorial, and 116 (32.7%) were apical.
Overall, MRI identified tumor lesions thanks to three sequences that produced suspi-cious findings (T2w, DWI and DCE-MRI) in 69 cases and thanks to two sequences in 211. In 36 cases, only one sequence (T2w or DWI or DCE-MRI) produced suspicious finding, so the lesion was not classified as tumour (see Materials and Methods section - mp MRI).
The sensitivities of PB and mp-MRI for identifying tumor foci, stratified by TV, tumor lo-cation and pGS, in the overall population and in the two subgroups are presented in Tables 2 and 3.
PB missed 144/355 lesions, 59 of which (40.9%) were significant: 11 with a TV t0.5 mL, 25 with a pGS=7 and 23 with both a TV t0.5 mL and a pGS=7. No statistically significant differences in
the number of missed significant lesions were re-corded between Groups A and B.
mp-MRI missed 75/355 lesions, 12 of which (16%) were significant: four with a TV t0.5 mL, six with a pGS=7 and two with both a TV t0.5 mL and a pGS=7. No lesions with a GS t8 were missed by both mp-MRI and PB.
Compared to PB, in the overall popula-tion and in Groups A and B, mp-MRI demon-strated a higher sensitivity, reaching statistical significance in most of stratifications. The results are detailed in Table-4.
The abilities of mp-MRI and PB to detect the prevalence of Gleason pattern 4 are shown in Table-5.
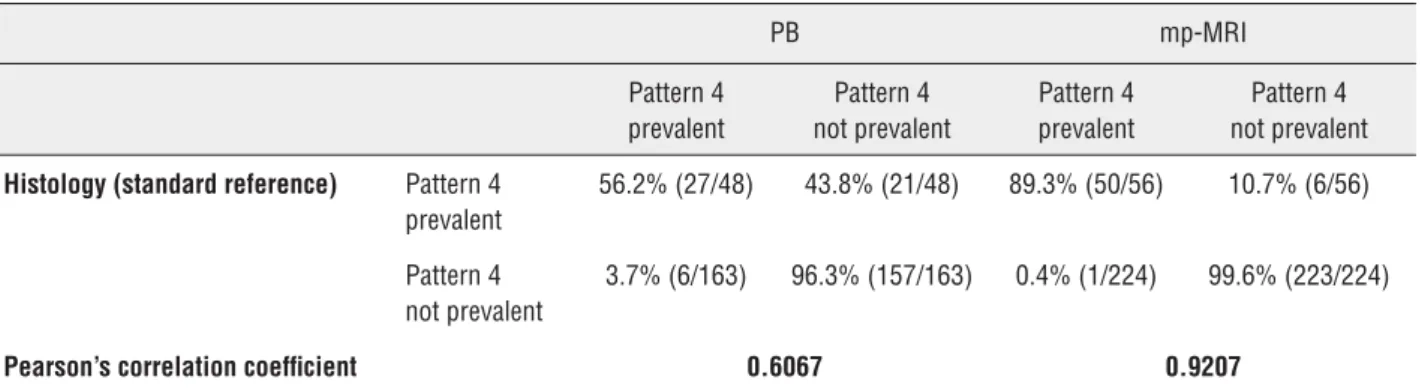
PB showed an accuracy, sensitivity, specificity, positive predictive value, and nega-tive predicnega-tive value of 87.2%, 88.2%, 81.8%, 96.3%, and 56.3%, respectively, while mp-MRI showed values of 97.5%, 97.4%, 98.0%, 99.6%, and 89.3%, respectively. Pearson’s correlation coefficients were 0.6067 and 0.9207 for PB and mp-MRI, respectively.
DISCUSSION
After a diagnosis of localised PCa eligible for RP, the current standard of pre-operative evalu-ation is based on data from biopsies of the entire
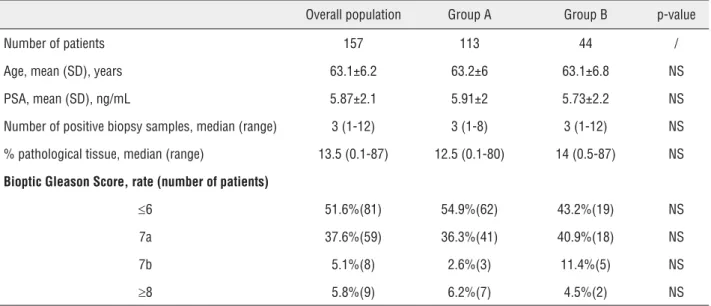
Table 1 - Baseline characteristics. Group A= first biopsy (12 samples); Group B= second biopsy (18 samples); SD= standard deviation.
Overall population Group A Group B p-value
Number of patients 157 113 44 /
Age, mean (SD), years 63.1±6.2 63.2±6 63.1±6.8 NS
PSA, mean (SD), ng/mL 5.87±2.1 5.91±2 5.73±2.2 NS
Number of positive biopsy samples, median (range) 3 (1-12) 3 (1-8) 3 (1-12) NS
% pathological tissue, median (range) 13.5 (0.1-87) 12.5 (0.1-80) 14 (0.5-87) NS
Bioptic Gleason Score, rate (number of patients)
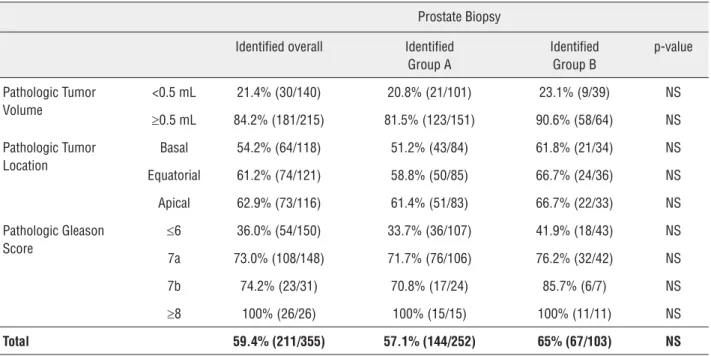
Table 2 - Neoplastic lesions identified by prostate biopsy. Group A= first biopsy (12 samples); Group B= second biopsy (18 samples).
Prostate Biopsy
Identified overall Identified Group A
Identified Group B
p-value
Pathologic Tumor Volume
<0.5 mL 21.4% (30/140) 20.8% (21/101) 23.1% (9/39) NS
t0.5 mL 84.2% (181/215) 81.5% (123/151) 90.6% (58/64) NS
Pathologic Tumor Location
Basal 54.2% (64/118) 51.2% (43/84) 61.8% (21/34) NS
Equatorial 61.2% (74/121) 58.8% (50/85) 66.7% (24/36) NS
Apical 62.9% (73/116) 61.4% (51/83) 66.7% (22/33) NS
Pathologic Gleason Score
d6 36.0% (54/150) 33.7% (36/107) 41.9% (18/43) NS
7a 73.0% (108/148) 71.7% (76/106) 76.2% (32/42) NS
7b 74.2% (23/31) 70.8% (17/24) 85.7% (6/7) NS
t8 100% (26/26) 100% (15/15) 100% (11/11) NS
Total 59.4% (211/355) 57.1% (144/252) 65% (67/103) NS
Table 3 - Neoplastic lesions identified by mp-MRI. Group A= first biopsy (12 samples); Group B= second biopsy (18 samples).
mp-MRI
Identified overall Identified Group A
Identified Group B
p-value
Pathologic Tumor Volume <0.5 mL 50.7% (71/140) 49.5% (50/101) 53.9% (21/39) NS
t0.5 mL 97.2% (209/215) 96.7%(146/151) 98.4% (63/64) NS
Pathologic Tumor Location Basal 71.2% (84/118) 71.4%(60/84) 70.6% (24/34) NS
Equatorial 84.3% (102/121) 83.5% (71/85) 86.1% (31/36) NS
Apical 81.0% (94/116) 77.4% (65/83) 87.9% (29/33) NS
Pathologic Gleason Score d6 55.3% (83/150) 53.3% (57/107) 60.5% (26/43) NS
7a 95.2% (141/148) 95.3%(101/106) 95.2%(40/42) NS
7b 96.8% (30/31) 95.8%(23/24) 100%(7/7) NS
t8 100% (26/26) 100% (15/15) 100% (11/11) NS
Total 78.9% (280/355) 77.8% (196/252) 81.6% (84/103) NS
prostate gland under TRUS guidance. Thus, in men diagnosed with low-risk PCa, we observed an underestimation of the tumor grade in up to 30% of cases and the tumor burden in up to 50% of cases that was related to the biopsy technique, and
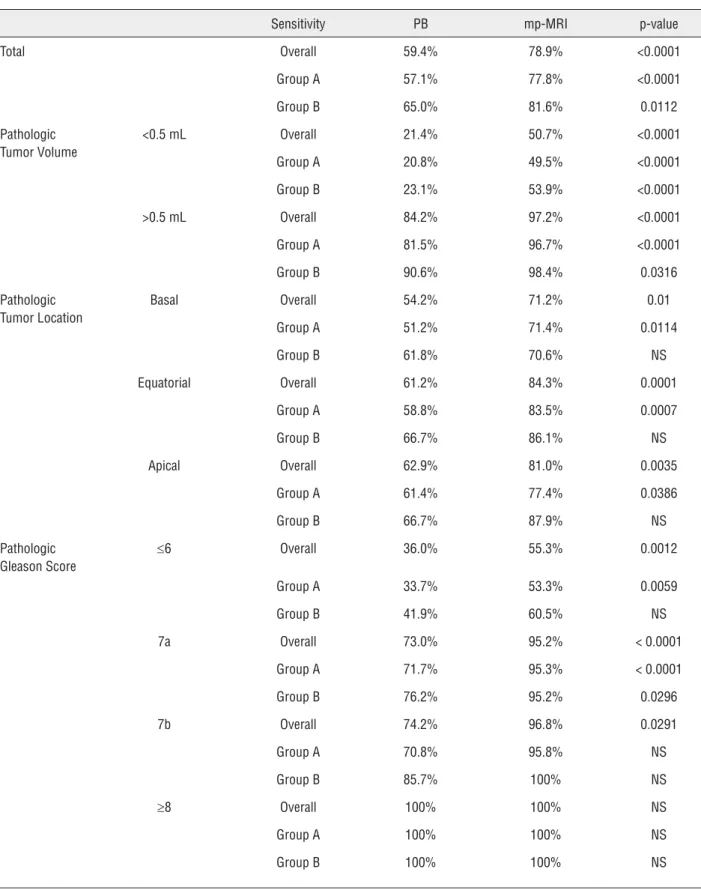
Table 4 - Comparison between sensitivity of prostate biopsy and mp-MRI in identifying tumor lesions. Results are reported by studied variables in the overall population and in Group A (first prostate biopsy) and B (second prostate biopsy).
Sensitivity PB mp-MRI p-value
Total Overall 59.4% 78.9% <0.0001
Group A 57.1% 77.8% <0.0001
Group B 65.0% 81.6% 0.0112
Pathologic Tumor Volume
<0.5 mL Overall 21.4% 50.7% <0.0001
Group A 20.8% 49.5% <0.0001
Group B 23.1% 53.9% <0.0001
>0.5 mL Overall 84.2% 97.2% <0.0001
Group A 81.5% 96.7% <0.0001
Group B 90.6% 98.4% 0.0316
Pathologic Tumor Location
Basal Overall 54.2% 71.2% 0.01
Group A 51.2% 71.4% 0.0114
Group B 61.8% 70.6% NS
Equatorial Overall 61.2% 84.3% 0.0001
Group A 58.8% 83.5% 0.0007
Group B 66.7% 86.1% NS
Apical Overall 62.9% 81.0% 0.0035
Group A 61.4% 77.4% 0.0386
Group B 66.7% 87.9% NS
Pathologic Gleason Score
d6 Overall 36.0% 55.3% 0.0012
Group A 33.7% 53.3% 0.0059
Group B 41.9% 60.5% NS
7a Overall 73.0% 95.2% < 0.0001
Group A 71.7% 95.3% < 0.0001
Group B 76.2% 95.2% 0.0296
7b Overall 74.2% 96.8% 0.0291
Group A 70.8% 95.8% NS
Group B 85.7% 100% NS
Table 5 - Comparison among PB and mp-MRI in predicting the prevalence of Gleason pattern 4 on histopathological analysis. The prevalence of pattern 4 is evaluated on histology and biopsy with the Gleason Score t7b (pGS and bGS, respectively) while is predicted in mp-MRI by a very low value of the ADC on DWI. Gleason pattern 4 not prevalent is defined by Gleason Score d7a. The rate (number) of identified patients are shown. In the lower part of the table the Pearson correlation coefficient, both for biopsy and mp-MRI, is indicated.
PB mp-MRI
Pattern 4 prevalent
Pattern 4 not prevalent
Pattern 4 prevalent
Pattern 4 not prevalent
Histology (standard reference) Pattern 4 prevalent
56.2% (27/48) 43.8% (21/48) 89.3% (50/56) 10.7% (6/56)
Pattern 4 not prevalent
3.7% (6/163) 96.3% (157/163) 0.4% (1/224) 99.6% (223/224)
Pearson’s correlation coefficient 0.6067 0.9207
allow a more accurate detection rate by improving the spatial characterisation of the prostate zonal anatomy and molecular changes (13). Actually, mp-MRI is also gaining an important role because of the possibility that it offers in performing cog-nitive (14) or visually guided targeted PB (15-17). In this study, compared to transrectal biopsy, mp-MRI demonstrated a significantly greater sensitiv-ity in the entire study population (78.9% vs. 59.4%, p<0.001) and in each subgroup (TV, tumor location and pGS). Moreover, mp-MRI diagnosed the vast majority of significant lesions regarding TV (97.2% in PCa with TV t0.5 mL) and pGS (>95% in PCa with pGS t7). Although mp-MRI had a sensitiv-ity that was statistically higher than biopsy, both had low sensitivity for detecting small lesions (TV <0.5 mL). The same results were observed when the population was divided into patients diagnosed at the first PB (Group A) or the second PB (Group B). Despite these differences between mp-MRI and PB, it is extremely important to identify the character-istics of the missed lesions and determine whether these characteristics are actually significant.
In our study, only 12 of the 75 lesions (16%) missed by mp-MRI were significant PCas (with a TV t0.5 mL and/or a GS t7), representing 3.4% (12/355) of all identified lesions. Conversely, PB missed 144 lesions of which 40% (59/144) were significant (16.6% of all identified lesions). Inter-estingly, all lesions with a GS t8 were diagnosed by both mp-MRI and PB.
A change in GS from the PB to the resected specimen was recently reported in approximately 23-35% of cases (18). Functional imaging tech-niques provide information not just about tumor location and volume but also about cancer behav-iour (8): less differentiated and dense cancers are associated with lower ADC values, better contrast and a higher detection rate using DWI (19, 20). Additionally, cancer foci show lower ADC values than normal prostate tissue, and these values cor-relate with GS (10, 21). Nevertheless, ADC values may vary depending on the technical parameters used (10). In our study, we analysed the ability of mp-MRI to identify the prevalence of the path-ologic Gleason pattern 4 and observed a strong correlation (Pearson 0.9207) between Gleason pat-tern 4 and very low ADC values on DWI, while a good correlation was obtained using the biopsy GS (Pearson 0.6067).
Focusing on clinically not significant dis-ease, mp-MRI correctly identified 50% of tumor lesions with a TV <0.5 mL and 55% of PCa with a GS d6. In our opinion, on the basis of these re-sults, mp-MRI may be a valid diagnostic tool not only before the surgery but also in the follow up of patients included in active surveillance proto-cols for PCa.
(9), particularly concerning the use of an endorec-tal coil (considered an optimal requirement).
This study was limited by the inclusion of only a single expert uroradiologist who interpret-ed all the mp-MRI images, which may affect the reproducibility of our results in centres without a radiologic team specialised in prostate mp-MRI. On the other hand, including only one uroradiolo-gist minimises sources of potential bias because patients were treated and followed at the same de-partment.
CONCLUSIONS
Our study suggested that mp-MRI allo-ws for higher identification rate of tumor lesions than PB. Moreover, compared to significant PCa diagnosed at either the first or second biopsy, mp--MRI provides more information concerning tu-mor anatomy (tutu-mor volume and location) and aggressiveness (prevalence of Gleason pattern 4). In patients with PCa with PSA <10 ng/mL and ne-gative DRE, the data provided by mp-MRI may be useful for better therapeutic planning.
ABBREVIATIONS
PCa = prostate cancer
PB = prostate biopsy
TV = tumor volume
GS = Gleason Score
DRE = digital rectal examination
mp-MRI = multiparametric Magnetic Resonance Imaging
RP = radical prostatectomy
DWI = Diffusion-Weighted Imaging
DCE = Dynamic Contrast Enhancement
ADC = Apparent Diffusion Coefficient
CONFLICT OF INTEREST
REFERENCES
1. Mouraviev V, Villers A, Bostwick DG, Wheeler TM, Montironi R, Polascik TJ. Understanding the pathological features of focality, grade and tumour volume of early-stage prostate cancer as a foundation for parenchyma-sparing prostate cancer therapies: active surveillance and focal targeted therapy. BJU Int. 2011;108:1074-85.
2. Stamey TA, McNeal JE, Yemoto CM, Sigal BM, Johnstone IM. Biological determinants of cancer progression in men with prostate cancer. JAMA. 1999 21;281:1395-400. 3. Ploussard G, Epstein JI, Montironi R, Carroll PR, Wirth M,
Grimm MO, et al. The contemporary concept of significant versus insignificant prostate cancer. Eur Urol. 2011;60:291-303.
4. Shukla-Dave A, Hricak H, Akin O, Yu C, Zakian KL, Udo K, et al. Preoperative nomograms incorporating magnetic resonance imaging and spectroscopy for prediction of insignificant prostate cancer. BJU Int. 2012;109:1315-22. 5. Crawford ED, Wilson SS, Torkko KC, Hirano D, Stewart
JS, Brammell C, et al. Clinical staging of prostate cancer: a computer-simulated study of transperineal prostate biopsy. BJU Int.2005;96:999-1004.
6. Sciarra A, Barentsz J, Bjartell A, Eastham J, Hricak H, Panebianco V, et al. Advances in magnetic resonance imaging: how they are changing the management of prostate cancer. Eur Urol. 2011;59:962-77.
7. Puech P, Potiron E, Lemaitre L, Leroy X, Haber GP, Crouzet S, et al. Dynamic contrast-enhanced-magnetic resonance imaging evaluation of intraprostatic prostate cancer: correlation with radical prostatectomy specimens. Urology. 2009 ;74:1094-9.
8. Hoeks CM, Barentsz JO, Hambrock T, Yakar D, Somford DM, Heijmink SW, et al. Prostate cancer: multiparametric MR imaging for detection, localization, and staging. Radiology. 2011;261:46-66.
9. Dickinson L, Ahmed HU, Allen C, Barentsz JO, Carey B, Futterer JJ, et al. Magnetic resonance imaging for the detection, localisation, and characterisation of prostate cancer: recommendations from a European consensus meeting. Eur Urol. 2011;59:477-94.
10. Barentsz JO, Richenberg J, Clements R, Choyke P, Verma S, Villeirs G, et al. European Society of Urogenital Radiology. ESUR prostate MR guidelines 2012. Eur Radiol. 2012;22:746-57.
12. Epstein JI, Allsbrook WC Jr, Amin MB, Egevad LL; ISUP Grading Committee. The 2005 International Society of Urological Pathology (ISUP). Consensus Conference on Gleason Grading of Prostatic Carcinoma. Am J Surg Pathol. 2005;29:1228-42.
13. Masterson TA, Touijer K. The role of endorectal coil MRI in preoperative staging and decision-making for the treatment of clinically localized prostate cancer. MAGMA. 2008;21:371-7. 14. Puech P, Rouvière O, Renard-Penna R, Villers A, Devos P,
Colombel M, et al. Prostate cancer diagnosis: multiparametric MR-targeted biopsy with cognitive and transrectal US-MR fusion guidance versus systematic biopsy—prospective multicenter study. Radiology. 2013;268:461-9.
15. Pinto PA, Chung PH, Rastinehad AR, Baccala AA Jr, Kruecker J, Benjamin CJ, et al. Magnetic resonance imaging/ultrasound fusion guided prostate biopsy improves cancer detection following transrectal ultrasound biopsy and correlates with multiparametric magnetic resonance imaging. J Urol. 2011;186:1281-5.
16. Moore CM, Robertson NL, Arsanious N, Middleton T, Villers A, Klotz L, et al. Image-guided prostate biopsy using magnetic resonance imaging-derived targets: a systematic review. Eur Urol. 2013;63:125-40.
17. Siddiqui MM, Rais-Bahrami S, Truong H, Stamatakis L, Vourganti S, Nix J, et al. Magnetic resonance imaging/ ultrasound-fusion biopsy significantly upgrades prostate cancer versus systematic 12-core transrectal ultrasound biopsy. Eur Urol. 2013;64:713-9.
18. Cooperberg MR, Carroll PR, Klotz L. Active surveillance for prostate cancer: progress and promise. J Clin Oncol. 2011;29:3669-76.
19. deSouza NM, Riches SF, Vanas NJ, Morgan VA, Ashley SA, Fisher C, et al. Diffusion-weighted magnetic resonance imaging: a potential non-invasive marker of tumour aggressiveness in localized prostate cancer. Clin Radiol. 2008;63:774-82.
20. Yoshimitsu K, Kiyoshima K, Irie H, Tajima T, Asayama Y, Hirakawa M, et al. Usefulness of apparent diffusion coefficient map in diagnosing prostate carcinoma: correlation with stepwise histopathology. J Magn Reson Imaging. 2008;27:132-9.
21. Hambrock T, Somford DM, Huisman HJ, van Oort IM, Witjes JA, Hulsbergen-van de Kaa CA, et al. Relationship between apparent diffusion coefficients at 3.0-T MR imaging and Gleason grade in peripheral zone prostate cancer. Radiology. 2011;259:453-61.
______________________ Correspondence address: