Prevalence of motor deficits and developmental coordination
disorders in children from South Brazil
Prevalência de déficits motores e desordem coordenativa desenvolvimental em crianças da região Sul do Brasil
Prevalencia de déficits motores y trastorno coordinativo de desarrollo en niños de la región Sur de Brasil
Nadia Cristina Valentini1, Mônia Tainá C. Coutinho2, Simone Maria Pansera3, Viviane Aparecida P. dos Santos4, José Luiz L. Vieira5,
Maria Helena Ramalho6, Marcio Alves de Oliveira7
Instituição:Escola de Educação Física da Universidade de Federal do Rio Grande do Sul (UFRGS), Porto Alegre, RS, Brasil
1PhD em Comportamento Motor pela Auburn University; Pós-doutorado em Kinesiology pela University of Maryland, College Park; Professora da UFRGS, Porto Alegre, RS, Brasil
2Graduanda em Licenciatura em Educação Física pela UFRGS, Porto Alegre, RS, Brasil
3Mestranda em Ciências do Movimento Humano pela UFRGS, Porto Alegre, RS, Brasil
4Mestre em Educação Física pela Universidade Estadual de Maringá (UEM); Professora da Fundação Faculdade de Filosofia Ciências e Letras de Mandaguari, Mandaguari, PR, Brasil
5Doutor em Educação Física pela Universidade Federal de Santa Maria (UFSM); Professor da UEM, Maringá, PR, Brasil
6Doutora em Educação Física pela UFSM; Professora da Universidade Estadual de Santa Catarina (UDESC), Florianópolis, SC, Brasil
7Doutor em Educação Física pela UFRGS; Pós-doutorado em Kinesiology pela University of Maryland, College Park; Professor do Departamento de Kinesiology na University of Maryland, College Park, Maryland, EUA ABSTRACT
Objective:To investigate the prevalence of probable devel-opmental coordination disorder and its risk, and the typical development in boys and girls aged from four to 12 years-old. Methods: 1,587 children from South Brazil were evalu-ated by the Movement Assessment Battery for Children. The participants were divided into four age groups (G1, from four to six years-old; G2, from seven to eight; G3, from nine to ten; and G4, from 11 to 12).
Results:19.9% of the children were identified as having probable developmental coordination disorder (percentile ≤5%) and 16.8% were identified at risk of such disorder (percentile ≤15%), based on the Movement Assessment Battery for Children. Significant interaction was found for the classification of the Movement Assessment Battery for Children between age group and gender (p<0.0001). The gender analysis showed a higher prevalence of Develop-mental Coordination Disorder in girls at the age groups G3 and G4 (p<0.05). Significant interactions were found for manual dexterity (p=0.0001), ball skills (p<0.0001),
and balance (p<0.0001). Manual dexterity was responsible for the highest variances observed.
Conclusions:The motor difficulties in manual dexterity robustly accounted for the diagnosis of probable and at risk developmental coordination disorder. Boys presented lower level of performance in the manual dexterity and balance tasks, while girls of all age groups had more difficulties related to ball skills. Higher levels of motor impairment were found in older children.
Key-words: motor skill disorders; epidemiology; child development; primary prevention.
RESUMO
Objetivo: Investigar a prevalência de provável desordem coordenativa desenvolvimental e de seu risco e o desenvol-vimento típico em meninos e meninas, com quatro a 12 anos de idade.
Métodos:Foram avaliadas 1.587 crianças da região Sul do Brasil com o Movement Assessment Battery for Children. Os
Endereço para correspondência: Nadia Cristina Valentini
Escola de Educação Física da UFRGS Rua Felizardo Furtado, 750 – Jardim Botânico CEP 90690-200 – Porto Alegre/RS
E-mail: [email protected]
Fonte financiadora: Coordenação de Aperfeiçoamento de Pessoal de Nível Superior (CAPES, com bolsa de pós-doutorado no exterior, e Conselho Nacional de Desenvolvimento Científico e Tecnológico (CNPq), com bolsa produtividade em pesquisa e bolsa iniciação científica – PIBIC-CNPq Conflito de interesse: nada a declarar
participantes foram divididos em quatro grupos de acordo com a idade (G1, de quatro a seis anos; G2, de sete a oito; G3, de nove a dez; e G4, de 11 a 12).
Resultados: Ao todo, 19,9% das crianças foram iden-tificadas com provável desordem coordenativa desenvolvi-mental (percentil ≤5%) e 16,8% com risco de tal desordem (percentil ≤15%), todas avaliadas pelo Movement Assessment
Battery for Children. Houve interação significativa entre a
classificação no Movement Assessment Battery for Children, por grupo de idade e sexo (p<0,0001). A análise por gênero demonstrou maior prevalência de desordem coordenativa desenvolvimental no grupo de meninas nas faixas etárias G3 e G4 (p<0,05). Observaram-se interações significativas para a destreza manual (p=0,0001), habilidades com bola (p<0,0001) e equilíbrio (p<0,0001). Destreza manual foi o item com maior peso nas variações observadas.
Conclusões: As dificuldades nas tarefas de destreza ma-nual repercutiram mais fortemente para o diagnóstico de provável desordem coordenativa desenvolvimental e no risco de tal desordem. Os meninos apresentaram pior desempen-ho nas tarefas de destreza manual e equilíbrio, enquanto as meninas apresentaram maior deficiência nas habilidades com bola. O desempenho motor deficitário foi mais prevalente no grupo etário de crianças mais velhas.
Palavras-chave:transtornos das habilidades motoras; epi-demiologia; desenvolvimento infantil; prevenção primária.
RESUMEN
Objetivo: Investigar la prevalencia de un posible trastorno coordinativo de desarrollo y su riesgo, y el desarrollo típico en niños y niñas, con 4 y 12 años de edad.
Métodos: Se evaluaron a 1.587 niños de la región Sur de Brasil con el Movement Assessment Battery for Children. Los participantes fueron divididos en cuatro grupos conforme a la edad (1, de los cuatro a los seis años; 2, de los siete a los ocho; 3, de los nueve a los diez; y 4, de los 11 a los 12).
Resultados: En total, 19,9% de los niños fueron iden-tificados con probable trastorno coordinativo de desarrollo (percentil ≤ 5%) y 16,8% con riesgo de tal trastorno (per-centil ≤ 15%), todos evaluados por el Movement Assessment
Battery for Children. Hubo interacción significativa entre la
clasificación en el Movement Assessment Battery for Children
por grupo de edad y sexo (p<0,0001).El análisis por géne-ro demostró mayor prevalencia de trastorno coordinativo de desarrollo en el grupo de niñas en las franjas de edad
3 y 4 (p<0,05). Se observaron interacciones significativas para la destreza manual (p=0,0001), habilidades con balón (p<0,0001) y equilibrio (p<0,0001). Destreza manual fue el ítem con mayor peso en las variaciones observadas.
Conclusiones: Las dificultades en las tareas de destreza manual repercutieron más fuertemente para el diagnóstico de probable trastorno coordinativo de desarrollo y en riesgo de tal trastorno. Los niños presentaron peor desempeño en las tareas de destreza manual y equilibrio, mientras que las niñas presentaron mayor deficiencia en las habilidades con balón. El desempeño motor deficitario fue más prevalente en el grupo etario de niños mayores.
Palabras clave: trastornos de las habilidades motoras; epidemiología; desarrollo infantil; prevención primaria.
Introduction
Children with developmental coordination disorder (DCD) present motor deicits(1-3) and low levels of daily
prac-tice of physical activity(4). The disorder can be observed in the
delay of motor milestones and the clumsy way in which the child performs basic movements, such as catching objects, crawling and sitting. After some time, the uncoordinated be-havior becomes evident in the performance of more complex activities that involve oculo-manual coordination between segments and/or all the body. Motor dificulties drive this children to avoid the practice of sports(5,6), what leads to the
increased risk of diseases associated with physical inactiv-ity(5). Social risks are associated to DCD. Because of their
clumsy behavior, these children are often ridiculed by their peers, criticized by their teachers, and even by family mem-bers, which, in general, are not aware of the dificulties of the child. As a consequence, children with DCD demonstrate an inability to properly process social information(7), often
suffer depression and social isolation(8), low self-esteem(7,8)
and low level of academic ambition(6,9).
Repercussions in the short and long term impact on the qual-ity of life of children with DCD, so the early diagnosis and the referral to compensatory programs that minimize the problems arising from the disorder are essential(6,9). It is estimated that 6%
of the world population is affected by DCD(10), suggesting that
this disorder is becoming extremely common and that, there is, probably, one case of DCD in each classroom(9).
worldwide concern about the quality of services offered to these children. For example, a study in the Netherlands and Germany showed a 7.7% incidence of DCD in children from 4 to 13 years(11), similar to results reported in Switzerland
(7.3%)(12). In England, a recent investigation with 6,990
children aged 7 years reported a rate of 1.7% children with probable DCD and 4.9% in situation of risk(13). Expanding
the diversity regarding the incidence of DCD, a cross-cultur-al study, involving children from Canada and Greece, found extremely different values – 8 and 19%, respectively(14).
Based on facts such as the inconsistent estimates of DCD, the current results on the prevalence of this disorder in researches conducted in different countries, and the shortage of estimates for Brazil, this study’s main aim was to investigate the preva-lence of probable DCD and its risk in boys and girls in southern Brazil, from 4 to 12 years. Furthermore, given the disturbing recognition that DCD does not seem to be overcome by most children(15,16) and the fact that compensatory intervention is
essential to minimize the disorder’s negative impact on daily life, the second aim of this study was to investigate in which motor tasks boys and girls from southern Brazil, with probable diagnosis of DCD, at risk of having the disorder, and with typi-cal development, present major dificulties.
Methods
This cross-sectional study investigated 1,587 children aged from 4 to 12 years, attending public schools in southern Brazil (states of Rio Grande do Sul, Paraná, and Santa Catarina). Children from the institutions that agreed to participate in this study were sampled randomly, and the number of children in each institution was proportional to the size of the cluster. The sample size calculation was performed in Programs for Epidemiologists, version 4.0. For a conidence level of 99% and a proportion of answers of 50%, we found the total number of 1,500 children. The sample consisted of 48.1% girls whose mean age was 8.3±1.7 years and 51.9% boys with 8.4±1.7 years. Information about neurodevelopmental status of participants was reported by parents and/or legal guardians and by the prin-cipals of schools. Children with motor dificulties and previous diagnosis of neuropathologies such as cerebral palsy, hemiplegia, muscular dystrophy, etc., were excluded from the study(10).
Departments of Health and Education from 14 municipalities approved the study in schools that agreed to participate (n=36). Parents and/or legal guardians signed an informed consent and the study was approved by the Research Ethics Committee of Universidade Federal do Rio Grande do Sul (UFRGS).
The instrument used was the Movement Assessment Battery for Children(MABC)(17), which is a battery of tests
widely recognized as important in the identiication of DCD in children. The test has speciic and differentiated charac-teristics for each age group: G1, 4 to 6; G2, 7 and 8; G3, 9 and 10; and G4, 11 and 12 years. MABC is composed of subtests of manual dexterity, ability in handling the ball, and balance, each with eight motor tasks. The gross values obtained in each of the motor tasks are added and converted to scores from zero to ive for the whole subtest (higher scores represent higher motor dificulties). The sum of the scores of each domain provides the value of total motor impairment, which is converted to a percentile. We adopted cutoff points recognized in the literature(18): ≤5% scores represent atypical
motor development, indicative of DCD; percentile 6 - 15% is considered suspect (risk of DCD); and percentile >16% is considered as typical motor performance.
The evaluation was conducted in schools by trained pro-fessionals and with at least 3 years experience in perceptual-motor evaluation and diagnosis. The assessment of each child took, in average, 25 minutes. Children irst received verbal instructions and then demonstration of the motor tasks. When children did not understand one of the tasks, a new explanation was offered. Inter-observer reliability was high (0.98).
Chi-square test was used to analyze the prevalence rates of probable DCD, risk of DCD and typical development (TD) in age groups (AGs) and in sex. Partial η2 was used to
esti-mate effect sizes, considering as small, η2=0.01; moderate,
η2=0.06; and large, η2=0.14. Multivariate analysis was used
to investigate motor dificulties of participants according to AGs and sex, adopting the Wilks’lambda (λ) criterion. When signiicant interactions were observed, continuity tests were conducted using analysis of variance (ANOVA). The conidence interval adopted was 95%.
Results
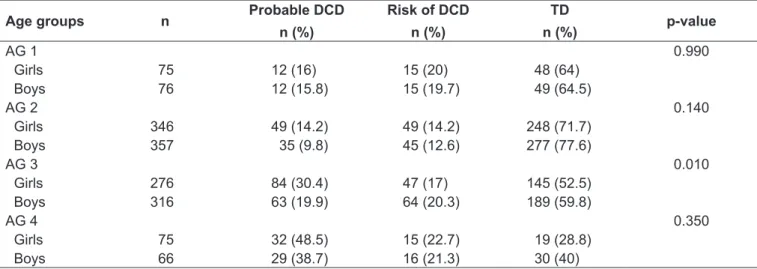
Table 2 - Prevalence of probable developmental coordinative disorder, risk of developmental coordinative disorder and typical development in each age group by sex
Age groups n Probable DCD
n (%)
Risk of DCD
n (%)
TD
n (%) p-value
AG 1 0.990
Girls 75 12 (16) 15 (20) 48 (64)
Boys 76 12 (15.8) 15 (19.7) 49 (64.5)
AG 2 0.140
Girls 346 49 (14.2) 49 (14.2) 248 (71.7)
Boys 357 35 (9.8) 45 (12.6) 277 (77.6)
AG 3 0.010
Girls 276 84 (30.4) 47 (17) 145 (52.5)
Boys 316 63 (19.9) 64 (20.3) 189 (59.8)
AG 4 0.350
Girls 75 32 (48.5) 15 (22.7) 19 (28.8)
Boys 66 29 (38.7) 16 (21.3) 30 (40)
DCD: developmental coordinative disorder; TD: typical development; AG: age group.
Table 1 - Prevalence of probable developmental coordinative disorder, risk of developmental coordinative disorder and typical development according to age groups and sex
Age group and sex n Probable DCD
n (%)
Risk of DCD
n (%)
TD
n (%)
AG 1 151 24 (15.9) 30 (19.9) 97 (64.2)
AG 2 703 84 (11.9) 94 (13.4) 525 (74.7)*
AG 3 592 147 (24.8) 111 (18.8) 334 (56.4)
AG 4 141 61 (43.3)* 31 (22)* 49 (34.8)
Girls 763 177 (23.2)* 126 (16.5) 460 (60.3)
Boys 824 139 (16.9) 140 (17) 545 (66.1)*
Total 1,587 316 (19.9) 266 (16.8) 1005 (63.3)
DCD: developmental coordinative disorder; TD: typical development; AG: age group; *Signiicant differences in continuity tests (p<0.05) presents information on the prevalence rates (number and
percentage) of probable DCD, risk of DCD, and TD, ac-cording to AGs and sex, as well as statistical results for the comparisons between AGs and between sexes.
When comparisons between sexes were conducted, con-sidering the AGs, results showed a higher prevalence of probable DCD for girls in AG 3 (p=0.01), while, for boys, there was signiicantly higher prevalence of TD in the age group from 9 to 10 years (p=0.04). In other AGs, signiicant differences were not observed between boys and girls. Table 2 presents information on the prevalence rates (number and percentage) of boys and girls from southern Brazil with probable DCD, risk of DCD and TD in each AG, as well as statistical results for sex comparisons.
The results of multivariate analysis indicated signiicant interactions between the classiication in the MABC versus AG versus sex (p<0.0001, η2=0.26). With moderate η2, it
was observed that 26% of variability could be attributed to
differential performance of boys and girls at different ages. Signiicant interactions were observed for manual dexter-ity (p=0.0001, η2=0.38), ball skills (p<0.0001, η2=0.17)
and balance (p<0.0001, η2=0.29). The results showed that
manual dexterity showed the highest level of responsibility for the variation observed (38%); balance was the second most responsible for variations (29%) and ball skills, the third (17%). Continuity tests using univariate analysis were conducted to investigate the signiicant interaction between classiication versus AG versus sex. Tables 3 (manual dex-terity), 4 (ball skills) and 5 (balance) presented means and standard deviations for each AG in the scores obtained by girls and boys, as well as statistical differences in each clas-siication by AG and sex.
Table 3 - Mean and standard deviation of manual dexterity according to diagnostic classiication, age group, and sex
Probable DCD
Mean (SD)
Risk of DCD
Mean (SD)
TD
Mean (SD)
AG 1 (n=151)
Girls 7.0 (3.5) 4.7 (2.8) 1.8 (2.0)
Boys 7.6 (3.7) 5.3 (2.5) 2.3 (2.0)
Sex (p-value) 0.690 0.520 0.250
AG 2 (n=703)
Girls 7.4 (3.2) 5.0 (2.5) 1.9 (1.9)
Boys 7.6 (3.6) 5.6 (2.4) 2.4 (2.2)
Sex (p-value) 0.810 0.270 0.005
AG 3 (n=592)
Girls 8.3 (3.3) 6.5 (2.8) 3.0 (2.6)
Boys 9.7 (3.0) 6.4 (2.3) 3.0 (2.2)
Sex (p-value) 0.010 0.850 0.940
AG 4 (n=141)
Girls 8.3 (3.8) 4.5 (2.8) 2.3 (1.9)
Boys 10.2 (3.2) 6.2 (3.8) 3.1 (2.5)
Sex (p-value) 0.040 0.160 0.230
SD: standard deviation; DCD: developmental coordinative disorder; TD: typical development; AG: age group.
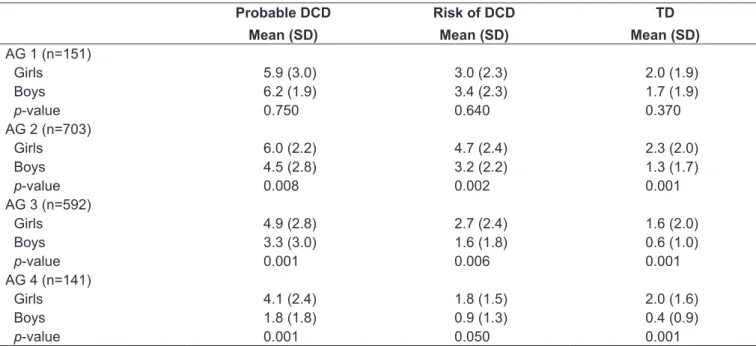
Table 4 - Mean and standard deviation of ball skills according to diagnostic classiication, age group, and sex
Probable DCD
Mean (SD)
Risk of DCD
Mean (SD)
TD
Mean (SD)
AG 1 (n=151)
Girls 5.9 (3.0) 3.0 (2.3) 2.0 (1.9)
Boys 6.2 (1.9) 3.4 (2.3) 1.7 (1.9)
p-value 0.750 0.640 0.370
AG 2 (n=703)
Girls 6.0 (2.2) 4.7 (2.4) 2.3 (2.0)
Boys 4.5 (2.8) 3.2 (2.2) 1.3 (1.7)
p-value 0.008 0.002 0.001
AG 3 (n=592)
Girls 4.9 (2.8) 2.7 (2.4) 1.6 (2.0)
Boys 3.3 (3.0) 1.6 (1.8) 0.6 (1.0)
p-value 0.001 0.006 0.001
AG 4 (n=141)
Girls 4.1 (2.4) 1.8 (1.5) 2.0 (1.6)
Boys 1.8 (1.8) 0.9 (1.3) 0.4 (0.9)
p-value 0.001 0.050 0.001
SD: standard deviation; DCD: developmental coordinative disorder; TD: typical development; AG: age group. In ball skills subtest (Table 4), for all classiications
(prob-able DCD, risk of DCD and TD) in AGs 2, 3 and 4, boys presented signiicant higher scores than girls.
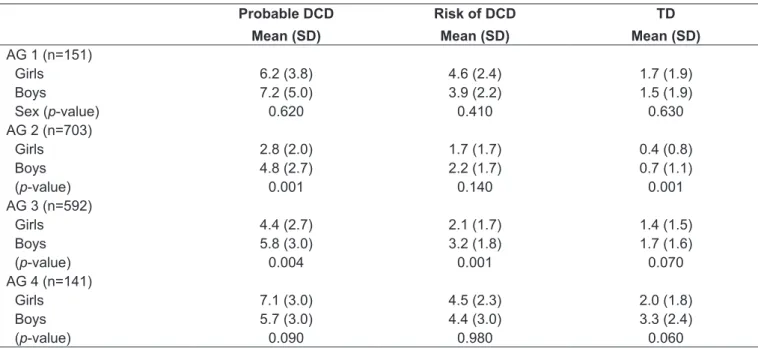
In balance subtest (Table 5), girls showed higher perfor-mance levels than boys in all classiications in AGs 2 and 3; in AG 4, signiicant differences favoring girls were found only in children with TD. In AG 1 there were no signiicant differences in any subtest.
Discussion
and Japan (16.6%)(19). However, the prevalence of cases in
this study was higher to the rates obtained in Canada(5,14),
England(13), Switzerland(12), the Netherlands and Germany(11).
In Brazil no studies were found which included all age groups and a high number of participants, but some Brazilian stud-ies, with speciic age groups, reported lower levels than those found in the present study. For instance, in a study conducted in the state of São Paulo, in the countryside, 10.5% cases of DCD and 14.6% risk of DCD were found in children from 9 to 10 years(20). Souza et al(21) reported approximately 11%
of DCD and risk of DCD in Manaus.
There was higher prevalence of DCD (23.2%) among girls, which is inconsistent with the world estimates of higher prevalence of the disorder in boys(10). Other Brazilian studies
indicate higher prevalence of DCD among girls(20). Both in
international studies and in those developed in Brazil, the prevalence by age group has been little investigated, reduc-ing the possibility of comparisons with previous researches. In the present study, the higher rates are observed in older children (AGs 3 and 4). Two possible explanations can be raised regarding this inding. First, it should be highlighted that the manual dexterity subtest contains the tasks in which the children demonstrated greater dificulties in the present study. Consequently, the results in these tasks contributed for the high prevalence of DCD in AG 4. This subtest has been criticized and it is often not considered as gold standard(22)
for the assessment and diagnosis of coordinative dificulties
in children from the age group between 12 and 14 years. Nevertheless, it was observed that the AG 3 also presented high levels of prevalence of DCD, and gradual increases were observed in the various age groups studied. It is inferred that the shortage of diagnosis of DCD in the irst school years and the lack of compensatory programs, that may offset the restrictions on movement, end up by worsening the motor limitations of children who are in the area between risk of DCD and normality in the developmental course. Over the years, such children avoid motor tasks that cause embarrass-ment, are reluctant in participating in sports activities(5,6) and,
also, because they perceive themselves as little competent in these tasks(23), they worsen their motor limitations and
dif-ferentiate even more from peers who present a history of TD. The high prevalence of DCD and the higher prevalence among older children and girls become extremely worrying, as this disorder tends to exceed the limit of a problem that is only motor and coordinative, interfering with the overall development (24). In Brazil there is a high prevalence of
mo-tor delay in childhood(25,26), with limited opportunities for
low-income children to go through diverse and appropriate experiences for the development in compensatory programs. Compensatory programs are, in general, offered by private clinics, in which the access is economically limited. Another worrying factor is the high prevalence among girls, which may be relecting the cultural context. Traditionally, girls are encouraged to engage in quieter games, such as drawing
Table 5 - Mean and standard deviation of balance according to diagnostic classiication, age group and sex
Probable DCD
Mean (SD)
Risk of DCD
Mean (SD)
TD
Mean (SD)
AG 1 (n=151)
Girls 6.2 (3.8) 4.6 (2.4) 1.7 (1.9)
Boys 7.2 (5.0) 3.9 (2.2) 1.5 (1.9)
Sex (p-value) 0.620 0.410 0.630
AG 2 (n=703)
Girls 2.8 (2.0) 1.7 (1.7) 0.4 (0.8)
Boys 4.8 (2.7) 2.2 (1.7) 0.7 (1.1)
(p-value) 0.001 0.140 0.001
AG 3 (n=592)
Girls 4.4 (2.7) 2.1 (1.7) 1.4 (1.5)
Boys 5.8 (3.0) 3.2 (1.8) 1.7 (1.6)
(p-value) 0.004 0.001 0.070
AG 4 (n=141)
Girls 7.1 (3.0) 4.5 (2.3) 2.0 (1.8)
Boys 5.7 (3.0) 4.4 (3.0) 3.3 (2.4)
(p-value) 0.090 0.980 0.060
and playing with dolls, and boys engage in more vigorous games, such as contact sports(27); this pattern may limit,
for girls, the access to a series of experiences that favor the development of basic motor skills.
The major dificulties observed in children were tasks involv-ing manual dexterity tests. The results show that, regardless of gender, age, and classiication, about 40% of the variability in results can be explained by scores obtained by children in these tasks. Dificulties in manual dexterity of children with DCD and at risk of DCD become gradually higher with increasing age. Moreover, boys with probable DCD from AGs 3 and 4 tend to present an even more unsatisfactory development than girls. The delay in the development of ine motor skills of children with DCD is reported in the literature(28). The accomplishment
of such tasks involves perceptual skills, in which children with DCD have deicits(28). This result worsens as children with
impaired manual dexterity tend to present, as a consequence, greater dificulties in the education process(17,28). When they
become older, these children have even greater dificulties, so continuing assessments and interventions conducted by the school and the relatives are imperative.
Balance tasks have also imposed challenges to the children with DCD and risk of DCD, since they were responsible for 29% of the variability in the performance of boys and girls of different ages. Children with DCD often have dificulties in maintaining postural control and balance(29). In the present
study, the youngest children (AG 1) and the oldest (AG 4) are those who presented the poorer results on balance tasks. There was again a trend towards boys with DCD and at risk of DCD showing worse results than girls, restricted to AGs 2 and 3. Tasks involving ball skills were those in which, in the present study, children with DCD and at risk of DCD pre-sented the best results; however, these are the tasks in which the differences between boys and girls emerge more strongly, not only for children with DCD and risk of DCD, but also for those with TD. This leads to the inference that these are the
tasks that determine, for the most part, the higher prevalence of DCD among girls in the present sample. Traditionally, literature reports better results in ball activities for boys(26,30),
a fact that is due to the higher encouragement and greater opportunities offered to boys to develop skills that involve mastery and control of objects(26).
The high prevalence of cases of DCD proved to be worry-ing, especially considering the limited resources available in Brazil for compensatory and preventive care for these chil-dren. The results regarding dificulties in manual dexterity emphasize the need to identify this disorder before children enter school, so that they are provided with speciic treat-ment. In short, the present results suggest the following interventional goals: improving ine motor skills in children with DCD and at risk of DCD before entering school, and keeping interventional continuity throughout the school years, so that these dificulties will not worsen, as observed in the present study; providing opportunities, particularly in schools, for girls to develop ball skills. It should also be emphasized, the clear need for future investments in different scientiic areas, for the better understanding of the hetero-geneous nature of DCD and its underlying mechanisms.
Although the present study has advanced in relation to previous ones, as it reported the prevalence of DCD in a more representative sample of the population, it has the limitation of being an investigation conducted only in southern Brazil. The lack of inancial and human resources for the routine monitoring of children with DCD and the combination of other evaluation procedures for a more conclusive diagnosis (e.g., involving parents, educators, therapists and pediatri-cians) are other limitations of the study and of the current research on the theme. However, despite limitations, it is believed that the efforts employed to conduct studies in large scale may contribute to raising awareness about this disorder and to changing public policies regarding the care of children with DCD.
References
1. Geuze RH. Postural control in children with developmental coordination disorder. Neural Plasticity 2005;12:183-96.
2. Summers J, Larkin D, Dewey D. Activities of daily living in children with developmental coordination disorder: dressing, personal hygiene and, eating skills. Hum Mov Sci 2008;27:215-29.
3. Wilson BN, Kaplan BJ, Crawford SG, Campbell A, Dewey D. Reliability and validity of a parent questionnaire on childhood motor skills. Am J Occup Ther 2000;54:484-93.
4. Schoott N, Alof V, Hultsch D, Meermann D. Physical itness in children with developmental coordination disorder. Res Q Exerc Sport 2007;78:438-50. 5. Cairney J, Hay JA, Veldhuizen S, Missiuna C, Faught BE. Developmental
coordination disorder, sex, and activity deicit over time: a longitudinal analysis of participation trajectories in children with and without coordination dificulties. Dev Med Child Neurol 2010;52:e67-72.
6. Missiuna C, Moll S, King S, King G, Law M. A trajectory of troubles: parents’ impressions of the impact of developmental coordination disorder. Phys Occup Ther Pediatr 2007;27:81-101.
7. Cummins A, Piek JP, Dyck MJ. Motor coordination, empathy, and social behaviour in school-aged children. Dev Med Child Neurol 2005;47:437-42. 8. Poulsen AA, Ziviani J, Cuskelly M, Smith R. Boys with developmental
9. Gibbs J, Appleton J, Appleton R. Dyspraxia or developmental coordination disorder? Unravelling the enigma. Arch Dis Child 2007;92:534-9.
10. American Psychiatric Association. Diagnostic and statistical manual of mental disorders DSM IV-TR. 4th ed. Washington: Amer Psychiatric Pub; 2000. 11. Jongmans MJ, Smits-Engelsman BC, Shoemaker MM. Consequences of
comorbidity of developmental coordination disorders and learning disabilities for severity and pattern of perceptual-motor dysfunction. J Learn Disabil 2003;36:528-37.
12. Kadesjö B, Gillberg C. Attention deicits and clumsiness in Swedish 7-year-old children. Dev Med Child Neurol 1998;40:796-804.
13. Lingam R, Hunt L, Golding J, Jongmans M, Emond A. Prevalence of developmental coordination disorder using the DSM-IV at 7 years of age: a UK population-based study. Pediatrics 2009;123:e693-700.
14. Tsiotra GD, Flouris AD, Koutedakis Y, Faught BE, Nevill AM, Lane AM et al. A comparison of developmental coordination disorder prevalence rates in Canadian and Greek children. J Adolesc Health 2006;39:125-7.
15. Borremans E, Rintala P, McCubbin JA. Motor skills of young adults with asperger syndrome: a comparative study. EUJAPA 2009;2:21-33.
16. Kirby A, Edwards L, Sudgen D. Emerging adulthood in developmental co-ordination disorder: parent and young adult perspectives. Res Dev Disabil 2011;32:1351-60.
17. Henderson SE, Sudgen DA. Movement assessment battery for children. London: Psychological Coorporation; 1992.
18. Geuze RH, Jongmans MJ, Schoemaker MM, Smits-Engelsman BC. Clinical and research diagnostic criteria for developmental coordination disorder: a review and discussion. Hum Mov Sci 2001;20:7-47.
19. Miyahara M, Tsujii M, Hanai T, Jongmans M, Barnett A, Henderson SE et al. The movement assessment battery for children: a preliminary investigation of its usefulness in Japan. Hum Mov Sci 1998;17:679-97.
20. Pellegrini AM, Souza Neto S, Hiraga C, Bellan P, Oliveira RB, Garcia Filho SM. Diiculdades Motoras em Crianças de 9-10 anos de idade: Seriam os
meninos mais descoordenados. In: Pinho SZ, Saglietti JR, editors. Núcleos de Ensino da UNES. São Paulo: Cultura Acadêmica; 2008. p. 77-88. 21. Souza C, Ferreira L, Catuzzo MT, Corrêa UC. O teste ABC do movimento em
crianças de ambientes diferentes. Rev Port Cien Desp 2007;7:36-47. 22. Van Hartingsveldt MJ, Cup EH, Oostendorp RA. Reliability and validity of the
ine motor scale of the Peabody Developmental Motor Scales-2. Occup Ther Int 2005;12:1-13.
23. Skinner RA, Piek JP. Psychosocial implications of poor motor coordination in children and adolescents. Hum Mov Sci 2001;20:73-94.
24. Smits-Engelsman BC, Henderson SE, Michels CG. The Assessment of children with developmental coordination disorders in the Netherlands: the relationship between the Movement Assessment Battery for Children and the Körpoerkoordinations Test Fur Kinder. Human Mov Sci 1998;17: 699-709.
25. Bobbio TG, Gabbard C, Gonçalves VG, Filho AA, Morcillo AM. Interlimb coordination differentiates Brazilian children from two socioeconomic settings. Pediatr Int 2010;52:353-7.
26. Villwock G, Valentini NC. Percepção de competência atlética, orientação motivacional e competência motora em crianças de escolas públicas: estudo desenvolvimentista e correlacional. Rev Bras Educ Fis Esp 2007;21:245-57.
27. Brazelton TB, Sparrow KD. Touch Points 3 to 6: your child’s emotional and behavioral development. Cambridge: Perseus Books Group; 2002. 28. Feder KP, Majnemer A. Handwriting development, competency, and
intervention. Dev Med Child Neurol 2007;49:312-7.
29. Mackenzie S, Getchell N, Deutsch K, Wilms-Floet A, Clarck JE, Whitall J. Multi-limb coordination and rhythmic variability under varying sensory availability conditions in children with DCD. Hum Mov Sci 2008;27:256-69.