THE USE OF BAND LIMITED STIMULUS IN NEWBORN
HEARING SCREENING WITH AUTOMATED AUDITORY
BRAINSTEM RESPONSES
A utilização de estímulos de banda limitada na triagem
auditiva neonatal com o potencial evocado auditivo
de tronco encefálico automático
Mabel Goncalves Almeida(1), Taise Argolo Sena(2), Isabela Freixo Côrtes Andrade(2),
Milena Nóbrega Campos de Sousa(2), Dóris Ruthi Lewis(3)
(1) Universidade Federal do Espírito Santo – UFES, Brasil. (2) Pontifícia Universidade Católica de São Paulo- PUCSP,
São Paulo, SP, Brasil.
(3) Faculdade de Ciências Humanas e da Saúde da Pontifícia Universidade Católica de São Paulo - PUC-SP, São Paulo, SP, Brasil.
Funding: CAPES
Department where study was conducted: Child Hearing Center (CeAC) at the Communication Disorders Division for Education and Rehabilitation of the Pontiical Catholic University of São Paulo CeAC/DERDIC – PUC-SP
Conlict of interest: non-existent
factors to minimize functional damages in language and speech development, since the central auditory system is highly plastic for a certain period of time1.
Newborn hearing screening with automatic procedures currently uses broadband stimuli, such as the click, that stimulate practically the entire basilar membrane. Therefore, hearing losses in
speciic regions may be underestimated or even
overestimated, due to the differences in audiometric
conigurations2,3.
The need to improve the eficiency of hearing loss identiication procedures and to minimize the
number of false-positive and false-negative cases resulting mainly from mild hearing losses and losses
in speciic frequencies, has led to the development of new stimuli, including speciic frequency stimuli.
INTRODUCTION
Hearing loss identiication and diagnosis
occurring as early as possible, followed by immediate intervention are among the decisive
ABSTRACT
Purpose: to study the results obtained in Automated Evoked Auditory Brainstem Response (A-ABR)
with a frequency-speciic chirp stimulus. Methods: the A-ABR with the stimulus HiLo CE-Chirp ®, the intensity of 35 dB NNA, was recorded in 50 newborns (NB) with and without risk factors for hearing
loss and compared to the Frequency-speciic ABR (FE-ABR). We analyzed the results “pass / fail” for
the stimulus HiLo CE-Chirp ® and the components Hi and Lo, separately, and determined validation measures. The detection time of A_ABR was also determined. Results: A-ABR with HiLo CE-Chirp
® showed high failure (36%) and false positives rates (33%). Signiicant differences between the percentages of “failure” between the two components were observed, and the percentage of component
failure greater than the Hi Lo, in both ears. The mean time to detection of response was 63.8 seconds
for the right ear and 77.9 for the left ear, with statistically signiicant differences between the ears (p =
0.002). Conclusion: the band stimulus presented limited mean sensing response considerably small,
high sensitivity, however, due to high rate of false positives, showed low speciicity, there is a need for improvement in technique or stimulus for its future application clinical A-ABR.
Thus, the purpose of the present paper was to study the results obtained in a NHS using automated auditory brainstem response (AABR) with band-limited chirp stimulus.
METHODS
This is a descriptive-analytical, quantitative, cross-sectional and experimental research. The
present study was approved by the research ethics committee under protocol number 118/2011.
In order to be included in the study, the newborns could not have any suspicion of neurological disorders and/or syndromes suggested on their records, outer ear or ear canal agenesis and should be more than 24 hours old with gestational age
equal to or greater than 37 weeks. The newborns
who either passed or refered hearing screening by Transient Otoacoustic Emissions (TOAE) and/or click-AABR, conducted by the hospital NHS, with or without risk indicators for hearing loss were included in the study.
The research medical record was performed
irst, followed by electrophysiological procedures:
AABR with a Hi-Lo CE-Chirp® stimulus, Click-ABR and TB-ABR to 500 Hz and 2 kHz stimuli.
The TB-ABR was used as the gold standard in order to ensure and to verify the sensitivity and
speciicity of the responses obtained by the AABR. The equipment used was the Interacoustics MedPC Eclipse Black Box – software EP25.
The greatest delection occurring between 5 and
20ms after stimulus presentation was considered the V wave. The lowest threshold level researched was 20 dBnHL. For the TB-ABR to 500Hz, the air conduction (AC) record was taken in intensities of
60, 30 and 80 dBnHL, in this sequence. For the
TB-ABR to 2 kHz, AC was conducted in intensities
40, 20 and 80 dBnHL, in this sequence. Bone
Conduction (BC) research was performed in 40 and
20 dBnHL, in this sequence, at 500 Hz and 2 kHz.
In the case of absence of response in one of the evaluated intensities, the intensity was increased in steps of 5dB in AC and 10dB in BC until wave V was
able to be identiied and reproduced. The maximum
intensity researched for AC was 100dBnHL and 50dBnHL for BC.
For TB-ABR at 500 Hz the intensity of 35 dBnHL and 20 dBnHL was considered as the normal pattern for AC and BC, respectively. The intensity of 30 dBnHL was considered the normal pattern for AC and 30dBnHL for BC on the 2kHz, according to the British Columbia EarlyHearingProgram- BCEHP (2008) protocol16.
The NHS with AABR was conducted with the
Hi-Lo CE-Chirp® stimulus in 35dBnHL intensity.
Initially, the scientiic community turned its
attention to studying the reliability of the broadband chirp stimulus in diagnostic 4-9 and automatic10,11
procedures. This stimulus was built in order to try to compensate the time delay caused by the sound wave travelling along the basilar membrane through
the promotion of the delay of high frequencies in relation to the low frequencies of the stimulus, thus
producing simultaneous stimulation of all cochlear regions. The simultaneous stimulation of the cochlea provides an improvement in neural synchronicity
and, consequently, an increase in the amplitude of
wave V when compared to the click, especially in weak and moderate intensities4,12,13 . The increase in
amplitude leads to a decrease in the time of exami -nation since it promotes an improvement in the signal-noise relationship, one of the main param-eters for determining the presence of response7.
The results obtained from the broadband chirp
led the scientiic community to develop and study, experimentally, speciic frequency chirps. Studies
with diagnostic procedures have shown that greater
wave V amplitudes were obtained with the speciic frequency chirp, when compared to those obtained
using tone burst stimulus in adults14. Furthermore,
low frequency chirps lead to a higher synchron
-icity of neural discharge, which relects in greater
amplitude, especially in weak and moderate inten-sities15. Studies using the Auditory Steady-State
Response (ASSR) that used speciic frequency
chirps named narrow band CE-chirps® have also
shown large wave V amplitudes with decrease in
examination time 5-7. Shorter latencies and greater
amplitudes (wave V) for chirp, especially in weaker intensities (20-40 dB HL) were also reported by a national study when comparing results from the toneburst evoked auditory brainstem response (TB-ABR) and narrow band CE-chirps® of normal
hearing children8.
The application of band-limited chirps or speciic frequency band stimuli has also proven promising
in procedures of Newborn Hearing Screening (NHS) 13.
One of the irst studies using a band-limited
stimulus in hearing screening procedure was
conducted in 2007, and showed that this technique
may be used, but should be improved13. To the
present moment, there have been few studies
showing results about the usage of speciic frequency stimuli in NHS.
In this same context, the improvement of technol -ogies related to auditory rehabilitation reinforces the need for development and improvement of proce-dures that are capable of identifying all hearing loss
both ears was assessed using Kappa statistics and
the agreement between the two frequency ranges (“Hi test” and “Lo test”) was assessed using the
Mcnemar test.
A descriptive analysis of the response detection time on the AABR with the Hi-Lo CE-chirp® stimulus
was conducted for the cases with “Pass” results on the inal test.
In this study, the TOAE results were described only for the newborns with altered results in the TB-ABR.
RESULTS
The casuistic is composed by 50 newborns, 22 (44%) males and 28 (56%) females, and seven had risk factors for hearing loss (hereditary factors, congenital infection, hyperbillirubinemia/ blood transfusion). Upon screening, the newborns had a mean of 34.34 (24-44.68) hours of life and mean gestational age of 37.5 weeks.
This casuistic did not have cases where the results (normal/abnormal) from the TB-ABR to 500Hz and 2 kHz stimuli were different. Either both
frequencies had threshold level within established
normal standards, or both had altered. In other words, there were no cases where the newborn had
normal results for one of the frequencies and altered
results for the other.
The results show that 96% of the newborns had normal results in both ears, 2% altered in both ears and 2% altered in only one ear. One case of bilateral hearing loss and one case of unilateral hearing loss were observed.
Among the altered cases, one newborn had a disorder suggestive of bilateral auditory neuropathy. The second case had a unilateral profound sensory
neural hearing loss. Conductive or mixed hearing
losses were not observed in the present study. The percentage distribution of the results of the AABR with Hi-Lo CE-chirp® stimulus and TB-ABR for the right ear showed that of the 49 newborns with normal TB-ABR, 38 passed the AABR with Hi-Lo CE-chirp® stimulus while 11 newborns failed it. On the left ear, for the 48 newborns with normal gold standard, only 26 passed the AABR. There were no false negative cases observed for both ears.
This study describes the results (Pass/Refer) of the AABR with Hi-Lo CE-chirp® stimulus on the right and left ears. Twenty (40%) newborns had different
results on both ears, with statistically signiicant differences between the ears (p=0.012).
The left ear has a greater number of “refer” results (48%) than the right ear (24%). The “Pass” and “Refer” results, on the left ear were similar (52%
and 48%, respectively). The Hi-Lo CE-Chirp® stimulus is composed by two
frequency ranges: the range containing the high frequency spectrum, between 1414 and 11313
Hz, named Hi and the range containing the low
frequency spectrum between 177 and 1414 Hz,
called Lo. Both ranges were presented
simultane-ously and separated by a cut-off frequency of 1500
Hz. The stimulus was presented at a 90Hz repetition
rate in alternate polarity. The maximum time estab -lished for the determining the presence/absence of response in the AABR was 180 seconds. The
interacoustics Titan software ABRIS440 was the
equipment used for testing.
The newborns with abnormal gold standard results were submitted once again to hearing screening by Transient Otoacoustic Emissions (TOAE) using an
otodynamics otoport Lite equipment with 84dBSPL
intensity and non-linear click stimulus.
All procedures were conducted at the maternity
Ward, before hospital discharge.
There was no order observed for procedure conduction, and all procedures were completed in both ears.
All newborns with altered results in the TB-ABR were referred for audiological diagnosis at a high
complexity reference center.
Data analysis
A descriptive analysis of AABR results (Pass/ Refer) with Hi-Lo CE-chirp® stimulus and for Hi and
Lo components, separately, in 35 dBnHL intensity was conducted. Independence among the results of
both ears was assessed using the Qui-square test
for the results obtained from the Hi-Lo CE-chirp® stimulus; for the Hi-Lo components, Fisher’s exact
test was used (Fisher and van Belle, 1993).
Result analysis considered the existence of three different tests: the “Hi-Lo Test” when results referred
to the inal (Pass/Refer) result, the “Hi Test” when
the (Pass/Refer) results were analyzed only for the
Hi component of the Hi-Lo CE-chirp® stimulus, and
the “Lo Test” when the (Pass/Refer) results were
only analyzed for the Lo component.
Diagnostic skill measures (sensitivity, speciicity, PPV, NPV), Youden index and the Kappa coeficient
were determined. In this study, the diagnostic skill measures were determined considering the gold
standard (frequency-speciic-ABR with tone bursts
stimuli) normal when the BC threshold level for the
frequencies of 500 Hz and 2 kHz were less than
20 and 30 dBnHL, respectively. Therefore, the gold standard was considered altered when the threshold level for AC and BC in 500 Hz and/or 2kHz were not within the established normal patterns.
Table 1 shows the values for sensitivity,
speci-icity, Positive Predictive Value (PPV) and Negative
Predictive Value (NPV), accuracy, Youden test and
Kappa coeficient, obtained for the AABR with Hi-Lo CE-chirp® stimulus, based on the results from the
gold standard test (TB-ABR). Low Kappa coefi -cient and PPV values stand out. The low values of these statistics are due to the small prevalence of newborns with altered results.
When comparing the AABR results to those of
the gold standard, it was observed that 22% of the newborns had different results on the right ear and 44% on the left ear.
The right ear had 12 “refer” cases on the AABR,
of which 11 were false positive and one true positive
case. Concerning the left ear, 24 “refer” cases were
observed, of which 22 were false positives and two true positives. A high rate of false positives was observed on the AABR with Hi-lo CE-chirp® stimulus, especially on the left ear.
Table 1 – AABR test measures with Hi-Lo CE-chirp® stimulus in 35 dBnHL intensity (n=50)
Measure RE LE
Sensitivity 100.0 100.0
Speciicity 77.6 54.2
PPV 8.3 8.3
NPV 100.0 100.0
Accuracy 78.0 56.0
Youden Index 77.6 54.2
Kappa 0.12 0.09
Key: PPV – Positive Predictive Value; NPV- Negative Predictive Value RE – Right Ear; LE – Left Ear
The results for each limited band of the Hi-Lo CE-chirp® stimulus were analyzed separately, for thee Hi component (“Hi Test”) and for the Lo
component (“Lo component”). The gold standard
used for the “Hi Test” was the 2000Hz TB-ABR and
for the “Lo Test” the 500Hz TB-ABR.
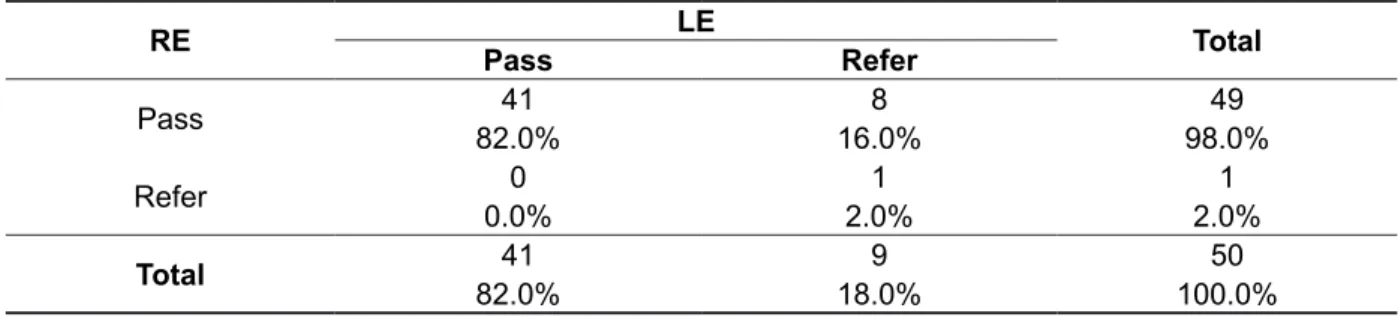
Table 2 shows the results (Pass/Refer) for the “Hi Test” on left and right ears. Eight (16%) newborns
had different results among the ears. The number
of “ Refer” results of the left ear was greater than of the right ear. The p-value found on Fisher’s exact
test indicates Independence between the results of both ears.
Table 2 – Distribution of results (pass/refer) of the “Hi test” in right and left ears (n=50)
RE LE Total
Pass Refer
Pass 41 8 49
82.0% 16.0% 98.0%
Refer 0 1 1
0.0% 2.0% 2.0%
Total 41 9 50
82.0% 18.0% 100.0%
the obtained values were 100%, 85.4%, 22.2% and
100%. The accuracy and Youden index had results
of 100% on the right ear and 86% and 85.4% on the left ear.
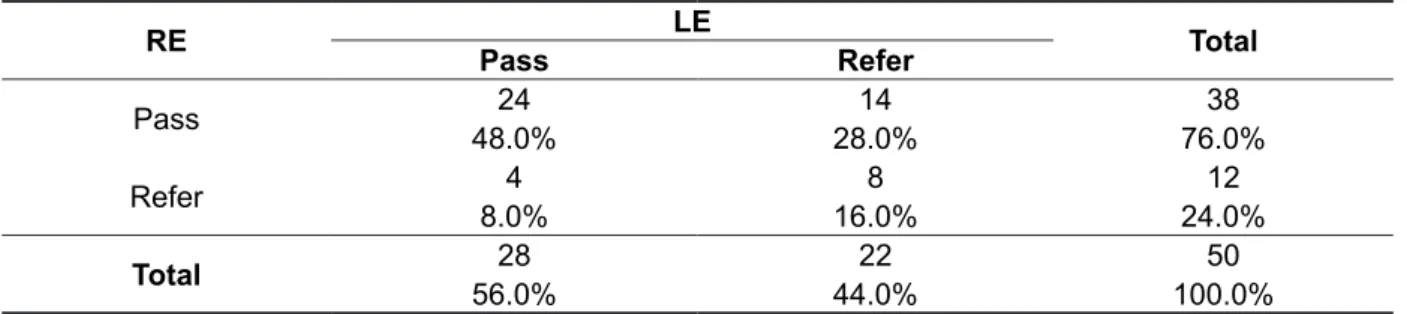
Table 3 shows the analysis of “Lo Test” results
(Pass/Refer) for the right and left ears. Eighteen (36%) newborns had different results among the ears.
The analysis of the “Hi Test” according to the
gold standard (TB-ABR to 2000 Hz stimuli) showed total agreement of the obtained results for the right
ear (Kappa= 1). On the left ear, there were different results in seven (14%) newborns (Kappa= 0.32). No
false negatives were observed in any ear; however,
the number of “Refer” results and false positives
was greater for the left ear. The right ear had 100%
sensitivity, speciicity, PPV, NPV, and for the left ear,
Table 3 – Distribution of results (pass/refer) of the “Lo test” in right and left ears (n=50)
RE LE Total
Pass Refer
Pass 24 14 38
48.0% 28.0% 76.0%
Refer 4 8 12
8.0% 16.0% 24.0%
Total 28 22 50
56.0% 44.0% 100.0%
Key: RE= Right Ear; LE= Left Ear Fisher’s exact Test: p=0.070
The comparative analysis of the “Lo Test” result
with its respective gold standard (TB-ABR to 500 Hz stimuli) showed that 11% of the newborns had
different results on the right ear (Kappa= 0.12) and 40% on the left ear (Kappa = 0.10). A greater number of “refer” and false positives were observed
on the left ear. The right ear had values for
sensi-tivity, speciicity, PPV, NPV of 100%, 77.6 %, 8.3 %
and 100%, respectively. For the left ear, the obtained values were 100%, 85.4 %, 22.2 % and 100 %. The
accuracy and Youden index for the right ear were
100% and for the left ear, 86% and 85.4%.
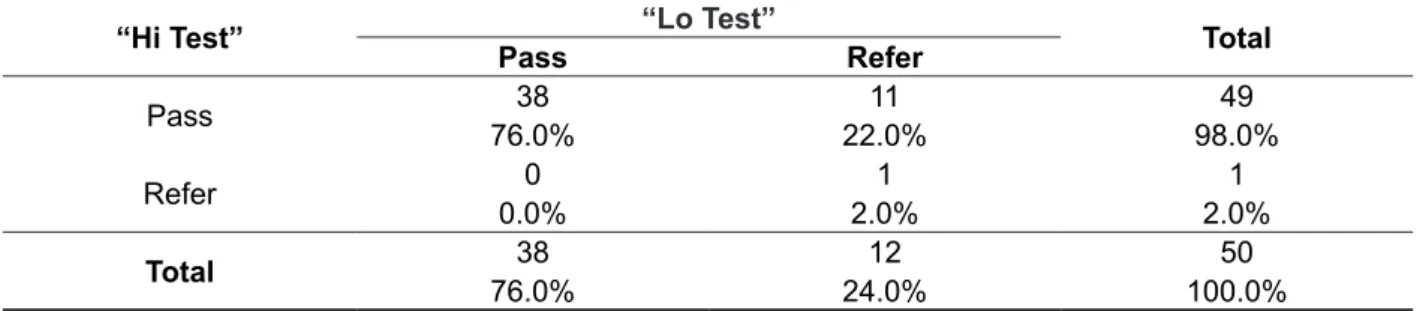
A joint analysis of the results (Pass/Refer) was conducted for each component of the Hi-Lo CE-chirp® stimulus, or, for the “Hi Test” and the “Lo
Test”, on the right and left ears, respectively (Tables 4 and 5).
For the right ear, the number of “Pass” results was greater on the “Hi Test” when compared to the
“Lo Test”. There were no “refer” cases on the “Hi
Test” and “Pass” on the “Lo Test”. On the left ear,
two cases where the “Pass” result on the “Lo Test”
and “Refer” on the “Hi Test” were observed. The
“Refer” rate was always greater on the “Lo Test” and
Table 4 – Distribution of results (pass/refer) for the “Hit test” and “Lo test” on the right ear (n=50)
“Hi Test” “Lo Test” Total
Pass Refer
Pass 38 11 49
76.0% 22.0% 98.0%
Refer 0 1 1
0.0% 2.0% 2.0%
Total 38 12 50
76.0% 24.0% 100.0%
McNemar Test: p=0.001
Table 5 – Distribution of results (pass/refer) for the “Hit test” and “Lo test” on the left ear (n=50)
“Hi Test” “Lo Test” Total
Pass Refer
Pass 26 15 41
52.0% 30.0% 82.0%
Refer 2 7 9
4.0% 14.0% 18.0%
Total 28 22 50
56.0% 44.0% 100.0%
McNemar Test: p=0.002
There was a statistically signiicant difference between the “refer” percentages on both tests, and the “refer” percentage on the “Lo Test” was greater
than on the “Hi Test”, on both ears.
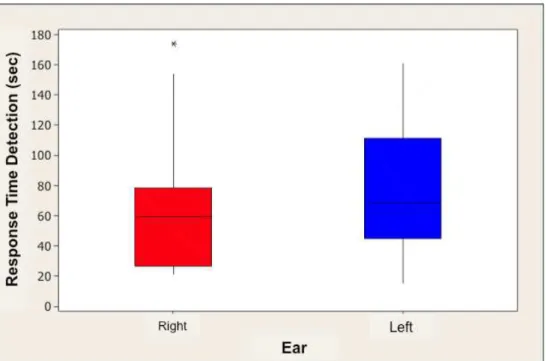
Descriptive and comparative analysis of the response detection time of the AABR with Hi-Lo CE-chirp® stimulus in 35 dBnHL intensity
The response detection time for the newborn group that passed the AABR with Hi-Lo CE-chirp®
stimulus was calculated and shown in table 6. The left ear had higher mean time for response detection when compared to the right ear; with similar standard deviations for both ears.
Time distributions may be seen, in approxi
-mation, on the box-plots in Figure 1.
Comparing the mean times on both ears though
the t-paired test, there is a signiicant difference between the mean times of both ears (p=0.002),
and the mean of the right ear is smaller than the left ear.
Table 6 – Descriptive statistic values for response detection time (seconds) for the AABR with the Hi-Lo CE-chirp® stimulus on the right and left ears
Ear n Mean Standard
Deviation Minimum Median Maximum
Right 38 63.8 41.8 21 59.5 174
produce responses from undesirable frequency
regions in the basilar membrane, and may thus limit its clinical usage.
In the present study, the number of “refer” results was always greater for the “Lo Test” when compared to the “Hi Test”, so that it may not be believed that
the band-limited high frequency, used in the studied stimulus could have “helped” the responses obtained with the band-limited lower frequency. In addition,
the occurrence of two cases where the results were
“Pass” for the Lo component (“Lo Test) and “Refer”
for the Hi component (“Hi Test”) on the left ear. It
should be noted that these cases had normal results for the gold standard in 500 Hz and 2 kHz.
The number of false positives observed in this study for the Hi-Lo CE-chirp® stimulus was 22% (11/50 newborns) on the right ear and 44% (22/50 newborns) on the left ear. Considering both ears, 33% (33/100) of false positives were observed. No false negative cases were observed.
The results obtained for the Lo component
that inluenced the inal AABR result may be due
to the fact that the AABR is registered along with other electrical activities, and the sound should
be identiied among noise; therefore, a favorable
signal-noise relationship becomes harder to
achieve. A 2002 study with speciic frequency
chirps observed that the amplitude of wave V is
smaller for lower frequencies14. Therefore,
consid-ering the results obtained for the Lo component of the CE-chirp® (“Lo Test”), detecting a response in DISCUSSION
This study aimed to analyze the results from
the AABR using stimulus with speciic frequency
ranges, presented simultaneously on the evaluated ear.
Of the 50 newborns who underwent the AABR,
12/50 (24%) “Failed” on the right ear and 24/50
(48%) on the left ear.
In this study, 28 newborns who “Passed” only
one of the components, of which 11 on the right ear
and 17 on the left ear. Thus, even though a “Pass”
result was obtained in one of the components, the
inal AABR result was “Refer”. Considering both right and left ears, 29% (29/100) had a “Refer” on the Lo
component, while 10% (10/100) had a “Refer” on
the Hi component. Therefore, the “Refer” results for
the Hi and Lo components directly inluenced the
speciicity analysis of the Hi-Lo CE-chirp® stimulus.
A study comparing a low frequency chirp (nominal frequency 100-480 Hz) to a 250 Hz tone observed
that in the presence of masking, the wave V ampli-tudes decrease, showing an important participation
of the high frequency components in obtaining
an electrophysiological response15. According to
researchers14 in spite of the chirp improving neural
synchronicity, the characteristics of frequency
delay, needed to compensate cochlear delay limit
the stimulus’ frequency speciicity. Furthermore,
the greatest spectral dispersion observed in this stimulus, when compared to tone burst, may
number of referrals for diagnosis and, thus, of the costs of hearing screening programs. The greatest
rate of “refer” on the left ear may have been due
to the occurrence of disorders in sound conduction
caused by the remainder of vernix in this ear since,
in this study; newborns who passed the NHS with TOAE, as well as those who failed it were assessed. In this study, in order to ensure a direct comparison between the ears, variables such as difference in impedance between the ears, order to begin evalu-ation and the newborn’s state of consciousness were controlled. However, variables such as
residual noise and luid in ears were not controlled and may have inluenced the indings. Rodrigues (2012) has not observed statistically signiicant
differences in the amplitude and latency of wave V for the ABR with click and narrow band CE-chirp®
stimuli, showing that the stimulus does not behave
differently in different ears, which could inluence
the response detection in automated procedures. Therefore, the differences between the ears found in this study are probably due to differences in middle ear conditions since the author, differently from this study, evaluated only newborns and children with present otoacoustic emissions.
Thus, there is a need for new studies that will control middle ear conditions, not only with otoacoustic emission records, but also conducting
tympanometry, which would explain not only the
elevated number of false positives of the HiLo CE-chirp® stimulus, especially of the Lo component, but also the differences between both ears found in this study. These complementary procedures would
enable discussions of issues such as if a “Refer”
on the Lo component is caused by a conduction disorder or really by the stimulus characteristic and form of stimulation.
The mean type for response detection of the
“Pass” cases in the NHS was approximately 69.76
seconds (17-174 seconds), similar time as that in the study with steady-state potential5 that observed
a response detection time that varied between 76 and 109 seconds between the different types of
studied frequency speciic chirps. Better results
were observed in a study with band-limited stimulus in automated hearing screening procedures13.
CONCLUSION
• The HiLo CE-chirp® stimulus has high sensitivity and low response detection time. However,
it had low speciicity for this small sample,
especially due to the results from the stimulus’
Lo component.
• The indings show that there is still need
for improvement of this stimulus for use in weak intensity (35 dBnHL) may have been more
dificult. Furthermore, low frequencies suffer greater inluence of temporary conductive disorders such as the presence of vernix or secretion. In clinical audiology, middle ear disorders frequently account for greater hearing loss in the lower frequencies.
Another issue in this context is the fact that the frequencies chosen as gold standard had different spectral characteristics than the frequencies used in
the automated procedure, especially regarding the
Lo component. This fact may have inluenced the
normality results for the gold standard and
conse-quently the determination of the speciicity and
sensitivity of the automated procedure. However, it
should be noted that the frequencies used as gold
standard have met the clinical registration
possi-bilities of the Frequency Speciic-ABR and the inter -national protocol16 that recommends that a minimum
hearing test should include the frequencies of
500 Hz and 2000 Hz and that these have reliable calibration data.
On the other hand, other studies have been
showing that the low frequency CE-chirp® have greater amplitudes than tone burst15. A national
study8 with newborns and small children has shown
greater wave V amplitudes for the narrow band CE-chirp® in the frequencies of 0.5 and 2 kHz (0.148
uV and 0.166 uV, respectively) when compared to tone burst, especially in weak intensities 20-40 dB, which, in theory, would make this a promising
stimulus to be used in NHS equipment.
An international study with adults showed that
the low frequency chirp leads to a greater synchron -icity of neural discharge, which is seen in the greater amplitude in relation to tone burst, especially in weak and moderate intensities15. However, the same
authors state that differences, between the stimuli, in spectral magnitude may lead to differences in
their neural excitement pattern and, consequently,
to differences in the size of wave V amplitude15.
Furthermore, it should be stressed that, in the present study, both limited bands of the HiLo CE-chirp® were presented at the same time, on the newborn’s same ear. Researchers13 believe
that the simultaneous presentation of both
band-limited stimuli may reduce the eficiency in response
detection due to interference caused by the stimuli. In spite of the present study having used a cut-off
frequency between frequency ranges, the result may still have been inluenced by the interference
caused by simultaneous presentation.
The high rate of “Refer” for the Lo component (“Lo Test) and, consequently for the HiLo CE-chirp®
stimulus (“HiLo Test”), with normal gold standard,
increases the rate of false positives and decreases
ACKNOWLEDGMENTS
To the Coordination for the Improvement of Higher Education Personnel (CAPES) for funding
this study. To Bue Kristensen, director of external
relations, for the guidance and technical accessory regarding the studied stimulus.
automated hearing screening procedures, since the false positive rate is an important fact for program success and an indicator of service
quality. Therefore, further studies should be
conducted and stimulus or response detection method optimization may be necessary, as well as using a higher level of stimulus intensity.
REFERENCES
1. Sharma A, Kraus N, McGee T, Nicol T.
Developmental changes in P1 & N1 auditory responses elicited by consonant-vowel syllables. Clin. Neurophysiol. 1997;104:540–5.
2. Hurley RM, Hurley A, Berlin CI. Development of low-frequency tone burst versus the click
auditory brainstem response. J Am Acad Audiol.
2005;16:114-21;quiz 122.
3. Stapells DR. Frequency-speciic evoked potential
audiometry in infants. In R. C. Seewald (Ed.) A
Sound Foundation Through Early Ampliication. Basel: Phonak AG 2000a. p13-31.
4. Dau T, Wegner O, Mellert V, Kollmeier B. Auditory
brainstem responses with optimized chirp signals compensating basilar-membrane dispersion. J Acoust Soc Am. 2000;107:1530-40.
5. Stürzebecher E, Cebulla M, Elberling C, Berger T. New eficient Stimuli for Evoking Frequency-Speciic
Auditory Steady-State Response. J Am Acad Audiol. 2006;17:448-61.
6. Cebulla M, Stürzebecher E, Elberling C. Objective
detection of auditory steady-state
responses-comparison of one-sample and q-sample tests. J
Am Acad Audiol. 2006;17:93-103.
7. Elberling C, Don M, Cebulla M, Stürzebecher
E. Auditory steady-state responses to chirp stimuli based on cochlear traveling wave delay. J Acoust Soc Am. 2007;122(5):2772-85.
8. Rodrigues GRI. Estímulos CE-chirp® e narrow band CE-chirp® na avaliação eletroisiológica
audição: resultados clínicos em neonatos, lactentes e crianças. [Tese]. São Paulo(SP): Pontifícia Universidade Católica de São Paulo; 2012.
9. Rodrigues GRI, Lewis DR. Comparação dos estímulos clique e CE-chirp® no Registro do
Potencial Evocado Auditivo de Tronco Encefálico. Rev Soc Bras Fonoaudiol. 2012;17(4):412-6. 10. Van den Berger E, Deiman C, Van Straaten HL.
MB11 BERAphone hearing screening compared to
RESUMO
Objetivo: estudar os resultados obtidos no Potencial Evocado Auditivo de Tronco Encefálico Automático (PEATE-A) com um estímulo chirp de bandas limitadas. Métodos: o PEATE-A com o estímulo HiLo
CE-Chirp®, na intensidade de 35 dB nNA, foi registrado em 50 recém-nascidos (RN) com e sem
indi-cadores de risco para deiciência auditiva (IRDA) e comparado ao PEATE por Frequência Especíica (PEATE-FE). Foram analisados os resultados “passa/falha” para o estímulo HiLo CE-Chirp® e para os componentes Hi e Lo, separadamente e determinadas medidas de validação. O tempo de detecção de resposta no PEATE-A também foi determinado. Resultados: o PEATE-A com o HiLo CE-Chirp®
apresentou alta taxa de falha (36%) e de falso-positivos (33%). Diferenças signiicantes entre as por
-centagens de “falha” entre os dois componentes foram observadas, sendo a porcentagem de falha
no componente Lo maior que no Hi, nas duas orelhas. O tempo médio de detecção de resposta foi
de 63,8 segundos para a orelha direita e 77,9 para a orelha esquerda, sendo observadas diferenças estatisticamente signiicantes entre as orelhas (p=0,002). Conclusão: o estímulo de banda limitada
apresentou tempo médio de detecção de resposta consideravelmente pequeno e alta sensibilidade, no entanto, devido a alta taxa de falso-positivos, apresentou baixa especiicidade, mostrando a impor -tância de novos estudos direcionados, principalmente, para o aperfeiçoamento da técnica e do estí-mulo, buscando futura aplicação clínica no PEATE-A.
14. Bell SL, Allen R, Lutman ME. An Investigation
of the use of band-limited chirp stimuli to obtain the auditory brainstem response. Int J Audiol. 2002;41(5):271-8.
15. Wegner O, Dau T. Frequency speciicity of
chirp-evoked auditory brainstem responses. J Acoust Soc Am. 2002;111:1318-29.
16. British Columbia early hearing program (BCEHP). Diagnostic audiology protocol [pdf document] 2008. [acessoem 12 jan 2011]. Disponívelem: http://www.
phsa.ca/NR/rdonlyres/EADo&2EA-OCOE-40C6-83A-557357C14DA5/32441/DAAGPProtocols1.pdf. ALGO portable in a Dutch NICU: a pilot study. Int J
Pediatr Otorhinolaryngol. 2010;74(10):1189-92.
11. Cebulla M, Shehata-Dieler W. ABR-based newborn hearing screening with MB11 BERAphone1
using an optimized chirp for acoustical stimulation. Int J Pediatr Otorhinolaryngol. 2012;76:536-43.
12. Cebulla M, Elberiling C. Auditory Brain Stem
Responses Evoked by Different Chirps Based
on Different Delay Models. J Am Acad Audiol.
2010;21(7):452-60.
13. Cebulla M, Stürzebecher E, Elberling C, and Müller J. “New click-like stimuli for hearing testing,”
J Am Acad Audiol. 2007;18:725-38.
Received on: July 11, 2013
Accepted on: March 08, 2014
Mailing address:
Mabel Goncalves Almeida
Avenida Hugo Viola, 750 apt 503 Vitória – ES – Brasil
CEP: 29060-420