Control of diabetes and fibrinogen levels as
well as improvement in health care might
delay low cognitive performance in societies
aging progressively
Controle do diabetes e dos níveis de fibrinogênio, bem como melhora no cuidado com a
saúde, podem retardar o baixo desempenho cognitivo em sociedades que apresentam
envelhecimento progressivo
Daniele Almeida Lopes1, Suzana Alves de Moraes2, Isabel Cristina Martins de Freitas1
ABSTRACT
Objective:To know the prevalence and factors associated to low cognitive performance in a representative sample of the adult population in a society aging progressively.Method:Cross-sectional population-based study carried out in a three-stage sampling: 81 census tracts (primary sampling unity) were randomly selected, followed by 1,672 households and 2,471 participants (weighted sample) corresponding to the second and third stages, respectively. The outcome prevalence was calculated according sociodemographic, behavioral and health related variables. Crude and adjusted prevalence ratios were estimated using Poisson regression.Results:The prevalence of low cognitive performance was high, mainly among females, and indicated linear trends into categories of age, schooling, income, plasma fibrinogen and self-reported health status. In multivariate models, gender, diabetes, fibrinogen and self-reported health status presented positive associations, while schooling, employment and sitting time presented negative associations with the outcome.Conclusion:Interventions related to diabetes and fibrinogen levels control as well as improvement in health care might delay low cognitive performance in societies aging progressively as such the study population.
Keywords:cognitive impairment, adults, associated factors, cross-sectional studies.
RESUMO
Objetivo: Estimar a prevalência e os fatores associados ao baixo desempenho cognitivo em amostra representativa de adultos pertencentes a uma população com envelhecimento progressivo. Método: Estudo transversal, de base populacional, conduzido em amostra selecionada em três estágios: 81 setores censitários (unidade primária de amostragem) foram selecionados aleatoriamente, seguidos por 1.672 domicílios e 2.471 participantes (amostra ponderada), correspondendo ao segundo e terceiro estágios, respectivamente. A prevalência do desfecho foi calculada segundo fatores sociodemográficos, comportamentais e relacionados à saúde. Razões de prevalência brutas e ajustadas foram estimadas pela regressão de Poisson. Resultados: A prevalência de baixo desempenho cognitivo foi elevada, principalmente nas mulheres, indicando gradiente linear em relação à idade, à escolaridade, à renda, aos níveis de fibrinogênio e à saúde autorreferida. Nos modelos multivariados, sexo, diabetes, fibrinogênio e saúde autorreferida apresentaram associações positivas, enquanto escolaridade, trabalho e tempo sentado apresentaram associações negativas com o desfecho.Conclusão:Medidas de controle do diabetes, dos níveis de fibrinogênio plasmático e melhora da atenção à saúde poderão retardar o baixo desempenho cognitivo em sociedades que apresentam envelhecimento progressivo como a população do estudo.
Palavras-chave:desempenho cognitivo, adultos, fatores associados, estudos transversais.
Over the last few decades and as a result of the demo-graphic transition, the relative increase in the number of elderly people in the population has led to a significant
increase in the prevalence of chronic diseases1. The aging
process may be followed by a decline in cognitive perform-ance, with gradual impairment of written and spoken
1Núcleo de Epidemiologia (NEPI), Escola de Enfermagem de Ribeirão Preto, Universidade de São Paulo, Ribeirão Preto SP, Brazil;
2Departamento de Enfermagem Materno-Infantil e Saúde Pública, Escola de Enfermagem de Ribeirão Preto, Universidade de São Paulo, Ribeirao Preto SP,
Brazil.
Correspondence:Suzana Alves de Moraes; Av. Bandeirantes, 3900; 14040-902 Ribeirão Preto SP, Brasil; E-mail: [email protected]
Conflict of interest:There is no conflict of interest to declare.
Received 21 March 2014; Received in final form 12 September 2014; Accepted 02 October 2014.
DOI:10.1590/0004-282X20140189
language, learning, motor skills, reasoning and memo-ry capacity2.
Impairment of cognitive function is especially character-ized by progressive loss of intellectual abilities, such as loss of the capacity for discernment, loss of attention and percep-tion, and loss of visual and spatial skills. Such losses conse-quently have direct implications for these individuals’ lives and may interfere in their day-to-day activities, in maintain-ing their social relationships and in their professional per-formance, thereby contributing towards reducing their wellbeing and quality of life3.
Different authors have identified associations between low cognitive performance (LCP) and sociodemographic4,5,
behavioral6,7 and health-related factors8,9. The influence of
age and schooling level on LCP have been consistently observed, as have certain habits such as smoking and alco-hol abuse and diseases such as hypertension and diabetes.
In Brazil, studies relating to cognitive performance have been concentrated in state capitals of southern and south-eastern regions and have mainly related to the elderly population. Population-based epidemiological studies in municipalities away from the state capitals, with alloca-tion of representative samples of adults, remain scarce. Considering those limitations, the present study aims to know the prevalence and factors associated to low cognitive performance in a representative sample of the adult popu-lation living in Ribeirao Preto, state of Sao Paulo, Brazil.
METHOD
Study design and sampling
Cross-sectional population-based epidemiological study carried out in Ribeirao Preto, SP, between 2007 and 2008, as part of a larger project named“Prevalence of cardiovascu-lar diseases and identification of associated factors among adults living in Ribeirao Preto, SP” (EPIDCV Project). The sampling process was developed in three stages, and the pre-cision of the estimates was calculated on a sample of 1,205 individuals. The response rate was 82.1% and, 1,133 indivi-duals of both gender, aged 30 years or over attended. The variability resulting from multiple stages of draws was cor-rected and gave rise to a weighted sample (nw)10 of 2,471
participants. Details of sampling were described in a pre-vious published paper11.
Outcome
Low cognitive performance (LCP). Information on cognit-ive performance was obtained by applying the Mini-Mental State Examination (MMSE), proposed by Folstein et al.12
and validated in Brazil by Bertolluci et al.5. For the purpose
of the present study, the MMSE scores (range 0 to 30) were classified in two categories, using the 25thpercentile, which
corresponds in this population to the MMSE score of 25. Thus, based on that cutoff the participants were classified as low cognitive performance (MMSE scores#25), and high cognitive performance (MMSE scores. 25).
Variables
Sociodemographic
Gender (both gender); age classified in 10-year intervals; schooling level classified according the number of years of formal education; individual income classified according to tertiles; employment (yes or no); and marital status (defined according to the presence or absence of a partner, independ-ent of whether there was any formal union).
Behavioral
Years of smoking, corresponding to the total number of years as a smoker (classified according to tertiles); severity levels of alcohol addiction, classified in four categories: (0-7/no dependence); (8-15/light dependence); (16-19/mod-erate dependence, and (20-40/severe dependence) according the Alcohol Use Disorder Identification Test (AUDIT) scores13, and physical activity pattern (PAP), defined
accord-ing the median number of units of metabolic waste (Mets* min*week-1) and daily mean of sitting time tertiles (min/
day) according the International Physical Activity Questionnaire (IPAQ), short version14.
Health-related variables
Diabetes mellitus, defined according to previous history of the condition diagnosed by a physician and also oral glu-cose tolerance test (OGTT), performed after 12-hour fasting and two hours after an overload of 75 grams of glucose. Glycemia (mg/dL) was measured in capillary blood by means of the reflectance colorimetry method, using the portable Accutrend device (Roche Diagnostics GmbH, Mannheim, Germany), taking the cutoff recommended by WHO15; hypertension, defined according to previous history
of the condition diagnosed by a physician, regular use of anti-hypertensive medication or the mean of three consec-utive arterial blood pressure measurements. Individuals were considered to be hypertensive if they presented measure-ments$140 x 90 mmHg for systolic and diastolic pressure, respectively16; ischemic heart disease (IHD), defined by the
combination of angina and possible myocardial infarction, applying the Rose Questionnaire (Q-Rose)17; nutritional
sta-tus, classified in three categories according to the body mass index (BMI) cutoff(s): eutrophic (BMI: 18.5-24.9); overweight (BMI: 25.0-29.9), and obesity (BMI: $ 30) as recommended by WHO18; and plasma fibrinogen and total cholesterol
nervous system (CNS) medications (antidepressants, anxio-lytics, anticonvulsants, antipsychotics, hypnotics and opiates) taken over the 15-day period preceding the inter-views were informed by the study participants and also checked by the interviewers based on prescriptions and/or drug-packs. The group classification of CNS medications was based on the Dictionary of Pharmaceutical Specialties (2013), and the variable was classified in two categories (yes or no). Self-reported health status was classified in three categories: “same”, “worse” and “better”, compared with friends at similar age.
Data processing
Data were collected by face-to-face interviews at the household of eligible individuals, by a team of interviewers who had been trained previously. Before typing data (dou-ble-entry), the quality-control was assessed by replicating 12.5% of the interviews, using Kappa statistics to assess reli-ability. The Kappa coefficient was. 0.80.
Statistical analysis
The specific prevalence of LCP according to gender and age groups were calculated by points and 95% confidence intervals. The prevalence of the outcome was also estimated, according to sociodemographic, behavioral and health-related variables. Poisson regression19was used to estimate
prevalence ratios (PRs). Crude analyses were performed ini-tially, and the variables with p-values # 0.25 for the Wald statistic were selected for inclusion in the multivariate models. Following this, PRs were calculated separately in three models that, respectively, contained sociodemo-graphic, behavioral and health-related variables. After simultaneously adjusted for, the variables that within each of these groups presented p-values,0.05 for Wald statistic were considered independently associated with the out-come. Linear trend tests were run for PRs in variables with more than two categories. All the analyses were run in Stata10. The design effect (deff ) was considered (survey commands family).
Ethical issues
The EPIDCV Project was approved by the Research Ethics Committee of the Ribeirao Preto Nursing School, University of Sao Paulo, under the protocol no. 0725/2006. All the participants signed a free and informed consent statement, in conformity with the recommendations of Resolution no. 196/96 of the National Health Council.
RESULTS
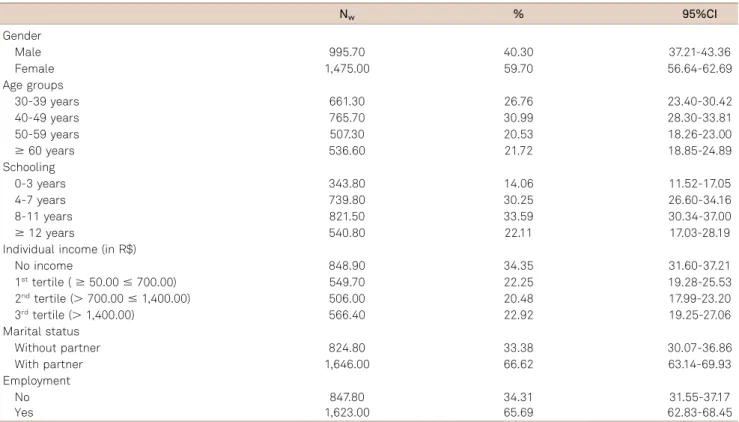
Table 1 presents the sample characteristics, according to sociodemographic variables. Most participants had high
schooling, were inserted in the work market and were living with a partner. Table 2 shows that the prevalence of LCP had a direct relation with age, in both gender, and was of greater magnitude among females. The design effect was 2.53977. In relation to sociodemographic variables (Table 3), it was observed thatschooling presented inverse relation with the outcome, and that the prevalence of LCP reached higher magnitude among individuals without a partner and among those who had no employment. Adjusted PRs depicted pos-itive and independent association with LCP for female gen-der, whereas schooling and employment presented negative associations with the outcome. PRs into categories of schooling showed linear trend (p , 0.01). In relation to behavioral variables (Table 4), higher- magnitude prevalence of LCP was observed among participants with lower meta-bolic waste, those with lower daily mean of sitting time (min/day), those who achieved higher values for AUDIT scores, and those who had been smokers for longer times. In the adjusted model, only daily mean of sitting time PRs showed an independent and negative effect related to the outcome. In relation to health-related variables (Table 5), higher-magnitude prevalence was observed among partici-pants diagnosed as having diabetes, hypertension and ischemic heart disease, and also among those who presented higher levels of fibrinogen and total cholesterol. Participants using CNS medications presented higher prevalence of LCP, in comparison with those who were not making use of this group of medications. The prevalence of LCP into categories ofhealth status compared to friendssuggested linear gradient. Adjusted PRs into this group exhibited a positive and inde-pendent effect related to the outcome for diabetes, fibrino-gen and self-reported health status. PRs into categories of health status presented linear trend (p-value,0.01).
DISCUSSION
The results showed high LCP prevalence, mainly among women, which increased with age, in both gender. Gender, diabetes, fibrinogen and self-reported health status pre-sented positive associations, while schooling, employment and sitting time presented negative associations with the outcome.
The methodological strategies related to sampling, the high response rate (.80%), and the quality control of repli-cated questions (Kappa.0.80) indicate that the findings do not seem resulting from systematic bias.
negative influence on cognitive performance. Higher prevalence of LCP among women was also found by Juncos-Rabadan et al.20, in a cross-sectional study carried out in Galicia (Spain)
among adults$50 years.
The influence of age on the prevalence of LCP was evid-ent in the descriptive phase although the association with the outcome have lost statistical significance in multivari-ate models, mainly after simultaneous adjustment for schooling. Schooling has consistently been described in the literature as strongly associated with cognitive per-formance3,4,5,20, and these findings were confirmed in the
present study. The inverse relationship between edu-cational level and cognitive performance may have resulted from the greater exposure among individuals of lower edu-cational level to environmental factors with adverse effects on the central nervous system, such as poor nutrition, low
neuropsychomotor stimulation, and greater exposure to precarious living conditions, particularly during the early years of life, reflected in adulthood as LCP21. Moreover, it
is reasonable to suppose that the strongest relationship of schooling with LCP in modeling process could have wea-kened potential associations of other sociodemographic variables.
In a cross-sectional study using multilevel approach, car-ried out among communities of elderly people living in Singapore, Wee et al.22 found that sociodemographic
vari-ables, considered at the individual level (age, gender, edu-cational level and participation in the labor market) or at the ecological level (variables related to poverty degrees) pre-sented significant associations with cognitive performance assessed by MMSE. The effect of participation in the labor market on elderly people’s cognitive performance, as
Table 1.Demographic characteristics of the study sample. Ribeirao Preto, SP, Brazil, 2007. EPIDCV Project.
Nw % 95%CI
Gender
Male 995.70 40.30 37.21-43.36
Female 1,475.00 59.70 56.64-62.69
Age groups
30-39 years 661.30 26.76 23.40-30.42
40-49 years 765.70 30.99 28.30-33.81
50-59 years 507.30 20.53 18.26-23.00
$60 years 536.60 21.72 18.85-24.89
Schooling
0-3 years 343.80 14.06 11.52-17.05
4-7 years 739.80 30.25 26.60-34.16
8-11 years 821.50 33.59 30.34-37.00
$12 years 540.80 22.11 17.03-28.19
Individual income (in R$)
No income 848.90 34.35 31.60-37.21
1sttertile (
$50.00#700.00) 549.70 22.25 19.28-25.53
2ndtertile (.700.00#1,400.00) 506.00 20.48 17.99-23.20
3rdtertile (
.1,400.00) 566.40 22.92 19.25-27.06
Marital status
Without partner 824.80 33.38 30.07-36.86
With partner 1,646.00 66.62 63.14-69.93
Employment
No 847.80 34.31 31.55-37.17
Yes 1,623.00 65.69 62.83-68.45
Table 2.Cognitive performance prevalence according age and gender. Ribeirao Preto-SP, Brazil, 2007. EPIDCV Project.
Age groups Male (nw= 995.7)* Female (nw= 1,475.0)*
.25% [95%CI] #25% [95%CI] .25% [95%CI] #25% [95%CI]
30-39 years 79.85 [72.73-85.48] 20.15 [14.52-27.27] 72.43 [61.44-81.24] 27.57 [18.76-38.56] 40-49 years 76.13 [67.03-83.34] 23.87 [16.66-32.97] 68.17 [58.74-76.31] 31.83 [23.69-41.26] 50-59 years 73.34 [62.14-82.18] 26.66 [17.82-37.86] 64.49 [54.79-73.12] 35.51 [26.88-45.21]
$60 years 62.93 [50.51-73.85] 37.07 [26.15-49.49] 47.30 [37.39-57.42] 52.70 [42.58-62.61] Total 74.27 [69.07-78.87] 25.73 [21.13-30.93] 63.47 [57.94-68.66] 36.53 [31.34-42.06]
reported by Wee et al.22, was also depicted in the present
study, even after adjustment for schooling, thus indicating the strength of this association with regard to adults aged 30 years or over.
In relation to behavioral factors, participants who were classified in the last two tertiles of sitting time presented pre-valence ratios ,1 (protective effect), compared to those at the first tertile. Notwithstanding the benefits of physical exercise for cardiovascular conditioning, thereby favoring
cerebral metabolic activity and improving physical and men-tal health23, it is plausible to suppose that participants
clas-sified in the higher levels of sitting time may have been engaged in intellectual activities and, in this case, the sed-entary lifestyle, expressed through greater sitting time would be an indicator, albeit indirectly, of higher educational level. Higher prevalence of LCP were detected among partici-pants classified as having moderate or severe dependence on alcohol, and among those who had been smokers for longer
Table 3.Outcome prevalence, and crude and adjusted prevalence ratios, according sociodemographic variables. Ribeirao Preto, SP, Brazil, 2007. EPIDCV Project.
LCP prevalence [95%CI] Crude PR [95%CI] Adjusted PR [95%CI]
Gender
Male 25.73 [21.13-30.93] 1 1
Female 36.53 [31.34-42.06] 1.42 [1.16-1.72] 1.25 [1.04-1.50]
Age groups
30-39 years 23.80 [18.38-30.23] 1 1
40-49 years 28.97 [22.84-35.98] 1.21 [0.92-1.60] 1.04 [0.80-1.34] 50-59 years 32.25 [25.47-39.86] 1.35 [1.01-1.81] 0.99 [0.74-1.32]
$60 years 47.05 [38.50-55.78] 1.97 [1.47-2.65] 1.09 [0.83-1.45] Schooling
0-3 years 69.87 [61.20-77.32] 1 1†
4-7 years 39.82 [33.92-46.03] 0.56 [0.47-0.68] 0.60 [0.49-0.73]
8-11 years 20.24 [16.01-25.25] 0.28 [0.22-0.36] 0.32 [0.25-0.41]
$12 years 13.71 [10.07-18.40] 0.19 [0.14-0.27] 0.22 [0.15-0.31]
Marital status
Without partner 36.08 [30.77-41.76] 1 1
With partner 30.26 [25.44-35.57] 0.83 [0.69-1.01] 0.98 [0.83-1.15] Employment
No 45.62 [38.92-52.49] 1 1
Yes 25.27 [21.23-29.78] 0.55 [0.46-0.65] 0.82 [0.70-0.96] LCP: Low cognitive performance; PR: Prevalence ratios; CI: Confidence interval;†p-value
,0.01 for linear trend test; p-value,0.05 for PRs are shown in bold.
Table 4.Outcome prevalence and crude and adjusted prevalence ratios, according behavioral variables. Ribeirao Preto, SP, Brazil, 2007. EPIDCV Project.
LCP prevalence [95%CI] Crude PR [95%CI] Adjusted PR [95%CI]
Metabolic waste (mets*min*week-1)
#346.50 33.53 [28.12-39.42] 1 1
.346.50 30.85 [26.22-35.89] 0.91 [0.76-1.10] 0.89 [0.75-1.07] Sitting time (min/day)
1sttertile (
#180) 38.20 [32.10-44.69] 1 1
2ndtertile (.180#308.61) 28.42 [22.70-34.93] 0.74 [0.60-0.91] 0.73 [0.59-0.89]
3rdtertile (
.380.61) 29.34 [24.48-34.72] 0.76 [0.62-0.93] 0.75 [0.61-0.91]
AUDIT (scores)
No dependence (0-7) 32.72 [28.26-37.51] 1 1
Light dependence (8-15) 26.30 [19.39-34.60] 0.80 [0.60-1.06] 0.80 [0.60-1.07] Moderate dependence (16-19) 38.35 [23.23-56.11] 1.17 [0.73-1.87] 1.20 [0.74-1.95] Severe dependence (20-40) 47.33 [29.63-65.73] 1.44 [0.99-2.10] 1.42 [0.97-2.08] Years of smoking
No smoking 31.45 [26.75-36.56] 1 1
1sttertile (1-13) 35.98 [28.73-43.93] 1.14 [0.90-1.44] 1.14 [0.90-1.44]
2ndtertile (14-25) 25.12 [18.66-32.91] 0.79 [0.60-1.04] 0.77 [0.57-1.02]
3rdtertile (
.25) 39.23 [30.28-48.98] 1.24 [0.96-1.60] 1.25 [0.96-1.63]
times (descriptive phase), but these variables did not present significant associations with the outcome in the analytical phase and were therefore excluded from the multivariate models. In a cohort of young elderly people (60-64 years of age), Park et al.24observed that the deleterious effect of
smok-ing (direct and dose-response) on cognitive decline was greater among women, while the effect of alcohol was evident among men. However, as shown by Swan et al.25in a recent
review, smoking increases oxidative stress and inflammation, thereby contributing towards atherosclerosis, vascular dementia and cognitive decline. On the other hand, it needs to be taken into consideration that possible recall bias related to years of smoking and to the questions included in AUDIT might have led to misclassification bias in these exposures, thus masking the expected results.
In the present study, the multivariate analyses were not stratified by gender, given that the dilution of the sample fol-lowing stratification led to unstable estimates and loss of statistical power. Moreover, interaction tests between gender and other study variables, in relation to the outcome, did not present statistical significance (p.0.05).
With regard to health-related variables, diabetes, fibrino-gen and self-reported health (compared to friends) remained associated with the outcome. According to Almeida-Pititto
et al.26, LCP may occur among diabetics due to vascular
complications, presence of neurofibrillary plaque in the CNS and changes in glucose metabolism. Lobnig et al.27
found that mild CNS atrophy was present in diabetics who had the disease for more than 10 years. The authors suggested that hypoglycemia or hyperglycemia, as well as micro and macrovascular complications, occurring alongside hormonal changes, might explain this finding. Regarding fibrinogen, its main function relates to blood coagulation. Excess of fibrino-gen in the intimal layer of the cerebral vessels may lead to thickening and subsequent accumulation of atherosclerotic plaque, and, consequently, impairment of different domains of cognition28
. In relation to self-reported health status, the results from multivariate analyses in the present study indi-cated that there was an independent association with the out-come and a significant linear trend for prevalence ratios (p,
0.01). It is important to mention the plausibility of this asso-ciation, bearing in mind that because self-reported health is a proxy for comorbidities, its association with the outcome may have resulted from the effect of underlying chronic events.
It needs to be emphasized at this point that cross-sec-tional studies are susceptible to reverse causality bias result-ing from simultaneous assessment of the exposures and the
Table 5.Outcome prevalence and crude and adjusted prevalence ratios, according health-related variables. Ribeirao Preto, SP, Brazil, 2007. EPIDCV Project.
LCP prevalence [95%CI] Crude PR [95%CI] Adjusted PR [95%CI]
Diabetes
No 29.27 [24.80-34.18] 1 1
Yes 42.39 [34.55-50.64] 1.44 [1.17-1.79] 1.34 [1.07-1.67]
Hipertension
No 30.12 [25.55-35.12] 1 1
Yes 35.32 [29.60-41.50] 1.17 [0.97-1.40] 1.15 [0.93-1.41] Ischemic heart disease
No 31.08 [26.67-35.87] 1 1
Yes 40.08 [31.35-49.50] 1.28 [1.01-1.65] 1.10 [0.86-1.41] Nutritional status (in kg/m2)
Eutrophic (18.5-24.9) 33.51 [27.46-40.16] 1 1
Overweight (25.0-29.9) 30.57 [25.56-36.09] 0.91 [0.73-1.12] 0.83 [0.67-1.04] Obesity ($30) 32.64 [27.03-38.80] 0.97 [0.78-1.20] 0.81 [0.64-1.03] Fibrinogen (in mg/dL)
1sttertile (#311.3) 28.23 [22.68-34.53] 1 1
2ndtertile (
.311.3#345.3) 29.31 [23.37-36.04] 1.03 [0.80-1.33] 1.08 [0.83-1.40]
3rdtertile (
.345.3) 39.44 [33.77-45.41] 1.39 [1.10-1.76] 1.27 [1.00-1.67]
Cholesterolemia (in mg/dL)
,200 29.93 [25.55-34.72] 1 1
$200 35.09 [29.60-41.01] 1.17 [1.00-1.37] 1.07 [0.89-1.28] CNS medications
No 30.92 [26.77-35.40] 1 1
Yes 40.13 [30.96-50.06] 1.29 [1.03-1.63] 1.14 [0.86-1.50] Self reported health status
Same (compared to friends) 26.98 [22.32-32.21] 1 1†
Worse (compared to friends) 34.54 [29.01-40.53] 1.28 [1.04-1.57] 1.25 [1.01-1.54]
Better (compared to friends) 47.32 [37.13-57.74] 1.75 [1.37-2.23] 1.68 [1.29-2.19] LCP: Low cognitive performance; CNS: Central nervous system; PR: Prevalence ratios; CI: Confidence interval;†p-values
outcome. Nonetheless, the associations found in this study do not seem to be resulting from such bias. Another import-ant limitation was the impossibility of evaluating cognitive decline, given the lack of follow-up in studies with this design. Information based on specific questionnaires to evaluate depression or anxiety, well known as related to LCP, was not available in the EPIDCV Project. However, in spite of this limitation it might be plausible to suppose that those conditions were considered, even indirectly, by mean of data related to CNS medications which included antide-pressants, anxiolytics, anticonvulsants, antipsychotics, hyp-notics and opiates. With regard to the last, the present study confirmed the findings reported by Rollin et al.29 in
the Health Aging and Body Composition Study cohort (Health ABC), in which no association between LCP and CNS medications was found (adjusted hazard ratio = 1.11; 95%CI: 0.73-1.69). On the other hand, the effect of hyperten-sion on cognitive decline, which could be observed in cohort studies16, was not confirmed in the present study, even so
associations between LCP and hypertension or coronary heart disease would be expected. Although higher preval-ence of LCP in hypertensive individuals and in those with ischemic heart disease has been found, these variables did not remain in the multivariate models. By the way, contra-dictory results regarding associations between LCP and
cardiovascular diseases were recognized by Juncos-Rabadan20in cross-sectional studies, and, in a recent cohort,
O’Donnell et al.30also did not find any association between
LCP and myocardial infarction, although significant associa-tions remained between LCP and stroke.
Most studies carried out in Brazil to investigate LCP pre-valence and associated factors included only patients or eld-erly people, so that direct comparisons of its results with those provided by general population-based designs might be restrictive. Nonetheless those limitations, the present study depicted high LCP prevalence even in those aged under the sixties, suggesting that health promotion and dis-ease prevention should begin in younger.
Ongoing studies within the EPIDCV Project based on multilevel structural equations models will certainly contrib-ute towards better understanding of potential direct, indirect and reciprocal effects between those exposures and cognit-ive performance.
Despite the limitations, the results based on the present study made it possible to identify the effects of sociodemo-graphic, behavioral and health-related factors on LCP, thus indicating the need for action towards modifiable exposures for which interventions could mitigate the cognitive impair-ment in a population that is already clearly undergoing to an accelerated process of relative aging.
References
1. Omran AR. The epidemiologic transition in the Americas. PAHO, Washington: The University of Maryland; 1996.
2. Santos CCC, Pedrosa R, Costa FA, Mendonça KMPP, Holanda GM. Análise da função cognitiva e capacidade funcional em idosos hipertensos. Rev Bras Geriatr Gerontol. 2011;14:241-50.
3. Machado JC, Ribeiro RCL, Cotta RMM, Leal PFG. Declínio cognitivo de idosos e sua associação com fatores epidemiológicos em Viçosa, Minas Gerais. Rev Bras Geriatr Gerontol. 2011;14:109-21.
4. Valle EA, Castro-Costa E, Firmo JOA, Uchoa E, Lima-Costa MF. Estudo de base populacional dos fatores associados ao desempenho no Mini Exame do Estado Mental entre idosos: Projeto Bambuí. Cad Saúde Pública. 2009;25:918-26.
5. Bertolluci PHF, Brucki SMD, Campacci SR, Juliano Y. O Mini-Exame do Estado Mental em uma população geral. Impacto da escolaridade. Arq Neuropsiquiatr. 1994;52:1-7.
6. Nooyens ACJ, Gelder BMV, Verschuren WM. Smoking and cognitive decline among middle-aged men and women: The Doetinchem Cohort Study. Am J Public Health. 2008;98:2244-50.
7. Lobo E, Dufouil C, Marcos G et al. Is there an association between low-to-moderate alcohol consumption and risk of cognitive decline? Am J Epidemiol. 2010;172:708-16.
8. Knopman D, Boland LL, Mosley T et al. Cardiovascular risk factors and cognitive decline in middle-aged adults. Neurology. 2001;56:42-8.
9. Vicario A, Sueldo MD, Fernández RA, Enders J, Zilberman J, Cerezo GH. Cognition and vascular risk factors: an epidemiological study. Int J Hypertens. 2012;2012:783696.
10. Silva NN. Amostragem probabilística: um curso introdutório. 2a ed. São Paulo: Editora da Universidade de São Paulo; 2001.
11. Moraes SA, Freitas ICM. Doença isquêmica do coração e fatores associados em adultos de Ribeirão Preto, SP. Rev Saúde Pública. 2012;46:591-601.
12. Folstein MF, Folstein SE, McHugh PR. Mini-Mental State: a practical method for grading the cognitive state of patients for the clinician. J Psychiatr Res. 1975;12:189-98.
13. Lima CT, Freire ACC, Silva APB, Teixeira RM, Farrel M, Prince M. Concurrent and construct validity of the AUDIT in an urban Brazilian sample. Alcohol & Alcohol. 2005;40:584-9.
14. Matsudo S, Araujo T, Matsudo V. Questionário Internacional de Atividade Física (IPAQ): estudo de validade e reprodutibilidade no Brasil. Rev Bras Ativ Fis Saúde. 2001;6:5-18.
15. World Health Organization. Report of a WHO Consultation.Definition, diagnosis and classification of diabetes mellitus and its complica-tions. Part 1: diagnosis and classification of diabetes mellitus. Geneva: World Health Organization; 1999. (WHO/NCD/NCS/99.2).
16. Moraes SA, Szklo M, Knopman D, Sato R. The relationship between temporal changes in blood pressure and changes in cognitive function: Atherosclerosis Risk in Communities (ARIC) Study. Prev Med. 2002;35:258-63.
17. Rose GA. The diagnosis of ischaemic heart pain and intermittent claudication in field surveys. Bull. World Health Organ. 1962;27:645-58.
19. Barros AJ, Hirakata VN. Alternatives for logistic regression in cross-sectional studies: An empirical comparison of models that directly estimate the prevalence ratio. BMC Med Res Methodol. 2003;3:21.
20. Juncos-Rabadan O, Pereiro AX, Facal D, et al. Prevalence and correlates of cognitive impairment in adults with subjective memory complaints in primary care centres. Dement Geriatr Cogn Disord. 2012;33:226-32.
21. Ardila A, Ostrosky-Solis F, Rosselli M, Gómez C. Age-related cognitive decline during normal aging: the complex effect of education. Arch Clin Neuropsychol. 2000;15:495-513.
22. Wee LE, Yeo WX, Yang GR, et al. Individual and area level socioeconomic status and its association with cognitive function and cognitive impairment (Low MMSE) among community-dwelling elderly in Singapore. Dement Geriatr Cogn Disord Extra. 2012;2:529-42.
23. Dustman RE, Ruhling RO, Russell EM, et al. Aerobic exercise training and improved neuropsychological function of older individuals. Neurobiol Aging. 1984;5:35-42.
24. Park B, Park J, Jun JK, Chol KS, Suh M. Gender differences in the association of smoking and drinking with the development of cognitive impairment. PLoS ONE. 2013;8:75095.
25. Swan GE, Lessov-Schlaggar CN. The effects of tobacco smoke and nicotine on cognition and the brain. Neuropsychol Rev. 2007;17:259-73.
26. Almeida-Pititto B, Filho CMA, Cendoroglo MS. Déficit cognitivo: mais uma complicação do diabetes melito? Arq Bras Endocrinol Metab. 2008;52:1076-83.
27. Lobnig BM, Kromeke O, Optenhostert-Porst C, Wolf OT. Hippocampal volume and cognitive performance in longstanding type 1 diabetic patients without macrovascular complications. Diabet Med. 2006;23:32-9.
28. Fukujima MM, Martinez TLR, Pinto LESA, Auriemo CRC, Andrade LAF. Fibrinogênio como fator de risco independente de doença vascular cerebral. Arq Neuropsiquiatr. 1997;5:737-40.
29. Wright RM, Roumani YF, Boudreau R, et al. Effect of central nervous system medication use on decline in cognition in community-dwelling older adults: findings from the health, aging and body composition study. J Am Geriatr Soc. 2009;57:243-50.