AR
TIGO ORIGINAL / ORIGINAL AR
TICLE
VISCOSITIES REPRODUCTIVE PATTERNS
FOR USE IN VIDEOFLUOROSCOPY
AND REHABILITATION THERAPY OF
DYSPHAGIC PATIENTS
Milton M. B.
COSTA
1, Juliana T. de
ALMEIDA
1, Eliane
SANT’ANNA
1and Gláucia M.
PINHEIRO
2ABSTRACT – Background - Usually the suitable consistence identified and indicated as safe by videofluoroscopic method has been empirically
obtained by association of barium sulfate solution with meals. However, it has been evidenced to be very difficult to reproduce this consistence in nutritional rehabilitation therapy from subjective information. Aim - To build two reproductive similar crescent viscosities series of solutions, with and without barium sulfate, to be used, the first, as radiological contrasted mean and the second, as base to reproduce the defined safer consistence, in the oral diet rehabilitation of dysphagic patients. Methods - Two viscosity solutions series were obtained from starch and distilled water with and without 100% barium sulfate solution. The viscosity levels were defined step by step with digital viscosimeter (Brookfield, model LVTD-II) and with infrared thermometer Icel TD - 960. The fluids viscosity was register in centipoises, with their inferior and superior values followed by complimentary information about spindle kind, rotation speed and temperature. Results - The two series of solutions, with and without barium sulfate, could be defined as aqueous (>1-143,5 cP), fine liquid (428 - 551 cP), thick liquid (4.284 -7.346,5 cP)), pasty (7.346,4 - 13.035 cP), pasty thick (19.260 - 34.320 cP) and creamy (163.500 - 255.300 cP). Conclusion - The study could offer reproductive formulas, with and without contrast mean, to be follow for obtaining the desirable viscosity to be used, each of them, in radiological evaluation and in nutritional diet minimizing the gaps fails between evaluation and therapy.
HEADINGS – Deglutition disorders. Fluoroscopy. Contrast media. Viscosity
1Digestive Motility Laboratory of the Biomedical Science Institute of the Federal University of Rio de Janeiro; 2Quality Control Laboratory of Universitary Pharmacy of the
Federal University of Rio de Janeiro, RJ, Brazil
Correspondence: Dr. Milton M. B. Costa - Laboratório de Motilidade Digestiva e Imagem, Universidade Federal do Rio de Janeiro ICB/CCS/UFRJ – 21941-590 – Rio de Janeiro, RJ, Brazil. E-mail: [email protected]
INTRODUCTION
In rehabilitation therapy of patients with oropharyngeal dysphagia, the aim is to recover the oral phase functionality. Besides several different rehabilitation swallowing techniques and therapeutic maneuvers, the identification of safer food viscosities are also important for each case(18).
An appropriate diet will allow dysphagic patients to eat safely and to progress to a wider variety of foods as their swallowing function improves.
Without an appropriate food viscosity scale, variable consistencies that represent empirical viscosity levels have been applied in order to transfer oral bolus in a safe pharyngeal transit. Usually the literature, incorrectly, considers consistency as viscosity for the analysis of oral and pharyngeal activity(11, 13, 29).
Difficulty in liquid ingestion is a major feature in a great number of patients with dysphagia(29). A barium swallow is
usually applied to analyze the oropharyngeal dysfunction and to determine the appropriate technique for each patient(14, 23). It is also important to determine the safe viscosity to be
used. Patients intuitively adapt their diet by selecting pasty consistency(22) in order to overcome their ingestion difficult.
Videofluoroscopy is considered the gold standard method for swallow examination(7, 9, 14, 15, 16, 21, 33). The videofluoroscopy
method can infer the more effective swallowing techniques, different head-positioning maneuvers, swallow quality and bolus viscosity interference.
Although it is well know that it is important to work with viscosity, rather than consistency, for radiological systematic studies, for pharyngeal and esophageal motility and clinical analysis of motility disorders(20) there are
very few reports in literature concerning the effects of the bolus viscosity on swallow function. Swallow ability is usually evaluated with barium solution in percentage weight/volume (3, 4) or mixing solid, liquid, pasty, purée or
yogurt consistency with barium sulfate solution(8, 11, 21).
Once the possibilities and appropriate food characteristics for the patient have been defined, consistency reproducibility is attempted. However, to reproduce a similar consistency using a food thickener based on the conception of an empiric consistency level has not been easy and usually different consistencies result from the same caregivers, as already reported(5, 6, 18). Transferring
The viscosity value, expressed in centipoises (cP) or millipascal per second (mPa/s), defines the fluid resistance against an applied force(24, 29, 30). This rheological characteristic can be reproduced
following defined prescriptions.
Food viscosity interferes with the oral ejection level force(19, 25, 29), with the intra-bolus pressure(13, 25, 28) and with the pharyngeal
transport(11, 12, 13, 28, 29). Thus, to establish the volume and viscosity
value suitable for a dysphagic patient would permit quantification of their real swallow tolerance.
The swallow tolerance and suitable viscosity can be determined by videofluoroscopy using contrast material with defined viscosity. In this way, a defined and safe diet can be reproduced for dysphagic patients, using as a base, the same viscosity solution without barium sulfate.
This work was undertaken to build two series of solutions, with defined viscosities, obtained from comparison to those empirically used. These two sequences of solutions, with and without barium sulfate can be used in a radiological exam and as a base to prepare safe consistency in the oral rehabilitation diet of dysphagic patients, respectively. Besides the previously mentioned advantages, defining the standard viscosity allows a more accurate follow up with reproductive methodology for research applications.
METHODS
Fluid viscosity, in cP, was measured with a digital viscosimeter (Brookfield, model LVTD-II). The solution deformation degree was determined during rotation of a variable dimension spindle with transverse stems varying from the larger (A), to the smaller (F) dimension.
The viscosity values were obtained with the viscosimeter fixed on a helipath stand that allowed vertical movement of the spindle inside the fluid and the determination of both upper and lower viscosity values. The standard spindle for each solution was the one with a higher transverse stem to allow viscosity records at higher rotation speeds. The valid viscosity value for each solution was defined using the maximum rotation speed of the selected spindle.
Five minutes after the preparation of the solution the viscosities were monitored for a further 5 minutes and the maximum and minimum values were registered. The solution temperatures ranged from 20°C to 25°C. These values were registered, during the reading, with an infrared thermometer Icel TD-960.
As viscosity references, simple syrup(6), natural honey, petit
Suisse yogurt were measured. Also viscosity measurements were taken of instant food thickeners, whose consistencies are commercially defined by the manufacturer as nectar-thick (syrup), honey-thick and spoon-thick (pudding). A hundred percent commercial barium sulfate solution and also 50%, 25% and 12.5% concentrations had their viscosity values measured.
Filtered and distilled water were used as solvents. However, distilled water was chosen as the dilutor for the solutions to be analyzed. Starch was the solute used as a food thickener.
Barium sulfate solutions with viscosities of 12.5%, 25% and 50% were prepared mixing distilled water with 100% barium sulfate solution.
From reference viscosity values similar viscosity solutions, with and without barium sulfate, were prepared. All of them were prepared with a volume of 300 mL.
Solutions without barium sulfate were prepared by mixing distilled water with food thickener (starch). The barium sulfate solutions were obtained by mixing starch and 50% barium sulfate solution. They were prepared in series varying the starch concentration step by step to identify the comparable viscosity level with the viscosity reference base. All the prepared solutions with viscosities very similar to the viscosity reference base were made up and tested at least twice.
As a complementary observation to the contrast series, color pigment was added (1.5 mL of aniline - 30 drops) and their viscosity values were measured.
RESULTS
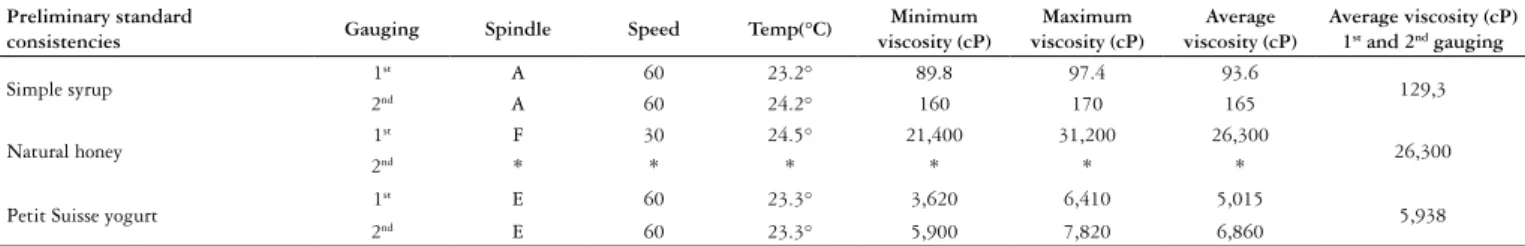
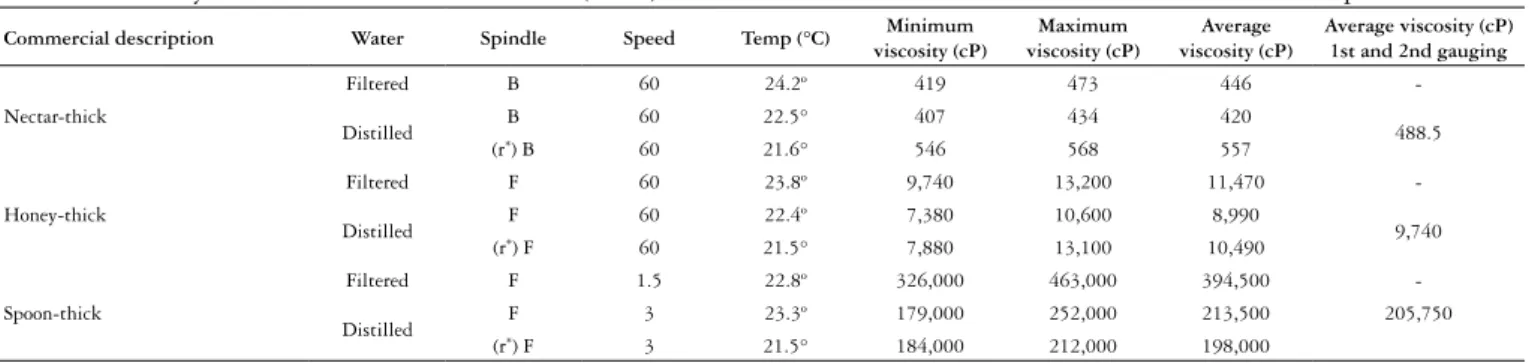
Standard viscosity values were determined from the simple syrup, natural honey and petit Suisse yogurt (Table 1) and also from the viscosity value of the instant food thickener mixed with filtered and also with distilled water in three consistencies defined by the manufacturer as nectar-thick (syrup), honey-thick and spoon-thick (pudding) (Table 2). These results show that filtered water can seriously interfere in the viscosity value. Consequently, only distilled water was used as diluents in the solutions to be analyzed.
The food thickener of commercial consistency mixed with distilled water was reevaluated after 24 hours (Table 3) and showed expressive nectar-thick variation in the minimum, maximum and medium viscosities measured in cP.
The viscosity values of barium sulfate solution (100%) and in 50%, 25% and 12.5% concentrations were measured. The 12.5% viscosity value was below the lower limit of the viscosimeter used (Table 4).
TABLE 1. Minimum, maximum and average viscosity values obtained from the preliminary standard consistency analysis
Preliminary standard
consistencies Gauging Spindle Speed Temp(°C)
Minimum viscosity (cP)
Maximum viscosity (cP)
Average viscosity (cP)
Average viscosity (cP) 1st and 2nd gauging
Simple syrup 1
st A 60 23.2° 89.8 97.4 93.6
129,3
2nd A 60 24.2° 160 170 165
Natural honey 1
st F 30 24.5° 21,400 31,200 26,300
26,300
2nd * * * * * *
Petit Suisse yogurt 1
st E 60 23.3° 3,620 6,410 5,015
5,938
2nd E 60 23.3° 5,900 7,820 6,860
cP - centipoises, T ºC - temperature of the solution in Celsius degrees. Conditions used to obtain viscosity values of the substances used as preliminary standard consistencies and their minimum, maximum and the mean values, in centi-poises
The consistencies used as the viscosity reference base were arranged and named in six crescent levels by their subjective fluidity, where standard viscosity limits and characteristics were determined for each of them. The values of the six defined standard levels and limits were aqueous (>1cP lower and 147cP upper), fine liquid (428 cP lower and 551 cP upper), thick liquid (4,284 cP lower and 7,346.5 cP upper), pasty (7,346.5 cP lower and 13,035 cP upper), thick pasty (19,260 cP lower and 34,320 cP upper) and cream (163,500 cP lower and 255,300 cP upper). The numeric limits of the viscosity levels series were defined decreasing 10% of the minimum viscosity obtained in each level, except for the aqueous where the lower limit was considered
greater than 1 and adding 10% to maximum viscosity of each level. The upper limit of the thick liquid and lower limit of pasty were obtained by average of the found viscosity values (7,826 cP upper and 6,867 cP lower = 7,346.5 cP) (Table 5).
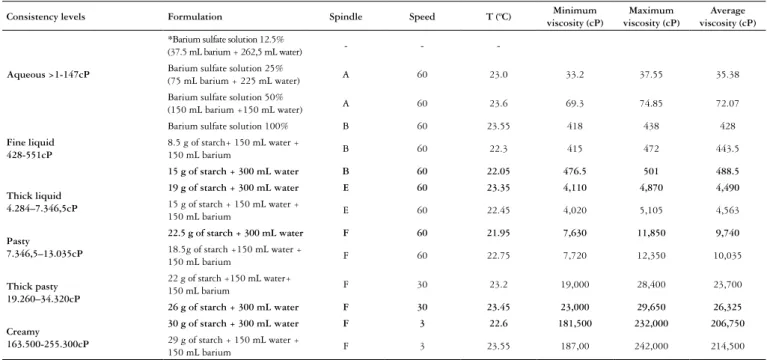
From the standard levels defined in Table 5 as reference, a sequence with barium sulfate solution (50%) and starch could be identified, highlighted in Table 6. The same five consistencies obtained with barium sulfate solutions were also made up with only starch. In this way several concentrations with and without barium sulfate could be arranged in the same table (Table 7). As the main result a table showing the desirable standard consistencies with the formulas to obtain the average
TABLE 2. Viscosity values of the instant food thickener (starch) mixed with distilled and filtered water in three commercial descriptions
Commercial description Water Spindle Speed Temp (°C) Minimum
viscosity (cP)
Maximum viscosity (cP)
Average viscosity (cP)
Average viscosity (cP) 1st and 2nd gauging
Nectar-thick
Filtered B 60 24.2º 419 473 446
-Distilled B 60 22.5° 407 434 420 488.5
(r*) B 60 21.6° 546 568 557
Honey-thick
Filtered F 60 23.8º 9,740 13,200 11,470
-Distilled F 60 22.4º 7,380 10,600 8,990 9,740
(r*) F 60 21.5° 7,880 13,100 10,490
Spoon-thick
Filtered F 1.5 22.8º 326,000 463,000 394,500
-Distilled F 3 23.3º 179,000 252,000 213,500 205,750
(r*) F 3 21.5° 184,000 212,000 198,000
(r*) – 2nd gauging - Analysis of the influence of solvent on the viscosity values of recently prepared commercial solutions of starch. The filtered lines show viscosity values increase out of control probably due to solutes naturally present in the filtered water
TABLE 3. Influence of time after preparation on the viscosity values of commercial solutions of starch (24h)
Commercial consistencies Water Spindle Speed Temp (°C) Minimum
viscosity (cP)
Maximum viscosity (cP)
Average viscosity (cP)
Nectar-thick Distilled C 60 20.9° 1,230 1,370 1,300
Honey-thick Distilled F 60 23.4º 7,600 11,000 9,300
Spoon-thick Distilled F 3 23.2º 182,000 244,000 213,000
Commercial consistencies defined as nectar-thick, honey-thick and spoon-thick (pudding), 24 hours after preparation, the variations of the values of minimum viscosity, maximum and the average
TABLE 4. Viscosity values of barium sulfate solution in varied concentrations
Barium sulfate solution Gauging Spindle Speed Temp (°C) Minimum
viscosity (cP)
Maximum viscosity (cP)
Average viscosity (cP)
Average viscosity (cP) 1st and 2nd gauging
12.5% * * * *
25% 1ª A 60 24.3° 31.08 35.04 33.06 35.38
2ª A 60 21.7° 35.4 40.1 37.7
50% 1ª A 60 23.7° 66 72 69 72.1
2ª A 60 23.5° 72.6 77.7 75.1
100% 1ª B 60 23.8° 424 438 431 428
2ª B 60 23.3° 412 438 425
Minimum, maximum and average viscosity values found in concentrations of 100%, 50%, 25% and 12.5% of barium sulfate solution. * aqueous - below the equipment limit
TABLE 5. Standard viscosity level classification and limits from subjective classification of consistencies
Standard viscosity level Spindle Speed T (°C) Minimum
viscosity (cP)
Maximum viscosity (cP)
Average
viscosity (cP) Viscosity value limits
Simple syrup (aqueous) A 60 23.2° 125 133.5 129.3 >1cP–147cP
Nectar-thick* (fine liquid) B 60 22° 476.5 501 488.5 428 cP–551cP
Petit Suisse yogurt (thick liquid) E 60 23.3° 4,760 7,115 5,938 4,284 cP–7,346.5 cP
Honey-thick* (pasty) F 60 22° 7,630 11,850 9,740 7,346.5 cP–13,035 cP
Natural honey (thick pasty) F 30 24.5° 21,400 31,200 26,300 19,260 cP–34,320 cP
Spoon-thick* (creamy) F 3 22.6° 181,500 232,000 206,750 163,500 cP–255,300 cP
*Commercial designation
viscosities in cP with def ined spindle size (A, B, E, F), speed rotation (60, 30, 3) and temperature 230C ± 2 for
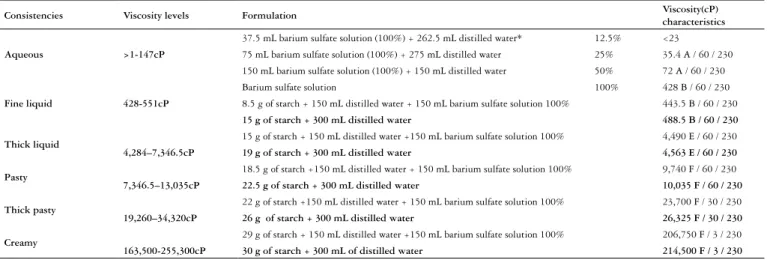
solutions with and without barium sulfate was made up (Table 8).
TABLE 6. Viscosity values of barium sulfate solution (50%) with instant food thickener
Basic solution Starch Spindle Speed T (°C) Minimum
viscosity (cP)
Maximum viscosity (cP)
Average viscosity (cP)
Average viscosity (cP) 1st and 2nd gauging
150 mL of distilled water + 150 mL of barium sulfate solution
8 g B 60 23.4 366 402 384
8.5 g B 60 22.9 411 458 434.5
443.5
(r*) 8.5 g B 60 21.7 419 486 452.5
9 g B 60 25 453 501 477
14 g D 60 23.2 2,440 2,610 2,525
15 g E 60 23.3 4,170 5,180 4,675
4,563
(r*) 15 g E 60 21.6 3,870 5,030 4,450
16 g E 60 23.3 5,980 7,430 6,705
18 g E 60 24.4 6,050 6,860 6,450
18.5 g F 60 23.3 8,180 13,000 10,590
10,035
(r*)18.5 g F 60 22.2 7,260 11,700 9,480
19 g F 60 22.2 12,100 15,300 13,700
21 g F 60 25.6 12,300 15,100 13,700
22 g F 30 24.4 15,800 28,700 22,250
23,700
(r*) 22 g F 30 22 22,200 28,100 25,150
22.5 g F 12 23.8 57,800 74,800 66,300
28.5 g F 3 23.9 145,000 237,000 191,000
29 g F 3 24.5 192,000 242,000 217,000
214,500
(r*) 29 g F 3 22.6 182,000 242,000 212,000
(r*) – 2nd gauging - viscosity values of contrasted solutions with addition of starch. The bold rows are the solutions with viscosity values similar to the preliminary standard consistencies used as reference
TABLE 7. Solutions of viscosity series limits with and without barium sulfate
Consistency levels Formulation Spindle Speed T (ºC) Minimum
viscosity (cP)
Maximum viscosity (cP)
Average viscosity (cP)
Aqueous >1-147cP
*Barium sulfate solution 12.5%
(37.5 mL barium + 262,5 mL water) - -
-Barium sulfate solution 25%
(75 mL barium + 225 mL water) A 60 23.0 33.2 37.55 35.38
Barium sulfate solution 50%
(150 mL barium +150 mL water) A 60 23.6 69.3 74.85 72.07
Fine liquid 428-551cP
Barium sulfate solution 100% B 60 23.55 418 438 428
8.5 g of starch+ 150 mL water +
150 mL barium B 60 22.3 415 472 443.5
15 g of starch + 300 mL water B 60 22.05 476.5 501 488.5
Thick liquid 4.284–7.346,5cP
19 g of starch + 300 mL water E 60 23.35 4,110 4,870 4,490
15 g of starch + 150 mL water +
150 mL barium E 60 22.45 4,020 5,105 4,563
Pasty
7.346,5–13.035cP
22.5 g of starch + 300 mL water F 60 21.95 7,630 11,850 9,740
18.5g of starch +150 mL water +
150 mL barium F 60 22.75 7,720 12,350 10,035
Thick pasty 19.260–34.320cP
22 g of starch +150 mL water+
150 mL barium F 30 23.2 19,000 28,400 23,700
26 g of starch + 300 mL water F 30 23.45 23,000 29,650 26,325
Creamy 163.500-255.300cP
30 g of starch + 300 mL water F 3 22.6 181,500 232,000 206,750
29 g of starch + 150 mL water +
150 mL barium F 3 23.55 187,00 242,000 214,500
*Below the viscosimeter limit
Series containing minimum, maximum and the average viscosity values obtained from mixtures of distilled water and food thickener, with barium sulfate and without highlighted by bold line
DISCUSSION
Oral food ejection and its pharyngeal passage vary, especially with volume and viscosity bolus characteristics. Viscosity intensity will interfere with motor unit activation quantity in the striate muscle of the mouth wall and tongue to obtain the necessary force to transfer the bolus from oral cavity through the pharynx(10, 26, 32).
The viscosity is the rheological fluid characteristic that best defines the resistance against the passage of food, transferred from oral cavity, through the pharynx. According to rheological characteristics, the fluid can be defined as newtonian or non-newtonian. The non-newtonian fluids, as the fluids used in this study, show variable viscosity values depending on conditions such as the size of the spindle traverse stem and its rotation speed(2, 6, 29).
The non-newtonian fluids can be dependent” or “time-independent”(2). The “time-dependent” viscosity fluids vary with
time of preparation. Besides time of preparation, the size of the spindle transverse stems, rotation speed and the environmental temperature are variables to be considered because they too interfere in the viscosity of non-newtonian fluids(1, 2, 28, 29).
For this reason, the viscosity values, especially for the non-newtonian fluids, should be defined with minimum and
TABLE 8. Solutions of viscosity series for easy reprodution obtained by viscosimeter brookfield, model LVTD-II
Consistencies Viscosity levels Formulation Viscosity(cP)
characteristics
Aqueous >1-147cP
37.5 mL barium sulfate solution (100%) + 262.5 mL distilled water* 12.5% <23
75 mL barium sulfate solution (100%) + 275 mL distilled water 25% 35.4 A / 60 / 230
150 mL barium sulfate solution (100%) + 150 mL distilled water 50% 72 A / 60 / 230
Fine liquid 428-551cP
Barium sulfate solution 100% 428 B / 60 / 230
8.5 g of starch + 150 mL distilled water + 150 mL barium sulfate solution 100% 443.5 B / 60 / 230
15 g of starch + 300 mL distilled water 488.5 B / 60 / 230
Thick liquid
4,284–7,346.5cP
15 g of starch + 150 mL distilled water +150 mL barium sulfate solution 100% 4,490 E / 60 / 230
19 g of starch + 300 mL distilled water 4,563 E / 60 / 230
Pasty
7,346.5–13,035cP
18.5 g of starch +150 mL distilled water + 150 mL barium sulfate solution 100% 9,740 F / 60 / 230
22.5 g of starch + 300 mL distilled water 10,035 F / 60 / 230
Thick pasty
19,260–34,320cP
22 g of starch +150 mL distilled water + 150 mL barium sulfate solution 100% 23,700 F / 30 / 230
26 g of starch + 300 mL distilled water 26,325 F / 30 / 230
Creamy
163,500-255,300cP
29 g of starch + 150 mL distilled water +150 mL barium sulfate solution 100% 206,750 F / 3 / 230
30 g of starch + 300 mL of distilled water 214,500 F / 3 / 230
*Below the viscosimeter limit. Series with formulas to obtain the desirable consistencies with average viscosity in cP, spindle size (A, B, E, F), speed rotation (60, 30, 3) and temperature 230C ± 2. Solutions without barium sulfate highlighted by bold line
TABLE 9. Comparison between contrasted solutions with and without aniline addition
Without aniline With aniline
Contrasted solutions* Minimum viscosity (cP) Maximum viscosity (cP) Average viscosity (cP) Minimum viscosity (cP) Maximum viscosity (cP) Average viscosity (cP)
9 g 453 501 477 464 484 474
13 g 1,850 2,170 2,010 1,840 2,050 1,945
14 g 2,440 2,610 2,525 2,240 2,340 2,290
15 g 4,170 5,180 4,675 3,610 4,430 4,020
16 g 5,980 7,430 6,705 4,040 5,130 4,585
19 g 12,100 15,300 13,700 8,900 11,500 10,200
22 g 15,800 28,700 22,250 16,200 23,900 20,050
24 g 100,000 126,000 113,000 74,500 92,500 83,500
29 g 192,000 242,000 217,000 144,000 192,000 168,000
Viscosity values obtained from sequence of contrasted solutions expressed by starch proportion. The bold columns show the average viscosity without and with aniline addition and shows no expressive viscosity differences between the two columns of viscosity levels
maximum viscosity values and not in fixed values. Therefore, each viscosity level must be given with an inferior and superior limit followed by complimentary information about spindle type, rotation speed and temperature. Viscosity values cited without these elements are considered incomplete and not suitable for reproduction.
The kind of water used, distilled or filtered water, produces interference in the viscosity values (Tables 2 and 3). Distilled water is the solvent recommended by Pharmacopoeia(31) for
the preparation of solutions. Non-distilled water contains ionic elements or sludge that can interfere in the viscosity value, in a variable way, hindering its reproducibility.
In agreement with our observations of wide viscosity variability, GARCIA et al.(17) found liquid viscosity variability
for nectar- and honey-like consistencies is highly dependent on the type of thickening product, the time it is allowed to thicken and also within a product line for thickening various liquids.
EasyTM Instant Food Thickener, Hormel Healthlabs and Resource®
Thicken up, Novartis Consumer Health).
The consistencies obtained with food thickeners, are commonly considered as unalterable with time. The “time-dependent” fluid viscosities should vary with time of preparation(2, 17) as was
observed in the viscosity of the nectar consistency obtained with a commercial starch preparation. In this case there was an expressive difference between the viscosities checked in the recently prepared solution and to their value after 24 hours (Tables 2 and 3). However, the consistencies defined as honey and pudding had, after 24 hours, comparable viscosities.
The viscosity values obtained by analysis of nectar-thick (syrup), honey-thick and spoon-thick (pudding) defined by manufacturer (Table 2), was not the same as the standard viscosities obtained from analysis of the simple syrup, natural honey and petit Suisse yogurt (Table 1). Nectar (syrup) and honey consistency obtained with food thickener were placed in different viscosity levels than those obtained from the simple syrup and natural honey viscosity. The spoon-thick (pudding) defined by manufacturer, presents viscosity of cream, the upper level measured by the viscosimeter used (Table 4).
The lower limit of the viscosimeter used is near the viscosity of water (1cP to 20ºC)(28, 29). In aqueous solution, the spindle
(A), the largest one with its slowest rotation speed, presented erratic behavior without defining a viscosity value. This fact was used to define the aqueous level when barium sulfate solution (12.5%) was used. Thus, this discovery will permit speculation concerning water swallowing abilities of a dysphagic patient during videofluoroscopic analysis.
From the lower (aqueous) to upper (cream), limit of the viscosimeter used, several others consistencies were named by their viscosity values. The results expressed in the Tables 4, 5, 6 and 7 were organized in viscosity value levels and generated Table 8. Each named viscosity level, except aqueous, included its formulation of distilled water and starch, with and without barium sulfate. Preparation of all solutions was repeated and submitted to new gauging in order to verify reproducibility. Since the values shown are very similar, Table 7 presents the averages.
Mixtures made up with distilled water, starch and barium sulfate for videofluoroscopic, use a 50% barium sulfate concentration, which is sufficient to obtain a radiological definition and also provide a more tolerable flavor. Another important reason is that starch solutions of lower concentrations are easier to obtain.
Table 8 synthesizes the research objective. It shows six defined consistency levels and establishes their viscosity limits. The two viscosity series, with and without barium sulfate solution are presented with their reproducible formulas followed by viscosity values and the acquired standard defined by its spindle size, velocity and temperature.
The barium sulfate dilution obtained with 12.5% concentration, which is below the viscosimeter limit, points to the possibility of using this concentration to analyze the water swallow characteristics throughout the radiological study.
The viscosity levels obtained from 100% barium sulfate solution and barium mixed with starch allowed the swallowing possibilities from fine liquid to creamy to be defined and to reproduce the adequate viscosity found, without barium sulfate, to use in the nutrition and or training of the dysphagic patients.
Color and flavor are not desirable elements in the contrast materials, but it is possible that children, accept colored and flavored contrast material, during their exams, more easily. For this reason, aniline (1.5 mL) was added in some contrasted solutions to observe possible variations produced by this addition. A discreet viscosity decrease was observed, with maintenance of the consistency level. Two, out of 10 solutions tested, showed more expressive decreases, perhaps, because of the time elapsed between the making and the second measurement that requires solution homogenization (Table 9). In this way, if requested, although not recommended, a lesser volume of aniline can be added without an expressive modification in the viscosity level.
The sequence of consistencies organized in viscosity value levels from aqueous to cream will complement videofluoroscopy studies to identify a suitable consistency for a dysphagic patient. These suitable consistencies with the same viscosity value, without barium sulfate, can be reproduced as models for a nutritional diet.
Usually the suitable consistency identified and indicated as safe by videofluoroscopic method is obtained empirically by the addition of barium sulfate solution to different meals. In this way, to reproduce this safe consistency from analogy with food viscosity conceptions by caregivers often results in a wrong preparation as observed by GLASSBURN and DEEM(18), that breaks the
relationship between the videofluoroscopic evaluation and the recommended diet. This difficulty also pointed by ROBERTSON and PATILLO(27) and CICHERO et al.(6), will be solved by
contrasted material series with defined viscosity levels that can be used in the videofluoroscopic exam to define and indicate the safe consistency. From this, using the same viscosity solution without barium sulfate as base, the caregiver, with side-by-side comparison, can produce a safe diet consistency minimizing the amount of failures between evaluation and therapy.
CONCLUSION
REFERENCES
1. Bourne MC. Food texture and viscosity: concept and measurement. New York: Academic Press; 1982. p.199-246.
2. Brookfield Dial Viscometer – Operating instructions. Manual n. M/85-150-M897. 3. Bülow M, Olsson R, Ekberg O. Videomanometric analysis of supraglottic swallow,
effortful swallow, and chin tuck in healthy volunteers. Dysphagia. 1999;14:67-72. 4. Bülow M, Olsson R, Ekberg O. Videomanometric analysis of supraglottic swallow,
effortful swallow, and chin tuck in patients with pharyngeal dysfunction. Dysphagia. 2001;16:190-5.
5. Cichero JA, Hay G, Murdoch BE, Halley PJ. Videofluoroscopic fluids versus mealtime fluids: differences in viscosity and density made clear. J Med Speech Lang Pathol. 1997;5:203-15.
6. Cichero JA, Jackson O, Halley PJ, Murdoch BE. How thick is thick? Multicenter study of the rheological and material property characteristics of mealtime fluids and videofluoroscopy fluids. Dysphagia. 2000;15:188-200.
7. Cook IJ. Investigative techniques in assessment of oral-pharyngeal dysphagia. Dig Dis. 1998;16:125-33.
8. Costa MM, Da Nova JLL, Carlos MT, Pereira AA, Koch HA. Videofluoroscopia: um novo método. Radiol Bras. 1992;25:11-8.
9. Costa MM, Moscovici M, Pereira AA, Koch HA. Avaliação videofluoroscópica da transição faringoesofágica (esfíncter superior do esôfago). Radiol Bras. 1993;26:71-80.
10. Costa MM. Uso do bolo contrastado sólido, líquido e pastoso no estudo vídeo fluoroscópico da dinâmica da deglutição. Radiol Bras. 1996;29:35-9.
11. Dantas RO, Dodds WJ. Effect of bolus volume and consistency on swallow-induced submental and infrahyoid electromyographic activity. Braz J Med Biol Res. 1990;23:37-44.
12. Dantas RO, Dodds WJ, Massey BT, Kern MK. The effect of high- vs low-density barium preparations on the quantitative features of swallowing. AJR Am J Roentgenol. 1989;153:1191-5.
13. Dantas RO, Kern MK, Massey BT, Dodds WJ, Kahrilas PJ, Brasseur JG, Cook IJ, Lang IM. Effect of swallowed bolus variables on oral and pharyngeal phases of swallowing. Am J Physiol. 1990;258 (5 Pt 1):g675-g81.
14. Ekberg O. The role of radiology in evaluation and treatment of the neurological-impaired patients with dysphagia. J Neurol Rehabil. 1990;4:65-7.
15. Ekberg O, Olsson R. Radiological evaluation of pharynx and larynx during swallowing. Oper Tech Otolaryngol Head Neck Surg. 1997;8:153-62.
16. Ekberg O, Pokieser P. Radiologic evaluation of the dysphagic patients. Eur Radiol. 1997;7:1285-95.
17. Garcia JM, Chambers EIV, Matta Z, Clark M. Viscosity measurements of nectar and honey-thick liquids: product, liquid and time comparisons. Dysphagia. 2005;20:325-35. 18. Glassburn DL, Deem JF. Thickener viscosity in dysphagia management: variability
among speech-language pathologists. Dysphagia. 1988;13:218-22.
19. Lazarus CL, Logemann JA, Rademaker AW, Kahrilas PJ, Pajak T, Lazar R, Halper A. Effects of bolus volume, viscosity and repeated swallows in nonstroke subjects and stroke patients. Arch Phys Med Rehabil. 1993;74:1066-70.
20. Linden P. Videofluoroscopy in the rehabilitation of swallowing dysfunction. Dysphagia. 1989;3:189-91.
21. Li M, Brasseur JG, Kern MK, Dodds WJ Viscosity measurements of barium sulfate mixtures for use in motility studies of the pharynx and esophagus. Dysphagia. 1992;7:17-30.
22. Logemann JA. Evaluation and treatment of swallowing disorders. San Diego, CA: College Hill; c1983.
23. Logemann JA. Manual for the videofluorographic study of swallowing. San Diego, CA: College Hill; c1986.
24. Pardoe EM. Development of a multistage diet for dysphagia. J Am Diet Assoc. 1993;93:568-71.
25. Pouderoux P, Kahrilas PJ. Deglutitive tongue force modulation by volition, volume, and viscosity in humans. Gastroenterology. 1995;108:1418-26.
26. Rhoades R, Pflanzer R. The gastrointestinal system. In: Rhoades R, Pflanzer R, editors. Human physiology. 3rd.ed. New York: Saunders; 1989. p.664-703. 27. Robertson HM, Patillo MS. A strategy for providing food to patients with neurologically
based dysphagia. J Can Dietetics Assoc. 1993; 54:198-201.
28. Smith CH, Logemann JA, Burghardt WR, Carrell TD, Zecker SG. Oral sensory discrimination of fluid viscosity. Dysphagia. 1997;12:68-73.
29. Steele CM, Van Lieshout PH. Influence of bolus consistency on lingual behaviors in sequential swallowing. Dysphagia. 2004;19:192-206.
30. Tung MA, Paulson AT. Rheological concepts for probing ingredient interactions: in food systems. In: Gaonkar AG, editor. Ingredient interactions: effects on food quality. New York: Marcel Dekker; 1995. p.45-84.
31. United States Pharmacopeia. Purified water. 27.ed. Rockville: USP Convention; 2004. 32. Vander AJ, Sherman JH, Luciano DS. Digestion and absorption of food. In: Vander AJ, Sherman JH, Luciano DS. Human physiology; the mechanisms of the body function. 2nd ed. New York: McGraw-Hill; c1975. p.355-90.
33. Yamada EK, Siqueira KO, Xerez D, Koch HA, Costa MM: Influência das fases oral e faríngea na dinâmica da deglutição. Arq Gastroenterol. 2004;41:18-23.
Recebido em 26/7/2006. Aprovado em 5/12/2006. Costa MMB, Almeida JT, Sant’Anna E, Pinheiro GM. Padrões reprodutíveis de viscosidade para uso em videofluoroscopia e na terapia de reabilitação de pacientes
disfágicos. Arq Gastroenterol. 2007;44(3):297-303
RESUMO – Racional - Com freqüência, a consistência identificada e indicada pelo exame videofluoroscópico como segura, para uso nos pacientes disfágicos, tem sido empiricamente produzida pela mistura de alimentos com a solução de sulfato de bário. É expressiva a dificuldade observada quando se busca reproduzir esta consistência, subjetivamente indicada, para usá-la na terapia de reabilitação. Objetivo - Construir duas series de soluções, com valores reprodutíveis de viscosidade, uma com e outra sem a adição de sulfato de bário, a serem utilizadas a primeira, como meio de contraste radiológico, e a segunda, como base para reprodução da consistência definida como segura na reabilitação do paciente disfágico. Métodos - As duas séries com viscosidades padrão foram buscadas com uso de amido, água destilada e solução de sulfato de bário a 100%. Os níveis de viscosidade foram definidos passo à passo com o uso de um viscosímetro digital (Brookfield, model LVTD-II) e um termômetro de infravermelho Icel TD-960. As viscosidades foram registradas em centipoise (cP) e os limites superior e inferior de cada nível foi complementado pela informação do tipo e velocidade do “spindle” necessário e da temperatura da solução. Resultados - As duas series de soluções, com e sem sulfato de bário, puderam ser definidas como aquosa (>1-143,5 cP), líquido fino (428-551 cp), liquido espesso (4.284-7.346,5 cp), pastosa (7.346,4-13.035 cP), pastosa espessa (19.260-34.320 cP) e cremosa (163.500-255.300 cP). Conclusões - Podem-se oferecer fórmulas com viscosidades reprodutíveis, com e sem adição de meio de contraste, a serem utilizadas, cada uma delas, na avaliação radiológica e na terapia nutricional, minimizando as falhas de reprodução entre a avaliação e a terapia.