0103 - 5053 $6.00+0.00
Short Report
* e-mail: [email protected], [email protected]
Viscometric Study of High-
cis
Polybutadiene in Toluene Solution
Ivana L. Mello,a Marcia C. Delpech,b Fernanda M. B. Coutinho*,a,b and Fernanda F. M. Albinob
a
Instituto de Macromoléculas Professora Eloisa Mano, Universidade Federal do Rio de Janeiro, CP 68525, 21945-970 Rio de Janeiro-RJ, Brazil
b
Instituto de Química, Universidade do Estado do Rio de Janeiro, Rua São Francisco Xavier, 524, Pavilhão Haroldo Lisboa da Cunha, sala 424A, 20559-900 Rio de Janeiro-RJ, Brazil
Medidas viscosimétricas, em solução de tolueno a 30 °C, foram realizadas com polibutadieno alto-cis sintetizado com catalisadores à base de neodímio. Seis diferentes equações foram usadas
para calcular as viscosidades intrínsecas e as constantes viscosimétricas: Huggins, Kraemer, Martin e Schulz-Blaschke por extrapolação gráfica e Solomon-Ciuta, Deb-Chanterjee e novamente Schulz-Blaschke, por medida de único ponto. O peso molecular dos polímeros foi determinado aplicando-se a equação de Mark-Houwink-Sakurada, utilizando-se para isso, os valores de viscosidade intrínseca obtidos pelas seis equações. Os valores de viscosidade intrínseca e de peso molecular viscosimétrico médio foram comparados a fim de verificar a validade da determinação por um único ponto.
Viscometric measurements, in toluene solution at 30 oC, were performed with high-cis
polybutadiene synthesized by neodymium based catalyst. Six different equations were used to calculate intrinsic viscosities and viscosimetric constant values: Huggins, Kraemer, Martin and Blaschke by graphic extrapolation, and Solomon-Ciuta, Deb-Chanterjee and again Schulz-Blaschke, through a single point determination. The molecular weight of the polymers was also determined applying Mark-Houwink-Sakurada equation using the values of intrinsic viscosity obtained by the six equations. The values of intrinsic viscosity and viscosity-average molecular weight obtained by the two methods were compared in order to verify the validity of the single point determination for high-cis polybutadiene.
Keywords: polybutadiene, viscosity, molecular weight, single point determination
Introduction
High cis-polybutadiene (BR) is commercially obtained by solution polymerization using Ziegler-Natta catalyst systems based on titanium, cobalt or nickel and more recently on lanthanides, being neodymium-based catalysts particularly active and stereospecific. The polymers obtained by using of the latter catalytic system present properties superior to the high cis-polybutadiene produced by other catalysts.1-5
Characterization of this polymer has been done extensively by techniques such as size exclusion chromatography (SEC), infrared spectroscopy (FTIR) and nuclear magnetic resonance (NMR). However, few publications mention viscometric measurements and, even then, as a complement to the results obtained from other techniques. Nevertheless, viscometry provides very
interesting information involving, for example, the quality of the solvent used, as far as intrinsic viscosity values and some coefficients parameters are concerned.6
The specific viscosity determines the contribution of the solute to the viscosity of the solution. The reduced viscosity (equation 1) provides a measurement of the polymer capacity of increasing the solution viscosity. When this parameter is extrapolated to infinite dilution, a viscosity value is obtained (intrinsic viscosity) in conditions where the macromolecules can be considered as isolated. Thus, from measurements of specific viscosity, it is possible to attain the intrinsic viscosity through graphic extrapolations.
ηred = ηsp/c (1)
commonly employed equations are Huggins, Kraemer, Martin and Schulz-Blaschke; equations 2 to 5, respec-tively. In order to apply these relations, practical determinations using different concentrations of polymer solutions are carried out by counting the efflux time of these solutions through a capillary.6,7,9,10
ηsp /c = [η]h + kh [η]h2 c (2) ln ηr /c = [η]k - kk [η]k2 c (3)
ln ηsp /c = ln [η]m + km [η]m c (4)
ηsp /c = [η]sb + ksb [ηsb]ηsp (5) where: ηr = t/to = relative viscosity or viscosity ratio (efflux time ratio between the solution, in a determined concentration, and the solvent); ηsp = specific viscosity (ηsp = ηr - 1); [η]h = lim cÆ0ηred = intrinsic viscosity or limiting viscosity number, respective to Huggins equation; [η]k = lim cÆ0 ηinh = intrinsic viscosity, respective to Kraemer equation; [η]m = lim cÆ0 ln ηred = intrinsic viscosity, respective to Martin equation; [η]sb = lim cÆ0ηred = intrinsic viscosity or limiting viscosity number, respective to Schulz-Blaschke equation; kh, kk, km, and ksb = Huggins, Kraemer, Martin and Schulz-Blaschke coefficients, respectively. For many polymer systems, ksb = 0.28 has been found.6,7,10
Some relations have been proposed for determining the intrinsic viscosity from a single point viscosity measurement of a dilute solution. This method has the advantage of being more rapid and adequate when a large number of samples have to be analyzed in short periods of time. Moreover, it has the advantage of being independent of a constant value, in constrast to graphical extrapolation determinations.
Solomon and Ciuta derived their intrinsic viscosity relationship (equation 6) by combining equations 2 and 3.
[η] = [2 (ηsp – ln ηr)]1/2 / c (6)
Equation 7 was proposed by Deb and Chanterjee as an expression for single point determination method of intrinsic viscosity.
[η] = (3 ln ηr + 3/2 η2sp – 3 ηsp)1/3 / c (7)
The use of these equations has been derived considering the relation kh + kk = 0.5. 9
Viscometry is the simplest technique used to study the macromolecules in solution and to determine their molecular
weight. According to the Mark-Houwink-Sakurada relation (equation 8), the value of intrinsic viscosity changes with the molecular weight of the polymer in a solvent as:
[η] = K Ma (8)
Where the two parameters K and a are related to the “stiffness” of the chain and depend on the type of polymer, solvent and temperature.7,11,12
The aim of this work was to obtain viscometric parameters (intrinsic viscosity and constant values) of toluene solutions of high-cis polybutadienes by graphic extrapolation and by a single point determination. The viscosity-average molecular weight, determined by employing the values of intrinsic viscosity obtained by the six different equations, were compared. The validity of the single point determination method for this type of polymer, in the investigated conditions, was also evaluated.
Experimental
Five different samples of high-cis polybutadiene were used in this study: BR-1, BR-2, BR-3, BR-4 and BR-5. These samples were prepared using a catalyst system based on neodymium, according to the procedure described in literature.13
Number-average and weight-average molecular weight were determined by size exclusion chromatography (SEC), in a Waters 150-C Plus apparatus, fitted with an RI detector, at 30 ºC, using THF as solvent, at 1mL min-1
flow rate. Monodisperse polystyrene standards were employed to obtain the calibration curve. Styragel columns with exclusion limits between 50 and 1 x 10⁶ Å were used.
The cis-1,4 units contents of the polymers were determined by infrared spectroscopy (FTIR) of the polymer in a Perkin-Elmer equipment, model Spectrum One, as films formed on KBr cells, prepared from 2% (m/v) chloroform solutions, according to the method of Schröder.14 All
polymer samples presented cis-1,4 content around 98%. Viscometric parameters determinations were carried out at 30 ± 0.1 °C, in 0.5% (m/v) toluene solutions, using an Ubbelohde 0B viscosimeter. By graphic extrapolation to infinite dilution, experimental determination was carried out by counting the efflux time of at least six concentrations of the samples solutions. The efflux time of the solutions was manually determined by using a chronometer. In single measurements, the lowest value of solutions concentration was chosen for the calculations. For viscosity-average molecular weight (M— v) determination the constants K = 30.5 x 10³ mL g-1
Results and Discussion
The intrinsic viscosity [η] provides information about the hydrodynamic volume of a macromolecule in a solvent. The adimensional parameter of entanglement, c[η] (where c is the concentration), is a measure of the volumetric portion occupied by the chain in solution. In the critical concentration, c*, a transition occurs leading to a change in flow properties due to the formation of entanglements among the macromolecules. In concen-tration values lower than c*, the isolated chains are free to move surrounded by solvent molecules, i.e., the solutions are diluted. The critical concentration may be determined by plotting log ηsp log c[η]h. When linear relations are achieved, the solutions fit the range corresponding to diluted systems. Figure 1 presents the relation between log ηsp and log c[η] obtained for all samples, in toluene, at 30 oC. A linear relation was
observed for all the samples analyzed, indicating that all determinations were performed in newtonian flow.
Viscometric data for high-cis polybutadiene were determined employing equations 2 to 7. Huggins (H), Kraemer (K), Martin (M) and Schulz-Blaschke (SB) equations were applied in graphic extrapolation. In this case, the respective intrinsic viscosity and constants values were calculated. In single point determinations, Schulz-Blaschke (adopting ksb = 0.28), Solomon-Ciuta (SC) and Deb-Chanterjee (DC) equations were used. Table 1
presents the intrinsic viscosity values related to all equations and Table 2 shows the viscometric constants obtained for all samples of high-cis polybutadiene analyzed in this work.
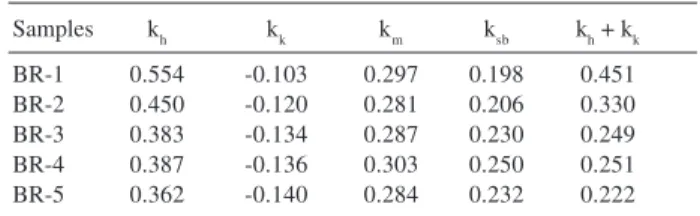
Taking into account the values of kh, kk and ksb calculated by graphic extrapolation, some considerations must be done. Huggins and Kraemer coefficients are adequate to evaluate the solvent quality. The former is accepted as a parameter related to polymer-solvent interactions. Experimental results indicate that values lower than 0.5 are obtained for diluted polymer solutions in good solvents.7 The higher the affinity between polymer
and solvent, the lower the value of kh. Table 2 shows that for all samples kh < 0.5, hence toluene should be considered a good solvent for high-cis polybutadiene. This conclusion is supported by kk because negative values of Kraemer coefficients indicate good polymer solvation.
It is important to observe that the relation kh + kk = 0.5 was not found for the great majority of the samples analyzed (Table 2). However, both [η]sc and [η]dc were close to [η]h, [η]k, [η]m and [η]sb, which were obtained by graphic extrapolation, with small percentual differences, except for BR-1. In this case, (kh + kk) values different from 0.5 did not imply any restriction for the application of SC and DC equations.
Although, ksb values obtained for the samples by graphic extrapolation were different from 0.28 (varying in the range from 0.2 to 0.25) (Table 2), the use of this value for the single point determination produced [η]sb values very close to the ones obtained by extrapolation (Table 1).
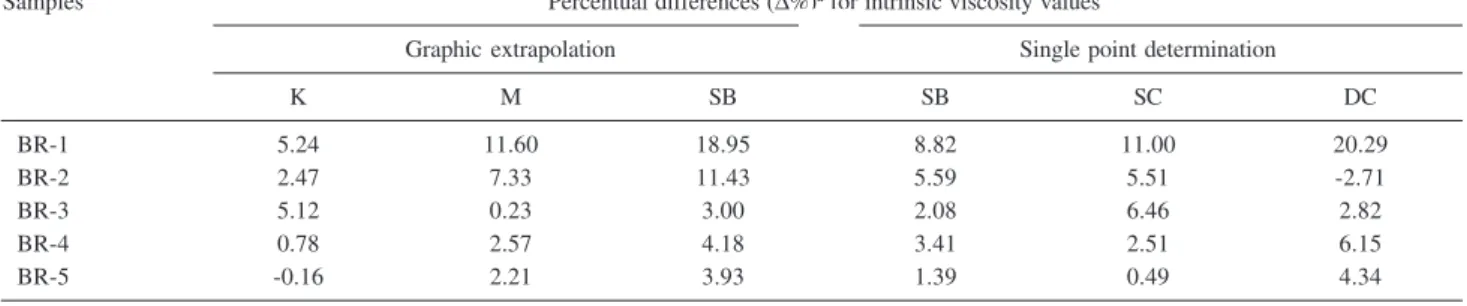
Table 3 presents the percentual differences (∆%) calculated for intrinsic viscosity values obtained by Kraemer, Martin, Shulz-Blaschke, Solomon-Ciuta and
Figure 1. log ηspversus log c[η] for all samples.
Table 2. Viscometric constants calculated for high-cis polybutadiene
Samples kh kk km ksb kh + kk
BR-1 0.554 -0.103 0.297 0.198 0.451
BR-2 0.450 -0.120 0.281 0.206 0.330
BR-3 0.383 -0.134 0.287 0.230 0.249
BR-4 0.387 -0.136 0.303 0.250 0.251
BR-5 0.362 -0.140 0.284 0.232 0.222
Table 1. Intrinsic viscosity values determined for high-cis polybutadiene in toluene, at 30 oC
Samples [η]h / (dL g-1)a [η]k /(dL g-1) a [η]m /(dL g-1)a [η]sb /(dL g-1)a [η]sb /(dL g-1)b [η]sc /(dL g-1)c [η]dc /(dL g-1)c
BR-1 3.051 3.211 3.405 3.629 3.320 3.386 3.670
BR-2 2.468 2.529 2.649 2.750 2.606 2.604 2.401
BR-3 2.166 2.277 2.171 2.231 2.211 2.306 2.227
BR-4 1.674 1.687 1.717 1.744 1.731 1.716 1.777
BR-5 1.222 1.220 1.249 1.270 1.239 1.228 1.275
a Calculated by graphic extrapolation; b Calculated through a single point determination (k
Deb-Chanterjee equations, when compared with the values produced by Huggins equation.
The results in Table 3 confirm that the application of ksb = 0.28 is suitable to describe the system high-cis polybutadiene-toluene, at 30 oC. The percentual differences
obtained for intrinsic viscosity values from SB equation, by a single point determination were remarkably lower than those calculated by graphic extrapolation data.
By comparing Schulz-Blaschke (SB), Solomon-Ciuta (SC) and Deb-Chanterjee (DC) equations employed in the single point determination, it is notable that intrinsic viscosity values obtained from SC equation produced the smallest percentual differences for BR-4 and BR-5. For BR-1 and BR-3 the percentual differences obtained by SB equation were lower and similar for BR-2 when compared with those obtained from Huggins equation. It seems that for higher [η] the SB equation should be applied and for lower [η] the SC equation is better.
The viscosity of dilute solutions is greatly affected by the molecular weight and molecular conformation of the dissolved polymer. Literature shows that by increasing the molecular weight of a polymer, the intrinsic viscosity also increases.15 Table 4 shows a
concomitant reduction in intrinsic viscosity and molecular weights. Table 4 also presents a comparison between molecular weight values of high-cis poly-butadienes obtained by size exclusion chromatography (SEC) and by viscometry, employing intrinsic viscosity values obtained by using equations 2-7.
By comparing viscosity-molecular weight with weight-average molecular weight obtained by SEC, it can be noticed that, for the samples with higher values, the difference between both results are lower, showing good agreement. As the molecular weights decrease, especially for the samples BR-4 and BR-5, these values show a discrepancy. An explanation for these results could be that the constants K and a may be more accurate for a range of higher molecular weight samples. Nevertheless, for the constants values used in the calculations, the range of molecular weight varied from 5x10⁻⁴ to 50x10-4, in which
the samples fit.15 Another source of discrepancy could be
the diversification in the techniques and respective analysis conditions, such as differences in techniques, standards employed solvents and temperatures.
The percentual differences (∆%) obtained for viscometric-molecular weight values are showed in Table 5. These values were calculated taking M— v determined by Huggins equation as a reference. A tendency of decreasing in the values of ∆% can be noticed as the molecular weights decrease, for all samples. Among the molecular weight values obtained by a single point determination, the three equations employed (SB, SC and DC) showed results not much different than those obtained by graphic extrapolation. Solomon-Ciuta equation again presented the smallest percentual differences, being more suitable to be applied for the fast determination in the systems analyzed.
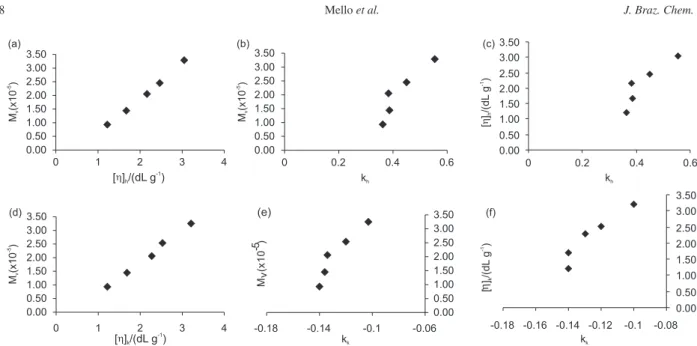
Figure 2 shows some graphic relations of viscosity-molecular weight and viscometric parameters obtained
Table 3. Percentual differences (∆%) obtained for intrinsic viscosity values calculated by graphic extrapolation (Kraemer (K), Martin (M) and Schulz-Blaschke (SB) equations) and by a single point measurement (Schulz-Schulz-Blaschke (SB), Solomon-Ciuta (SC) and Deb-Chanterjee (DC) equations), taking Huggins intrinsic viscosity, [η]h, as reference
Samples Percentual differences (∆%)a for intrinsic viscosity values
Graphic extrapolation Single point determination
K M SB SB SC DC
BR-1 5.24 11.60 18.95 8.82 11.00 20.29
BR-2 2.47 7.33 11.43 5.59 5.51 -2.71
BR-3 5.12 0.23 3.00 2.08 6.46 2.82
BR-4 0.78 2.57 4.18 3.41 2.51 6.15
BR-5 -0.16 2.21 3.93 1.39 0.49 4.34
a∆% = [100 ([η] / [η] h)] - 100.
Table 4. Intrinsic viscosity of Huggins [η]h and molecular weight values (expressed in g mol-1) of high-cis polybutadiene obtained by SEC and viscometry
Samples [η]h/(dL g-1) M— na —M wa —M v h b M— vk b M— vm b M— vsb b M— vsb b M— vsc b —M vdc b
BR-1 3.051 103 000 411 000 329 200 325 300 383 000 418 200 369 900 380 100 424 700
BR-2 2.468 93 000 340 000 245 400 254 200 271 000 285 200 264 900 264 900 236 300
BR-3 2.166 57 000 289 000 205 300 205 900 213 800 220 000 213 200 211 200 223 800
BR-4 1.674 48 000 225 000 143 900 145 400 149 000 152 200 150 600 148 800 156 200
BR-5 1.222 44 000 223 000 93 200 93 000 96 100 98 300 95 000 93 800 98 800
from Huggins and Kraemer equations, the two most commonly employed relations in viscometry. The rela-tions between M— v and [η] obtained by both Huggins and Kraemer equations are undoubtedly linear. The plots involving M— v and [η] versus the respective constant k showed a similar behavior for both equations and a tendency of curvature. The values of the constants obtained from Huggins and Kraemer equations raised with the increase of molecular weight and intrinsic viscosity values of high-cis polybutadiene samples in the conditions employed in this work.
Conclusions
Viscometric parameters determined by graphic extrapolation and by a single point determination, in this work were in good accordance, being the latter type of calculation, which is more rapid, suitable for high-cis polybutadiene. For higher values of [η] the SB equation
should be applied and for lower [η] the SC equation works better. It was verified that, for all the samples, Huggins constants were lower than 0.5 indicating that toluene is a good solvent for high-cis polybutadiene, at 30 oC. This
result was confirmed by negative Kraemer constant which also indicates good solvation.
The use of intrinsic viscosity values obtained from single point determination produced good results, which is a confirmation that this more rapid method seems to be valid in this study. It was also verified a linear relation between M— v and [η], obtained from both Huggins and Kraemer equations. The plots involving M— v and [η] versus the respective constant k also showed a similar profile for both equations.
Acknowledgments
The authors thank Conselho Nacional de Desenvolvimento Científico e Tecnológico (CNPq), Fundação Carlos Chagas Filho de Amparo à Pesquisa do Estado do Rio de Janeiro (FAPERJ) and Petroflex Ind. & Com. for financial support of this work.
References
1. Mello, I. L.; Coutinho, F. M. B.; Nunes, D. S. S.; Soares, B. G.; Costa, M. A. S.; Maria, L. C. S.; Quim. Nova2004, 27, 277. 2. Nickaf, J. B.; Burford, R. P.; Chaplin, R. P.; J. Polym. Sci., Part
A: Polym. Chem. 1995, 33, 1125.
3. Lauretti, E.; Miani, B.; Mistrali, F.; Rubber World1994, May, 34.
Table 5. Percentual differences (∆%) obtained for viscometric molecular weight values
Samples Percentual differences (∆%)a for molecular weight values
M —
vk M— vm —M vsb —M vsb —M vsc —M vdc
BR-1 -1.17 16.36 27.06 12.38 15.48 29.03
BR-2 3.56 10.38 16.23 7.92 7.92 -3.73
BR-3 0.32 4.16 7.13 3.87 2.87 9.02
BR-4 1.06 3.56 5.78 4.71 3.47 8.59
BR-5 -0.23 3.06 5.44 1.93 0.67 5.97
a∆% = [100 ([
η] / [η]h)] - 100.
Figure 2. Relation between molecular weight and viscometric parameters of polybutadiene high-cis: (a) viscosity-average molecular weight (Mv) and
intrinsic viscosity of Huggins [η]h; (b) viscosity-average molecular weight (Mv) and Huggins constant (kh); (c) intrinsic viscosity of Huggins [η]h and
Huggins constant (kh); (d) viscosity-average molecular weight (Mv) and intrinsic viscosity of Kraemer [η]k; (e) viscosity-average molecular weight (Mv)
4. Wilson, D. J.; Makromol. Chem., Macromol. Symp.1993, 66, 273. 5. Pires, N. M.; Coutinho, F. M. B.; Costa, M. A. S.; Eur. Polym.
J. 2004, 40, 2599.
6. Delpech, M. C.; Coutinho, F. M. B.; Habibe, M. E. S.; Polym. Test.2002, 21, 411.
7. Delpech, M. C.; Oliveira, C. M. F.; Polym. Test.2005, 24, 381. 8. Mitchell, J. R.; Polysaccharides in Food,
Butterworth-Heinemann: London, 1979.
9. Abdel-Azim, A. A.; Atta, A. M.; Farahat, M. S.; Boutros, W. Y.; Polymer1998, 39, 6827.
10. Delpech, M. C.; Coutinho, F. M. B.; Habibe, M. E. S.; Polym. Test.2002, 21, 155.
11. Robinson, G.; Ross-Murphy, S.; Morris, E. R.; Carbohydr. Res.
1982, 107, 17.
12. Simionescu, C. I.; Ioan, S.; Simionescu, B. C.; Eur. Polym. J.
1987, 23, 69.
13. Mello, I. L.; Coutinho, F. M. B.; Nunes, D. S. S.; Soares, B. G.; Costa, M. A. S.; Maria, L. C. S.; Eur. Polym. J.2004, 40, 635. 14. Schröder, E.; Müller, G.; Arndt, K.; Polymer Characterization,
Hanser Publishers: Munich, 1989.
15. Kurata, M.; Tsunashima, Y.; Polymer Handbook, Wiley: New York, 1999.
16. Tager, A.; Physical Chemistry of Polymers, Mir Publishers: Moscow, 1972.
Received: March 18, 2005