Subsampling and between-haul variation on chilean hake selectivity 345
Lat. Am. J. Aquat. Res., 40(2): 345-357, 2012 DOI: 10.3856/vol40-issue2-fulltext-9
Research Article
The effects of subsampling and between-haul variation on the size-selectivity
estimation of Chilean hake (Merluccius gayi gayi)
Dante Queirolo1, Mauricio Ahumada1, Carlos F. Hurtado1, Milagrosa C. Soriguer2 & Karim Erzini3
1Escuela de Ciencias del Mar, Facultad de Recursos Naturales
Pontificia Universidad Católica de Valparaíso, P.O. Box 1020, Valparaíso, Chile
2Departamento de Biología, Facultad de Ciencias del Mar y Ambientales
Universidad de Cádiz, 11510 Puerto Real, Cádiz, España
3Centro de Ciências do Mar (CCMAR), Faculdade de Ciências do Mar e do Ambiente
Universidade do Algarve, 8005-139, Faro, Portugal
ABSTRACT. Using the data collected in a size selectivity experiment on Chilean hake (Merluccius gayi gayi) carried out in 2000, the selectivity parameters for four codend mesh sizes (100, 110, 130, and 140 mm of mesh size opening) were estimated and modelled by the SELECT model. These analyses included considerations of the sampling proportions of the catch in the codend and cover. Furthermore, the analyses took into account between-haul variation. The l50 values were 30.8, 29.9, 30.0, and 41.2 cm of total length, respectively, values
lower than the estimates obtained from previous studies. The contribution of explanatory variables to the selectivity model was also tested in order to determine the role of mesh size, catch size (in number), and towing speed. Increases in catch size and in towing speed were accompanied by decreases in the l50 estimates.
These results demonstrate how incorporation of subsampling effect and explanatory variables to model between-haul variation can improve selectivity estimates and management of a valuable resource.
Keywords: size selectivity, mesh size, subsampling effect, between-haul variation, Merluccius gayi gayi, Chile.
Los efectos de submuestreo y variación entre lances en la estimación de la
selectividad a la talla de la merluza común (Merluccius gayi gayi)
RESUMEN. Usando los datos recolectados en un experimento de selectividad a la talla de merluza común (Merluccius gayi gayi) realizado en el año 2000, se estimaron y modelaron los parámetros de selectividad para copos de cuatro tamaños de malla (100, 110, 130 y 140 mm de tamaño de malla interno) mediante el modelo SELECT. Los análisis incluyeron consideraciones de las proporciones de muestreo de la captura en el copo y en el cubrecopo. Además, los análisis tuvieron en cuenta la variación entre lances. Los valores de l50 fueron30,8; 29,9; 30,0 y 41,2 cm longitud total respectivamente, valores menores que los obtenidos en estudios previos. Se probó también la contribución de variables explicatorias al modelo de selectividad, para determinar el aporte del tamaño de malla, el volumen de captura (en número) y la velocidad de arrastre. Los incrementos en el volumen de captura y en la velocidad de arrastre produjeron una disminución en los estimados de l50.
Estos resultados demuestran cómo, a partir de la incorporación del efecto de submuestreo y de variables explicatorias al modelo con variación entre lances, es posible mejorar los estimados de selectividad y manejar un valioso recurso.
Palabras clave: selectividad a la talla, tamaño de malla, efecto de submuestreo, variación entre lances,
Merluccius gayi gayi, Chile.
___________________
Latin American Journal of Aquatic Research 346
INTRODUCTION
Chilean hake (Merluccius gayi gayi) occurs along the coast of Chile between 23º and 47ºS at depths from 50 to 500 m. It is the main demersal species caught along the central coast. The biomass of this resource decreased dramatically as a consequence of natural (cannibalism and predation) and fishing mortality from 2002 to 2005 and the current stock assessment indicates that it is overexploited (SUBPESCA, 2010). The proportion of fish below the size-at-maturity has increased since 2004 (more than 70% of the catches) and the present spawning biomass is below the limit reference level of 20% established for the fishery (SUBPESCA, 2010).
Regulation of mesh size is one of the most common management measures in fisheries. Speci-fication and use of an appropriate mesh size can contribute to increases in the size of first capture and can reduce the mortality of smaller fish. Only one experiment on size selectivity has been performed for the Chilean hake trawling fishery over the last decade. Gálvez et al. (2000) analysed the selectivity of four mesh sizes (100, 110, 130 and 140 mm) using the covered codend method and the results were later published by Gálvez & Rebolledo (2005). These
authors estimated similar l50 values among the
different mesh sizes used, although the escape proportions increased with increasing mesh size. These results were compared with different selectivity studies carried out in Gadiformes (Fig. 1). A linear relation was found for this group of fishes between the mesh size and the 50% retention length, with a slope of ∼0.4. Because Gálvez & Rebolledo (2005) found a lower value of the slope for this relationship (∼0.1), the procedures were reviewed. In fact, the sampling proportions of the codend and cover were not considered in their analysis. Subsampling is necessary when the catch is so large that it is not possible to measure every single individual (Wileman et al., 1996). The effect of subsampling can be incorporated in two ways: (i) expanding the sample to the total catch or (ii) correcting the estimated parameters by a subsampling factor. Millar (1994) points out that the second case is preferable because it uses raw (unscaled) data and thereby ensures statistical rigour.
Replicate hauls using the same trawl and configuration indicate that codend selectivity changes from one haul to another. Fryer (1991) indicated that the between-haul variation could be due to a number of “uncontrolled” factors. Examples of such factors include the haul duration, catch size, fishing season and depth among others (O’Neill & Kynoch, 1996;
Millar & Fryer, 1999; Fonseca et al., 2007; Grimaldo
et al., 2008; Sala & Lucchetti, 2010).
The objective of this study was to estimate the selectivity parameters so as to account for subsampling proportions. Moreover, explanatory variables were added in order to incorporate the effects of between-haul variation. The resulting parameter values were compared with previous estimates.
MATERIALS AND METHODS
Selectivity experiments were conducted during March-April 2000 on board a stern trawler (41.7 m overall length; 1900 HP) in the central-southern area of Chile (between 34º50’-35º40’S). Hauls were made during daylight hours at depths from 90 to 260 m. The duration of each haul varied between 14 and 135 min. Towing speed fluctuated between 3.0 and 4.0 knots (3.4 knots average speed) (Table 1). The hauls were carried out using a 53-m headline and 37-m footrope Engel Balloon Trawl, with four experimental codends of 100, 110, 130 and 140 mm mesh size opening. The covered codend method was used to retain the fish that escaped through the meshes (Galvez & Rebolledo, 2005). A length-frequency dataset was obtained from 32 covered codend experimental hauls (Table 1).
The data from each of the two compartments (codend and cover) were analysed separately. The catch weight for each compartment j was estimated for each haul. In order to estimate the catch in numbers of Chilean hake, a length-weight function was applied based on data recorded by Lillo et al. (2001). The
average specimen weight was then determined
( )
w .
jThe number of retained specimens by haul and compartment was obtained according to
j j j
w
W
N
=
,where Wj is the catch weight in each compartment.
For each haul, the retention probability r(l) of the codend was modelled using a logistic curve:
( )
vvvlvle
e
l
r
2 1 2 11
+ ++
=
, where r(l) is the (conditional)retention probability of a fish of length l given that it entered the codend (Wileman et al., 1996), and
(
)
Tv
v
v
=
1+
2 is the vector of the selectivityparameters. The correction for the effects of subsampling was performed according to Millar (1994) who showed that for subsampled hauls
( )
v vvlvle
e
l
r
2 * 1 2 * 11
'
+ ++
=
, wherev
1*=
v
1+
ln
( )
q
andSubsampling and between-haul variation on chilean hake selectivity 347
Figure 1. Estimates of l50 for some species of the Merlucciidae and Gadidae families as a function of mesh size. Chilean
hake: Saetersdal & Villegas (1968); Arana (1970); Gálvez & Rebolledo (2005). European hake: Campos & Fonseca (2003); Campos et al. (2003a, 2003b); Deval et al. (2007); Lucchetti (2008); Sala & Lucchetti (2010); Tokaç et al. (2010). Argentine hake: Rojo & Silvosa (1970); Verazay et al. (1992). Peruvian hake: Salazar et al. (1996). Atlantic cod: Sakhno & Sadokhin (1982); Netzel & Zaucha (1989); Isaksen & Valdemarsen (1990); Isaksen et al. (1990); Hickey et al. (1993); Lowry et al. (1995); Huse et al. (1996); Tschernij et al. (1996); Halliday et al. (1999); Tschernij & Holst (1999); Blady & Zaucha (2000); Wienbeck & Dahm (2000); Halliday (2002); Madsen et al. (2002); Graham et al. (2004); He (2007); Grimaldo et al. (2008). Haddock: Sakhno & Sadokhin (1982); Robertson & Stewart (1988); Isaksen et al. (1990); Reeves et al. (1992); Sangster & Lehmann (1994); Halliday et al. (1999); Halliday (2002); Graham et al. (2004); He (2007); Grimaldo et al. (2008). Blue whiting: Campos et al. (2003a); Campos et al. (2003b); Sala & Lucchetti (2010); Tokaç et al. (2010). Pollock (saithe): Smolowitz (1983); Dahm (1998) and Graham et al. (2004).
Figura 1. Estimados de l50 para algunas especies de las familias Merlucciidae y Gadidae como función del tamaño de
malla. Chilean hake: Saetersdal & Villegas (1968); Arana (1970); Gálvez & Rebolledo (2005). European hake: Campos & Fonseca (2003); Campos et al. (2003a, 2003b); Deval et al. (2007); Lucchetti (2008); Sala & Lucchetti (2010); Tokaç et
al. (2010). Argentine hake: Rojo & Silvosa (1970); Verazay et al. (1992). Peruvian hake: Salazar et al. (1996). Atlantic
cod: Sakhno & Sadokhin (1982); Netzel & Zaucha (1989); Isaksen & Valdemarsen (1990); Isaksen et al. (1990); Hickey
et al. (1993); Lowry et al. (1995); Huse et al. (1996); Tschernij et al. (1996); Halliday et al. (1999); Tschernij & Holst
(1999); Blady & Zaucha (2000); Wienbeck & Dahm (2000); Halliday (2002); Madsen et al. (2002); Graham et al. (2004); He (2007); Grimaldo et al. (2008). Haddock: Sakhno & Sadokhin (1982); Robertson & Stewart (1988); Isaksen et
al. (1990); Reeves et al. (1992); Sangster & Lehmann (1994); Halliday et al. (1999); Halliday (2002); Graham et al.
(2004); He (2007); Grimaldo et al. (2008). Blue whiting: Campos et al. (2003a); Campos et al. (2003b); Sala & Lucchetti (2010); Tokaç et al. (2010). Pollock (saithe): Smolowitz (1983); Dahm (1998) y Graham et al. (2004).
2 1
p
p
q
=
is the rate of sampling proportions in thecodend and cover, respectively. The selectivity
parameters *
1
v and v2 of the logistic curve were
estimated by means of haul-by-haul maximum likelihood using the CC2000 software (ConStat).
The 50% retention length (l50) and the selection
range (SR) were estimated as
2 1 50
v
v
l
=
−
and( )
23
ln
2
v
SR
=
, respectively. The model proposed byFryer (1991) was then used to investigate the
between-haul variation of the selectivity parameters *
1
v and v2
for each configuration, thereby allowing an average curve to be estimated for the codends. Analysis was done using the ECModel software (ConStat) based on the residual maximum likelihood (REML) method proposed by Fryer (1991). The individual contri-
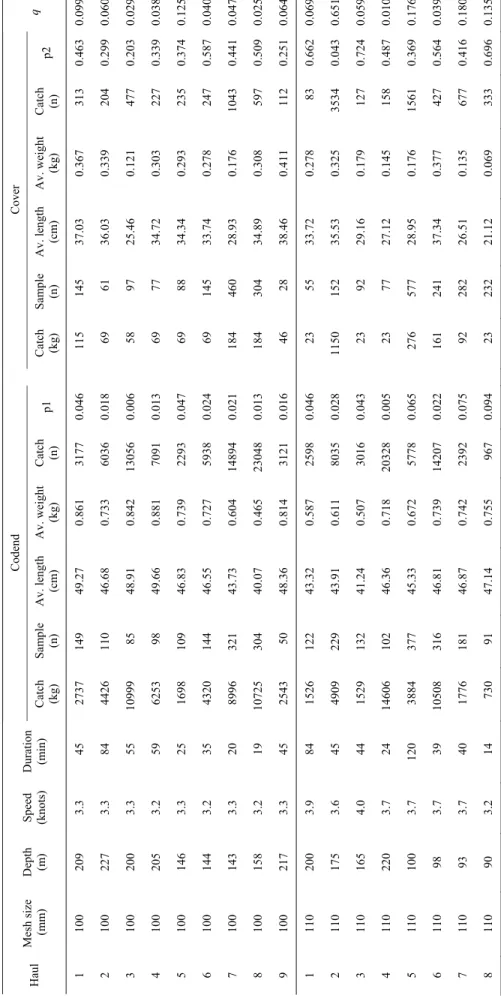
Ta ble 1 . Su m m ary of ha ul s and e xpl anat or y vari abl es u se d i n t he C hi le an ha ke sel ect iv ity experi m ents. Su bsam pl ing p ro po rt io ns by com part m ent (co de nd a nd cove r)
are also incl
uded. T a bl a 1. R esu m en de l os l ances y vari abl es ex pl icat ori as usa do s en l os ex peri m ent os de sel ect iv id ad de l a m erl uza chi le na. La s pr op or ci ones de s ubm uest reo po r com part im ent o (c op o y c ubre cop o) ta m bi én son in cl ui das. Codend Cover Haul Mesh size ( mm) Depth (m ) Speed (knots) Dur ation (m in) Catch (kg) Sa m ple (n ) Av. length (cm ) Av. weight (kg) Catch (n ) p1 Catch (kg) Sa m ple (n ) Av. length (cm ) Av. weight (kg) Catch (n ) p2 q 1 100 209 3. 3 45 2737 149 49. 27 0. 861 3177 0. 046 115 145 37. 03 0. 367 313 0. 463 0. 099 2 100 227 3. 3 84 4426 110 46. 68 0. 733 6036 0. 018 69 61 36. 03 0. 339 204 0. 299 0. 060 3 100 200 3. 3 55 1099 9 85 48. 91 0. 842 1305 6 0. 006 58 97 25. 46 0. 121 477 0. 203 0. 029 4 100 205 3. 2 59 6253 98 49. 66 0. 881 7091 0. 013 69 77 34. 72 0. 303 227 0. 339 0. 038 5 100 146 3. 3 25 1698 109 46. 83 0. 739 2293 0. 047 69 88 34. 34 0. 293 235 0. 374 0. 125 6 100 144 3. 2 35 4320 144 46. 55 0. 727 5938 0. 024 69 145 33. 74 0. 278 247 0. 587 0. 040 7 100 143 3. 3 20 8996 321 43. 73 0. 604 1489 4 0. 021 184 460 28. 93 0. 176 1043 0. 441 0. 047 8 100 158 3. 2 19 1072 5 304 40. 07 0. 465 2304 8 0. 013 184 304 34. 89 0. 308 597 0. 509 0. 025 9 100 217 3. 3 45 2543 50 48. 36 0. 814 3121 0. 016 46 28 38. 46 0. 411 112 0. 251 0. 064 1 110 200 3. 9 84 1526 122 43. 32 0. 587 2598 0. 046 23 55 33. 72 0. 278 83 0. 662 0. 069 2 110 175 3. 6 45 4909 229 43. 91 0. 611 8035 0. 028 1150 152 35. 53 0. 325 3534 0. 043 0. 651 3 110 165 4. 0 44 1529 132 41. 24 0. 507 3016 0. 043 23 92 29. 16 0. 179 127 0. 724 0. 059 4 110 220 3. 7 24 1460 6 102 46. 36 0. 718 2032 8 0. 005 23 77 27. 12 0. 145 158 0. 487 0. 010 5 110 100 3. 7 120 3884 377 45. 33 0. 672 5778 0. 065 276 577 28. 95 0. 176 1561 0. 369 0. 176 6 110 98 3. 7 39 1050 8 316 46. 81 0. 739 1420 7 0. 022 161 241 37. 34 0. 377 427 0. 564 0. 039 7 110 93 3. 7 40 1776 181 46. 87 0. 742 2392 0. 075 92 282 26. 51 0. 135 677 0. 416 0. 180 8 110 90 3. 2 14 730 91 47. 14 0. 755 967 0. 094 23 232 21. 12 0. 069 333 0. 696 0. 135
Latin American Journal of Aquatic Research 348
Codend Cover Haul Mesh size ( mm) Depth (m ) Speed (knots) Dur ation (m in) Catch (kg) Sa m ple (n ) Av. length (cm ) Av. weight (kg) Catch (n ) p1 Catch (kg) Sa m ple (n ) Av. length (cm ) Av. weight (kg) Catch (n ) p2 q 1 130 138 4. 0 45 4656 445 41. 96 0. 534 8718 0. 051 460 449 36. 71 0. 358 1284 0. 349 0. 146 2 130 132 4. 0 90 3196 585 40. 03 0. 463 6889 0. 084 644 462 35. 75 0. 331 1944 0. 237 0. 354 3 130 136 3. 1 55 1736 592 39. 29 0. 438 3955 0. 149 460 378 36. 37 0. 348 1319 0. 286 0. 520 4 130 135 3. 2 105 5194 374 41. 53 0. 517 1003 1 0. 037 1288 361 35. 67 0. 329 3914 0. 092 0. 402 5 130 139 3. 3 69 3588 358 41. 97 0. 534 6714 0. 053 598 361 34. 49 0. 297 2007 0. 179 0. 296 6 130 188 3. 1 40 3442 305 45. 97 0. 701 4913 0. 062 276 192 40. 92 0. 495 557 0. 344 0. 180 7 130 200 3. 1 120 2651 0 298 46. 17 0. 709 3734 5 0. 007 483 263 40. 52 0. 481 1004 0. 261 0. 026 1 140 147 3. 2 65 6024 245 46. 26 0. 714 8436 0. 029 2438 259 38. 89 0. 425 5724 0. 045 0. 644 2 140 159 3. 3 110 7484 281 47. 95 0. 794 9417 0. 029 4278 304 38. 31 0. 407 1050 7 0. 028 1. 035 3 140 184 3. 0 135 6736 249 49. 67 0. 882 7633 0. 032 2406 216 44. 38 0. 631 3812 0. 056 0. 571 4 140 260 3. 1 50 895 112 48. 83 0. 839 1067 0. 104 92 83 45. 18 0. 665 138 0. .601 0. 173 5 140 134 3. 2 45 288 81 45. 02 0. 658 437 0. 185 749 233 36. 63 0. 356 2103 0. 109 1. 681 6 140 130 3. 2 45 5417 203 48. 91 0. 842 6428 0. 031 699 211 40. 72 0. 488 1432 0. 147 0. 210 7 140 135 3. 1 64 6585 220 47. 11 0. 753 8741 0. 025 845 226 40. 12 0. 467 1809 0. 124 0. 201 8 140 185 3. 2 90 4518 191 51. 84 1. 002 4506 0. 042 311 188 45. 27 0. 669 465 0. 404 0. 103
Latin American Journal of Aquatic Research 350
butions of various explanatory variables to the selectivity parameters were tested using the ECModel according to the REML method (Fryer, 1991). The variables considered were mesh size, catch (in number and weight), tow duration, depth and towing speed. The choice of the best fit model was based on the lowest value for Akaike's Information Criterion (AIC) (Fryer & Shepherd, 1996).
RESULTS
To calculate the sample weight in each compartment (codend and cover), the length-weight relationship
979 . 2 6 76 . 7 i i e l
w = − (R2=0.97) was used for both sexes.
The catch in numbers for each haul was calculated using this relationship and the catch weight. The resulting values ranged between 437 and 37,345 specimens in the codend and between 83 and 10,507 in the cover (Table 1). The corresponding sample
proportions (p1 and p2) varied between 0.005 and
0.185 in the codend and between 0.028 and 0.724 in the cover. Accordingly, the relationship between the sample proportions (q) ranged between 0.01 and 1.68
(q=0.26). The q values for all hauls were taken into
account in order to fit the selectivity models.
Fig. 2 shows the fitted curves for each haul. For all hauls, the estimated model resulted in good fits (P >
0.05) (Table 2). With the selection parameters *
1
v and
2
v taken into consideration in the haul-by-haul
analysis, the resulting estimates of l50 ranged between
26.4 and 35.6 cm for the 100 mm mesh; between 22.9 and 35.4 cm for the 110 mm mesh; between 23.7 and 34.0 cm for the 130 mm mesh and between 35.3 and 45.6 cm for the 140 mm mesh. Using the fit of the average curve based on between-haul variation, values
of l50 were estimated as 30.8, 29.9, 30.0 and 41.2 cm
for each mesh size, respectively (Table 2). Selection range (SR) tended to increase with increasing mesh size. However, the 130 mm mesh exhibited a value higher than expected from the general tendency observed. The average values of SR were 6.9, 7.2, 11.9 and 8.3 cm for the 100, 110, 130 and 140 mm meshes, respectively (Table 2).
Addition of the explanatory variables to account for between-haul variation indicated that the parameter
* 1
v depends significantly on the catch in numbers (P =
0.01) and the towing speed (P = 0.023), whereas v2
depends on the mesh size (P < 0.001) (Table 3). This
analysis yields a direct relation between l50 and the
mesh size. On the other hand, the l50 value decreases
as catch and towing speed increase. The model that best described selectivity was:
⎟⎟ ⎠ ⎞ ⎜⎜ ⎝ ⎛ + + + = ⎟⎟ ⎠ ⎞ ⎜⎜ ⎝ ⎛ i i i m s c v v E 5 2 4 3 1 2 1 α α α α α
where ci is the catch (in numbers), si is the towing
speed (knots) and mi is the mesh size (mm). The depth
and duration variables did not contribute significantly to the model.
The effect of the catch for each mesh size used in the model was analysed for a range of 1,000 to 35,000 specimens caught and for a fixed towing speed corresponding to the average value of 3.4 knots. A
significant decrease of at least 6 cm TL in the l50 value
for extreme catches was observed for all mesh sizes
(Fig. 3). For example, the l50 of the 100 mm mesh was
29.9 cm for a small catch (1,000 specimens), while this value decreases to 23.1 cm for a large catch (35,000 specimens).
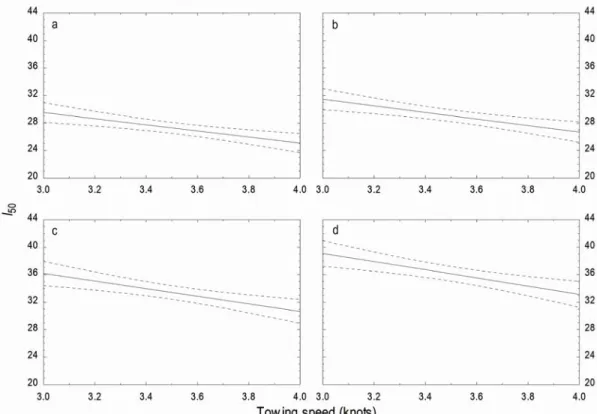
Likewise, the model with towing speeds between 3 and 4 knots was evaluated assuming a constant catch of 10,000 individuals. A decrease of at least 4.5 cm
TL in the l50 value for extreme speeds was observed
(Fig. 4). For the 140 mm mesh at a towing speed of 3
knots, the l50 was 39.0 cm. This value decreased to
33.1 cm for a towing speed of 4 knots.
Note that v2 depends only on the mesh size.
Accordingly, the SR values estimated using the model were 7.2, 7.7, 8.9 and 9.6 cm for the meshes of 100, 110, 130 and 140 mm, respectively.
DISCUSSION
This study was based on the same data used by Gálvez & Rebolledo (2005). However, the results of the two studies differ (Fig. 5). The main analytic difference is that these authors assume that the sampling proportions in the codend and in the cover are equal. This assumption leads to a significant overestimation of the selectivity parameters. When this effect and the between-haul variation are both taken into account,
the l50 estimate decreased by 9 cm for the 100, 110
and 130 mm mesh. The difference is lower (∼4 cm) in the 140 mm mesh (Fig. 5).
Incorporation of subsampling effects produced a
high dispersion of the l50 values. This effect is the
result of other variables included in the selection process. This consideration led us to introduce explanatory variables to the model and by including the mesh size, the catch (in numbers) and the towing speed, it was possible to achieve significant reductions in the dispersion of the estimates (Fig. 5). The effect
Subsampling and between-haul variation on chilean hake selectivity 351
Figure 2. Chilean hake individual-haul selection curves (dotted lines) for each mesh size. a) 100 mm, b) 110 mm, c) 130
mm, d) 140 mm. Each set of selection curves have been summarized by a mean selection curve (thick line) fitted using between-haul variation model of Fryer (1991).
Figura 2. Curvas de selección de la merluza chilena a cada lance (líneas segmentadas) para cada tamaño de malla. a) 100
mm, b) 110 mm, c) 130 mm, d) 140 mm. Cada grupo de curvas de selección fue resumida mediante una curva de selección (línea gruesa) ajustada usando el modelo de variación entre lances de Fryer (1991).
of catch size on codend selectivity has been discussed in numerous studies. Some authors find that increasing
catch size reduces l50 (Ehrhardt et al., 1996; Erickson
et al., 1996; Tschernij & Holst, 1999; Madsen et al.,
2002; Grimaldo et al., 2007). However, others have obtained the opposite result (O’Neill & Kynoch, 1996; Dahm et al., 2002), while emphasising that selectivity tends to decrease when the catch size is very high. On the other hand, the studies of Madsen et al. (1998), O’Neill et al. (2006) and Grimaldo et al. (2008) yielded inconclusive results or found only a weak effect of the catch variable.
Many different factors are involved in gear selectivity. For example, alterations in and obstruct-tions of the escape channels can be produced, and changes can also occur in the tension-deformation relation of the meshes. Indeed, Erickson et al. (1996) point out that large catch sizes can obstruct the codend meshes and thereby reduce the potential escape channels for fish. Additionally, in some Gadidae, haddock and whiting for example, “opportunistic escape” is more common than “active escape” (Jones
et al., 2008). This difference results in a reduced
probability of escape as the catch size increases. Tension-deformation is also an important factor. The increased size of the mesh opening and the change in the shape of the codend would both favour increased
selectivity (O’Neill & Kynoch, 1996; Herrmann, 2005; Madsen, 2007). Nevertheless, the increased drag produced by the operation of the trawl can increase the tension on the mesh bars. This increased tension can make escape more difficult (O’Neill et al., 2005) or can injure fish, thereby conditioning their post-escape survival (Suuronen, 2005).
Increased trawl speed thus affects selectivity adversely for two different reasons. Increased speed increases the resistance encountered by the gear, raises the tension on the codend meshes, and consequently reduces the mesh opening (Dahm et al., 2002; O’Neill
et al., 2005). On the other hand, an increase in trawl
speed also reduces the swimming performance of fish (Dahm et al., 2002; Breen et al., 2004). In this study, we did not have enough information to identify a
particular mechanism responsible for the l50 decrease.
However, Queirolo et al. (2010) noted in hake that when fish are close to the codend at a towing speed of 4 knots, most fish exhibit no movement, appear exhausted and drop back into the codend.
The model obtained in this study indicates that the selectivity decreases as the catch size increases. This effect could be explained by the obstruction of the escape channels and by the closure of the meshes due to the increase of the tension. In the model, selectivity
Latin American Journal of Aquatic Research 352
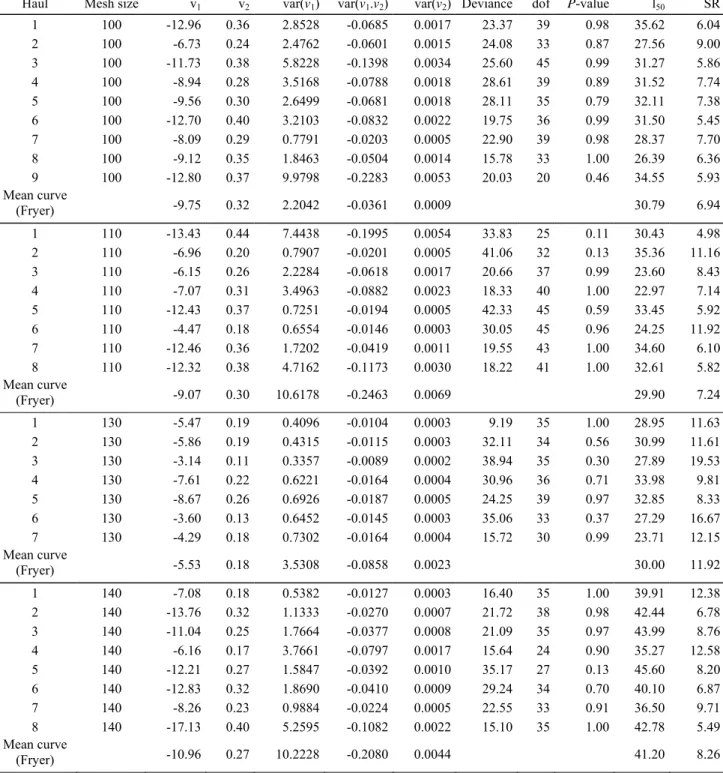
Table 2. Analysis of the Chilean hake selectivity by bottom trawls. The SELECT (Share Each Length Catch Total) model
estimates of the selection parameters (
v
1* and v2) for each haul. The within-haul variance, goodness of fit statistics, meancurve estimated by using between-haul variation (Fryer, 1991). Estimates of l50 and selection range (SR) are also given.
Tabla 2. Análisis de la selectividad de la merluza chilena por redes de arrastre de fondo. Estimados del modelo SELECT
de los parámetros de selección (v1* and v2) para cada lance. Se presenta también la variación intra lance, los estadísticos
de bondad de ajuste, la curva media estimada usando variación entre lances (Fryer, 1991) y los estimados de l50 y rango de
selección (SR).
Haul Mesh size v1 v2 var(v1) var(v1.v2) var(v2) Deviance dof P-value l50 SR
1 100 -12.96 0.36 2.8528 -0.0685 0.0017 23.37 39 0.98 35.62 6.04 2 100 -6.73 0.24 2.4762 -0.0601 0.0015 24.08 33 0.87 27.56 9.00 3 100 -11.73 0.38 5.8228 -0.1398 0.0034 25.60 45 0.99 31.27 5.86 4 100 -8.94 0.28 3.5168 -0.0788 0.0018 28.61 39 0.89 31.52 7.74 5 100 -9.56 0.30 2.6499 -0.0681 0.0018 28.11 35 0.79 32.11 7.38 6 100 -12.70 0.40 3.2103 -0.0832 0.0022 19.75 36 0.99 31.50 5.45 7 100 -8.09 0.29 0.7791 -0.0203 0.0005 22.90 39 0.98 28.37 7.70 8 100 -9.12 0.35 1.8463 -0.0504 0.0014 15.78 33 1.00 26.39 6.36 9 100 -12.80 0.37 9.9798 -0.2283 0.0053 20.03 20 0.46 34.55 5.93 Mean curve (Fryer) -9.75 0.32 2.2042 -0.0361 0.0009 30.79 6.94 1 110 -13.43 0.44 7.4438 -0.1995 0.0054 33.83 25 0.11 30.43 4.98 2 110 -6.96 0.20 0.7907 -0.0201 0.0005 41.06 32 0.13 35.36 11.16 3 110 -6.15 0.26 2.2284 -0.0618 0.0017 20.66 37 0.99 23.60 8.43 4 110 -7.07 0.31 3.4963 -0.0882 0.0023 18.33 40 1.00 22.97 7.14 5 110 -12.43 0.37 0.7251 -0.0194 0.0005 42.33 45 0.59 33.45 5.92 6 110 -4.47 0.18 0.6554 -0.0146 0.0003 30.05 45 0.96 24.25 11.92 7 110 -12.46 0.36 1.7202 -0.0419 0.0011 19.55 43 1.00 34.60 6.10 8 110 -12.32 0.38 4.7162 -0.1173 0.0030 18.22 41 1.00 32.61 5.82 Mean curve (Fryer) -9.07 0.30 10.6178 -0.2463 0.0069 29.90 7.24 1 130 -5.47 0.19 0.4096 -0.0104 0.0003 9.19 35 1.00 28.95 11.63 2 130 -5.86 0.19 0.4315 -0.0115 0.0003 32.11 34 0.56 30.99 11.61 3 130 -3.14 0.11 0.3357 -0.0089 0.0002 38.94 35 0.30 27.89 19.53 4 130 -7.61 0.22 0.6221 -0.0164 0.0004 30.96 36 0.71 33.98 9.81 5 130 -8.67 0.26 0.6926 -0.0187 0.0005 24.25 39 0.97 32.85 8.33 6 130 -3.60 0.13 0.6452 -0.0145 0.0003 35.06 33 0.37 27.29 16.67 7 130 -4.29 0.18 0.7302 -0.0164 0.0004 15.72 30 0.99 23.71 12.15 Mean curve (Fryer) -5.53 0.18 3.5308 -0.0858 0.0023 30.00 11.92 1 140 -7.08 0.18 0.5382 -0.0127 0.0003 16.40 35 1.00 39.91 12.38 2 140 -13.76 0.32 1.1333 -0.0270 0.0007 21.72 38 0.98 42.44 6.78 3 140 -11.04 0.25 1.7664 -0.0377 0.0008 21.09 35 0.97 43.99 8.76 4 140 -6.16 0.17 3.7661 -0.0797 0.0017 15.64 24 0.90 35.27 12.58 5 140 -12.21 0.27 1.5847 -0.0392 0.0010 35.17 27 0.13 45.60 8.20 6 140 -12.83 0.32 1.8690 -0.0410 0.0009 29.24 34 0.70 40.10 6.87 7 140 -8.26 0.23 0.9884 -0.0224 0.0005 22.55 33 0.91 36.50 9.71 8 140 -17.13 0.40 5.2595 -0.1082 0.0022 15.10 35 1.00 42.78 5.49 Mean curve (Fryer) -10.96 0.27 10.2228 -0.2080 0.0044 41.20 8.26
Subsampling and between-haul variation on chilean hake selectivity 353
Table 3. Analysis of the Chilean hake selectivity by bottom trawls. Contribution of explanatory variables on the selection
parameters; alpha parameter estimates, standard deviation, t-value, degrees of freedom (dof) and P-value.
Tabla 3. Análisis de la selectividad de la merluza chilena por redes de arrastre de fondo. Contribución de variables
explicatorias en los parámetros de selección; estimados del parámetro alpha, desviación estándar, valor t, grados de libertad (dof) y valor P.
Parameter Estimate Standard deviation t-value dof P-value
α1 (v1, intcpt) -13.970 2.098 -6.66 56 <0.001
α2 (v2, intcpt) 4.886 x 10⁻¹ 3.219 x 10⁻² 15.18 56 <0.001
α3 (v1, catch) 5.713 x 10⁻⁵ 2.145 x 10⁻⁵ 2.66 56 0.010
α4 (v1, speed) 1.363 5.843 x 10⁻¹ 2.33 56 0.023
α5 (v2, mesh size) -1.850 x 10⁻³ 2.401 x 10⁻⁴ -7.72 56 <0.001
Figure 3. Analysis of the Chilean hake selectivity by bottom trawls. Regression lines with 95% confidence bands for the
50% retention length (l50) depending on the catch size in the codend (in numbers) for each mesh size. a) 100 mm, b) 110
mm, c) 130 mm, d) 140 mm.
Figura 3. Líneas de regresión con bandas de confianza al 95% para la longitud de retención al 50% (l50) según el volumen
de captura en el copo (en número) para cada tamaño de malla. a) 100 mm, b) 110 mm, c) 130 mm, d) 140 mm. also decreased with increased towing speed. This
effect can be attributed to the lower swimming performance of the fish. The significance found for the explanatory variables in the selectivity model indicates that these variables could be included in management “good practices” recommendations for users. Although the tow duration was not significant in our results, we recognize that this variable plays an
important role both during the escape phase and post-escape survival (Suuronen, 2005), so it should be consider in subsequent studies.
In order to reduce the juvenile catch and avoid
growth overfishing, the recommended value of l50
should be greater than or equal to the size at sexual maturity estimated as 34 cm TL by Lillo et al. (2009). Likewise, assuming an average catch of 10,000 fish
Latin American Journal of Aquatic Research 354
Figure 4. Analysis of the Chilean hake selectivity by bottom trawls. Regression lines with 95% confidence bands for the
50% retention length (l50) depending on the towing speed (knots) for each mesh size. a) 100 mm, b) 110 mm, c) 130 mm,
d) 140 mm.
Figura 4. Líneas de regresión con bandas de confianza al 95% para la longitud de retención al 50% (l50) según la
veloci-dad de arrastre (nudos) para cada tamaño de malla. a) 100 mm, b) 110 mm, c) 130 mm, d) 140 mm.
Figure 5. Analysis of the Chilean hake selectivity by bottom trawls. Comparison of the 50% retention length (l50 in cm)
estimates (and their confidence intervals) obtained by three different approaches: i) Haul-by-haul estimation without no considering the sampling proportions (Gálvez & Rebolledo, 2005), ii) haul-by-haul considering sampling proportions (present work), iii) between-haul variation considering the sampling proportions and the effect of the explanatory variables (present work).
Figura 5. Análisis de la selectividad de la merluza chilena por redes de arrastre de fondo. Comparación de los estimados
de retención al 50% (l50 in cm) (y sus intervalos de confianza) obtenidos mediante tres diferentes aproximaciones: i)
estimación lance a lance sin considerar las proporciones de muestreo (Gálvez & Rebolledo, 2005), ii) lance a lance considerando las proporciones de muestreo (presente trabajo), iii) variación entre lances considerando proporciones de muestreo y el efecto de variables explicatorias (presente trabajo).
Subsampling and between-haul variation on chilean hake selectivity 355
and an average towing speed of 3.4 knots, an estimate of the minimum mesh size recommended for the fishery is 125 mm. However, at present, the use of 100 mm mesh and a 90-mm square mesh panel are mandatory (see Queirolo et al., 2008). For this reason, it is fundamental to evaluate and compare the whole selectivity of these codends for the fishery. These recommendations demonstrate ways in which the addition of the subsampling effect and the use of explanatory variables to model between-haul variation can allow fisheries scientists to improve selectivity estimates for Chilean hake.
ACKNOWLEDGEMENTS
We thank the Fondo de Investigación Pesquera (FIP) for authorising this reanalysis of the data and for facilitating access to the databases of the FIP 96-25 project. Special thanks to the Centro Andaluz de Ciencia y Tecnología Marinas (CACYTMAR) for logistical support and anonymous reviewers for their valuable comments. Dante Queirolo also thanks the Comisión Nacional de Investigación Científica y Tecnológica (CONICYT, Programa Becas Chile) for the fellowship awarded.
REFERENCES
Arana, P. 1970. Estudio sobre la selectividad de la merluza (Merluccius gayi gayi, G.) por las mallas de los artes de arrastre, en la zona de Valparaíso. Invest. Mar., Valparaíso, 1(1): 1-39.
Blady, W. & J. Zaucha. 2000. The selectivity of polyethylene codends with diamond meshes and selective windows in cod trawls. Medd. Havsfiskelab. Lysekil, 329: 66-73.
Breen, M., J. Dyson, F.G. O’Neill, E. Jones & M. Haigh. 2004. Swimming endurance of haddock (Melanogrammus aeglefinus L.) at prolonged and sustained swimming speeds, and its role in their capture by towed fishing gears. ICES J. Mar. Sci., 61: 1071-1079.
Campos, A. & P. Fonseca. 2003. Selectivity of diamond and square mesh codends for horse mackerel (Trachurus trachurus), European hake (Merluccius
merluccius) and axillary sea bream (Pagellus acarne)
in the shallow groundfish assemblage off the south-west coast of Portugal. Sci. Mar., 67: 249-260. Campos, A., P. Fonseca & V. Henriques. 2003a. Size
selectivity for four fish species of the deep groundfish assemblage off the Portuguese southwest coast: evidence of mesh size, mesh configuration and cod end catch effects. Fish. Res., 63: 213-233.
Campos, A., P. Fonseca & K. Erzini. 2003b. Size selectivity of diamond and square mesh cod ends for four by-catch species in the crustacean fishery off the Portuguese south coast. Fish. Res., 60: 79-97.
Dahm, E. 1998. Measurements of codend selectivity for North Sea saithe by the covered codend and divided trawl methods. Arch. Fish. Mar. Res., 46: 43-59. Dahm, E., H. Wienbeck, C.W. West, J.W. Valdemarsen
& F.G. O’Neill. 2002. On the influence of towing speed and gear size on the selective properties of bottom trawls. Fish. Res., 55: 103-119.
Deval, M.C., T. Bök, C. Ateş & H. Özbilgin. 2007. Size selectivity of three diamond mesh codends for the European hake (Merluccius merluccius) and the tub gurnard (Trigla lucerna) in the sea of Marmara, Turkey. J. Appl. Ichthyol., 23: 167-172.
Ehrhardt, N., R. Ercoli, J. García, J. Bartozzetti & A. Izzo. 1996. Influencia de la cantidad de captura en la selectividad de mallas diamante y cuadrada en redes de arrastre para la merluza común (Merluccius
hubbsi) e implicancias sobre el potencial de descarte.
Rev. Invest. Des. Pesq., 10: 31-43.
Erickson, D.L., J.A. Perez-Comas, E.K. Pikitch & J.R. Wallace. 1996. Effects of catch size and codend type on the escapement of walleye pollock (Theragra
chalcogramma) from pelagic trawls. Fish. Res., 28:
179-196.
Fonseca, P., A. Campos & R.B. Millar. 2007. Codend selection in the deep-water crustacean trawl fishery in Portuguese southern waters. Fish. Res., 85: 49-60. Fryer, R.J. 1991. A model of the between-haul variation
in selectivity. ICES J. Mar. Sci., 48: 281-290.
Fryer, R.J. & J.G. Shepherd. 1996. Models of codend size selection. J. Northwest Atlantic Fish. Sci., 19: 91-102.
Gálvez, M., H. Rebolledo & S. Lillo. 2000. Análisis de selectividad en la pesquería de merluza común en la zona centro sur. Informe Final, Proyecto FIP-IT/96-25: 100 pp.
Gálvez, M. & H. Rebolledo. 2005. Estimating codend size selectivity of bottom trawlnet in Chilean hake (Merluccius gayi gayi) fish. Invest. Mar., Valparaíso, 33(2): 151-165.
Graham, N., F.G. O’Neill, R.J. Fryer, R.D. Galbraith & A. Myklebust. 2004. Selectivity of a 120 mm diamond cod-end and the effect of inserting a rigid grid or a square mesh panel. Fish. Res., 67: 151-161. Grimaldo, E., R.B. Larsen & R. Holst. 2007. Exit
windows as an alternative selective system for the barents sea demersal fishery for cod and haddock. Fish. Res., 85: 295-305.
Latin American Journal of Aquatic Research 356
Grimaldo, E., M. Sistiaga & R.B. Larsen. 2008. Evaluation of codends with sorting grids, exit windows, and diamond meshes: size selection and fish behavior. Fish. Res., 91: 271-280.
Halliday, R.G. 2002. A comparison of size of Atlantic cod (Gadus morhua) and haddock (Melanogrammus
aeglefinus) by bottom longlines and otter trawls. Fish.
Res., 57: 63-73.
Halliday, R.G., C.G. Cooper, P. Fanning, W.M. Hickey & P. Gagnan. 1999. Size selection of Atlantic cod, haddock and pollock (saithe) by otter trawls with square and diamond mesh codends of 130-155 mm mesh size. Fish. Res., 41: 255-271.
He, P. 2007. Selectivity of large mesh trawl codends in the Gulf of Maine I. Comparison of square and diamond mesh. Fish. Res., 83: 44-59.
Herrmann, B. 2005. Effect of catch size and shape on the selectivity of diamond mesh cod-ends II. Theoretical study of haddock selection. Fish. Res., 71: 15-26. Hickey, W.M., G. Brothers & D.L. Boulos. 1993. A
study of selective fishing methods for the northern cod otter trawl fishery. Can. Tech. Rep. Fish. Aquat. Sci., 1934: 37 pp.
Huse, I., S. Løkkeborg & A.V. Soldal. 1996. Effects of fishing strategy on relative selectivity in trawls, longline and gillnets. ICES CM 1996/B23: 21 pp. Isaksen, B. & J.W. Valdemarsen. 1990. Codend with
short lastridge ropes to improve size selectivity in fish trawls. ICES CM 1990/B46: 8 pp.
Isaksen, B., S. Lisovsky & V.A. Sakhno. 1990. A comparison of the selectivity in codends used by the Soviet and Norwegian trawler fleet in the Barents Sea. ICES CM 1990/B51: 23 pp.
Jones, E.G., K. Summerbell & F.G. O’Neill. 2008. The influence of towing speed and fish density on the behaviour of haddock in a trawl cod-end. Fish. Res., 94: 166-174.
Lillo, S., V. Ojeda, J. Olivares, R. Tascheri, M. Braun, S. Núñez, J. Ortiz & P. Torres. 2001. Evaluación acústica de merluza común en la zona centro-sur, año 2000. Informe Final FIP-IT/2000-04: 126 pp.
Lillo, S., E. Molina, J. Saavedra, J. Olivares, E. Díaz, S. Núñez, E. Navarro, S. Vásquez, R. Alarcón, A. Sepúlveda, M. Braun & A. Saavedra. 2009. Evaluación hidroacústica de merluza común, año 2008. Informe Final FIP-IT/2008-14: 209 pp.
Lowry, N., L.H. Knudsen & D.A. Wileman. 1995. Selectivity in Baltic cod trawls with square mesh cod-end windows. ICES CM 1995/B5: 17 pp.
Lucchetti, A. 2008. Comparison of diamond- and square-mesh codends in the hake (Merluccius merluccius L.
1758) trawl fishery of the Adriatic Sea (central Mediterranean). Sci. Mar., 72: 451-460.
Madsen, N. 2007. Selectivity of fishing gears used in the Baltic Sea cod fishery. Rev. Fish Biol. Fish., 17: 517-544.
Madsen, N., T. Moth-Poulsen & N. Lowry. 1998. Selectivity experiments with codends fished in the Baltic Sea cod (Gadus morhua) fishery. Fish. Res., 36: 1-14.
Madsen, N., R. Holst & L. Foldager. 2002. Escape windows to improve the size selectivity in the Baltic cod trawl fishery. Fish. Res., 57: 223-235.
Millar, R.B. 1994. Sampling from trawl gears used in size selectivity experiments. ICES J. Mar. Sci., 51: 293-298.
Millar, R.B. & R.J. Fryer. 1999. Estimating the size-selection curves of towed gears, traps, nets and hooks. Rev. Fish Biol. Fish., 9: 1-28.
Netzel, J. & J. Zaucha. 1989. Investigation results of cod trawls codend selectivity. ICES CM 1989/B54: 9 pp. O’Neill, F.G. & R.J. Kynoch. 1996. The effect of cover
mesh size and codend catch size on codend selectivity. Fish. Res., 28: 291-303.
O’Neill, F.G., R.J. Kynoch & R.J. Fryer. 2006. Square mesh panels in North Sea demersal trawls: separate estimates of panel and cod-end selectivity. Fish. Res., 78: 333-341.
O’Neill, F.G., L.H. Knudsen, D.A. Wileman & S.J. McKay. 2005. Cod-end drag as a function of catch size and towing speed. Fish. Res., 72: 163-171. Queirolo, D., I. Montenegro, E. Gaete & G. Plaza. 2010.
Direct observation of Chilean hake (Merluccius gayi
gayi) behaviour in response to trawling in a south
central Chilean fishery. Fish. Res., 102: 327-329. Queirolo, D., T. Melo, C. Hurtado, I. Montenegro, E.
Gaete, J. Merino, V. Zamora & R. Escobar. 2008. Efecto del uso de paneles de escape de malla cuadrada sobre la reducción de peces juveniles en la pesquería de arrastre de merluza común (Merluccius
gayi gayi). Lat. Am. J. Aquat. Res., 36(1): 25-35.
Reeves, S.A., D.W. Armstrong, R.J. Fryer & K.A. Coull. 1992. The effects of mesh size, cod-end extension length and cod-end diameter on the selectivity of Scottish trawls and seines. ICES J. Mar. Sci., 49: 279-288.
Robertson, J.H.B. & P.A.M. Stewart. 1988. A comparison of size selection of haddock and whiting by square and diamond mesh codends. ICES J. Mar. Sci., 44: 148-161.
Rojo, A. & M. Silvosa. 1970. Selectividad de la red comercial de arrastre en la pesquería de la merluza argentina. Proy. Des. Pesq., Ser. Inf. Téc., 24: 37-48.
Subsampling and between-haul variation on chilean hake selectivity 357
Saetersdal, G. & L. Villegas. 1968. Informe sobre experimentos de selectividad de merluza con redes de arrastre. Bol. Inst. Fom. Pesq., 9: 1-16.
Sakhno, V.A. & M.K. Sadokhin. 1982. On experimental studies of trawl codend selectivity. ICES CM 1982/B6: 21 pp.
Sala, A. & A. Lucchetti. 2010. The effect of mesh configuration and codend circumference on selectivity in the Mediterranean trawl Nephrops fishery. Fish. Res., 103: 63-72.
Salazar, C., R. Guevara-Carrasco, A. Gonzales & J. Calderón. 1996. Selectividad de las artes de pesca de la flota arrastre comercial 1996. Inf. Inst. Mar del Perú, 120: 7-11.
Sangster, G.I. & K.M. Lehmann. 1994. Commercial fishing experiments to assess the scale damage and survival of haddock and whiting after escape from four sizes of diamond mesh codends. ICES CM 1994/B38: 26 pp.
Smolowitz, R.J. 1983. Mesh size and the New England groundfishery-applications and implications. NOAA Tech. Rep. NMFS SSRF-771: 22 pp.
Subsecretaría de Pesca (SUBPESCA). 2010. Cuota global anual de captura de merluza común (Merluccius gayi gayi), año 2011. Inf. Téc. (R. Pesq.), 124/2010: 56 pp.
Suuronen, P. 2005. Mortality of fish escaping trawl gears. FAO Fish. Tech. Pap., 478: 72 pp.
Received: 17 May 2011; Accepted: 23 May 2012
Tschernij, V. & R. Holst. 1999. Evidence of factors at vessel-level affecting codend selectivity in Baltic cod demersal fishery. ICES CM 1999/R02: 12 pp.
Tschernij, V., P.O. Larsson, P. Suuronen & R. Holst. 1996. Swedish trials in the baltic Sea to improve selectivity in demersal trawls. ICES CM 1996/B25: 16 pp.
Tokaç, A., H. Özbilgin & H. Kaykaç. 2010. Selectivity of conventional and alternative codend design for five fish species in the Aegean Sea. J. Appl. Ichthyol., 26: 403-409.
Verazay, G., G. Arena, M. Simonazzi, W. Ubal, H. Cordo, H. Nion, D. Hernández & M. Rey. 1992. Selectividad en la merluza (Merluccius hubbsi) en la zona común de pesca. CTMFM-Series Circulares, 3: 14-25.
Wienbeck, H. & E. Dahm. 2000. New ways for an improvement of the selectivity of trawl codends in the Baltic cod fishery. Medd. Havsfiskelab. Lysekil, 329: 80-93.
Wileman, D.A., R.S.T. Ferro, R. Fonteyne & R.B. Millar. 1996. Manual of methods of measuring the selectivity of towed fishing gears. ICES Coop. Res., 215: 126 pp.