UNIVERSIDADE DE BRASÍLIA (UNB) INSTITUTO DE GEOCIÊNCIAS (IG) PÓS-GRADUAÇÃO EM GEOLOGIA
Daniela Schievano de Campos
CARACTERIZAÇÃO DOS ALVOS CASCAVEL E TINTEIRO,
GREENSTONE BELT DE FAINA, GO: IMPLICAÇÕES NA
IDENTIFICAÇÃO DE NOVOS ALVOS POTENCIAIS PARA EXPLORAÇÃO
MINERAL
DISSERTAÇÃO DE MESTRADO n° 351
Brasília – DF 2015
UNIVERSIDADE DE BRASÍLIA (UNB) INSTITUTO DE GEOCIÊNCIAS (IG) PÓS-GRADUAÇÃO EM GEOLOGIA
Daniela Schievano de Campos
CARACTERIZAÇÃO DOS ALVOS CASCAVEL E TINTEIRO,
GREENSTONE BELT DE FAINA, GO: IMPLICAÇÕES NA
IDENTIFICAÇÃO DE NOVOS ALVOS POTENCIAIS PARA EXPLORAÇÃO
MINERAL
Orientadora: Prof. Dra. Adalene Moreira Silva (UnB) Co-Orientadora: Prof. Dra. Catarina Labouré Bemfica Toledo (UnB)
Dissertação de Mestrado apresentado à Banca Examinadora do Instituto de Geociências da Universidade de Brasília, como exigência para obtenção do título de mestre em Geologia.
UNIVERSIDADE DE BRASÍLIA Instituto de Geociências
CARACTERIZAÇÃO DOS ALVOS CASCAVEL E TINTEIRO,
GREENSTONE BELT DE FAINA, GO: IMPLICAÇÕES NA
IDENTIFICAÇÃO DE NOVOS ALVOS POTENCIAIS PARA EXPLORAÇÃO
MINERAL
Daniela Schievano de Campos
BANCA EXAMINADORA
Prof. Dra. Adalene Moreira Silva (UnB) Presidente
Prof. Dr. Jaime Estevão Scandolara Membro Externo
Prof. Dr. Augusto C.B. Pires Membro Interno
Aos meus queridos pais, João e Márcia, e ao Ricardo Lívio, pelo carinho e paciência, meu eterno agradecimento!
i Agradecimentos
A realização deste trabalho só foi possível graças à colaboração e à amizade de pessoas muito especiais às quais gostaria de expressar meus sinceros agradecimentos.
Primeiramente agradeço a Deus por sempre estar presente em todos os momentos. Aos meus queridos pais, João e Márcia, pelo apoio e pelo amor incondicional.
Ao meu noivo, Ricardo Lívio, pela paciência e por todas as dicas e discussões geológicas. Sem você eu não teria ido tão longe...
Às professoras Adalene Moreira Silva e Catarina L. B. Toledo, por toda orientação, incentivo, amizade e por contribuírem para minha formação acadêmica e profissional.
A Orinoco do Brasil Mineração Ltda., por todo suporte e pela liberação dos dados utilizados neste trabalho, em especial a toda equipe do projeto Curral de Pedras. Aos geólogos Marcelo Juliano de Carvalho, Vinícius Gomes Rodrigues, Kawinã Araujo e Tiago Vaz Andrade. Ao Cícero (o Cicínho), pela companhia e apoio durante a segunda etapa de campo. Ao querido Tião e sua esposa Luíza, pela amizade e hospitalidade. A equipe: Marcílio, Lukinha, Fabinho, Nenê e Tinteiro, por todo auxílio prestado.
Ao seu Elídio César Neto, morador de Faina e fiel companheiro durante a primeira etapa de campo.
A toda equipe do Laboratório de Microssonda Eletrônica do Instituto de Geociências da UnB: ao professor Nilson Francisquini Botelho, Jacqueline Menez, Federico Alberto Cuadros, Ricardo Lívio Santos Marques e Íris Dias Santos, pelo apoio, análises e por sempre me receberem tão bem!
Aos queridos Maria Clara e Alberto, pelo suporte, paciência e carinho recebidos durante toda minha estadia em Brasília.
Aos professores Tati de Almeida e Hardy Jost, e aos alunos Túlio Marques Soares, Hugo Vidal, Eduardo Mansur e Gabriella Fazzio. Aos funcionários da UnB: Rogério, Abel, Alice, Stela e Dione.
ii SUMÁRIO RESUMO...vi ABSTRACT...vii I. INTRODUÇÃO ...1 1.1 -APRESENTAÇÃO...2 1.2 - OBJETIVOS... ...4
1.3 - LOCALIZAÇÃO E ACESSO À ÁREA... ...5
1.4 - MATERIAIS E MÉTODOS...6
1.4.1 – Materiais...6
1.4.1.1 – Dados Cartográficos...6
1.4.1.2 – Dados aerogeofísicos no Greenstone Belt de Faina...7
1.4.1.3 – Imagem de satélite...7 1.4.1.4 – Testemunhos de sondagem...7 1.4.1.5 – Petrografia...8 1.4.1.6 – Geoquímica...8 1.4.2. – Métodos de Trabalho...8 1.4.2.1 – Pesquisa Bibliográfica...9
1.4.2.2 – Processamento e interpretação dos dados aerogeofísicos de alta resolução...9
1.4.2.3 – Processamento de dados geoquímicos...9
1.4.2.4 – Coleta das propriedades físicas de rocha...9
1.4.2.5 – Mapeamento geológico...10
1.4.2.6 – Estudos petrográficos...10
1.4.2.7 – Microssonda Eletrônica...10
1.4.2.8 – Integração de dados em um mapa prospectivo...10
1.5 - ESTRUTURA DA DISSERTAÇÃO... ...11
II. ARTIGO...12
ABSTRACT...13
1. Introduction...14
2. Geologic Context and Mineralization in the Faina Greenstone Belt...16
2.1. Regional Geology...16
2.2. Faina and Serra de Santa Rita Greenstone Belts...17
2.3. Mineralization...20
3. Airborne Geophysical Data and Other Multi-Source Data...22
4. Data Processing and Interpretation...23
4.1. Geophysical Data...23
4.1.1. Aeromagnetic Data...24
4.1.2. Gama Spectrometry Data ...25
4.1.3. Interpretation of Aeromagnetic Data...27
4.1.4. Interpretation of Gamma Spectrometry Data...29
4.2. Geologic Data...29
4.3. Petrography and Electronic Microprobe Analysis...30
iii
4.5. Geochemical Data...30
5. Polymetallic and Gold Mineralizations in the Faina Greenstone Belt...32
5.1. Cascavel Target...32
5.1.1. Lithological and Structural Controls... ...32
5.1.2. Hydrothermal Alteration Zones...33
5.1.3. Physical Properties of Rocks...37
5.1.4. Geochemistry...40
5.1.5. Mineral Exploration Vectors...42
5.2. TinteiroTarget...42
5.2.1. Lithological and Structural Controls ...42
5.2.2. Hydrothermal Alteration Zones...44
5.2.3. Rock Physical Properties...47
5.2.4. Geochemistry...48
5.2.5. Mineral Exploration Vectors...49
6. Data Integration in Prospectivity Maps – Selecting New Target sites...49
6.1. Cascavel Target...51
6.2. Tinteiro Target...52
7. Validation and Evaluation of the Best Predictors...56
8. Discussion and Conclusions...60
9. Acknowledgments...61
10. References...61
III. DISCUSSÕES E CONSIDERAÇÕES FINAIS...65
IV. REFERÊNCIAS...68
LISTA DE FIGURAS I. INTRODUÇÃO Fig. 1. Fluxograma descritivo das principais etapas envolvidas no modelo de exploração mineral. Este diagrama é baseado na metodologia proposta por Pan & Harris (2000), Harris & Sanborn-Barrie (2006) e modificado de Nykänen (2008) e Costa e Silva et al. (2013)...4
Fig.2. Localização da área de estudo e vias de acesso (parte dos dados foi extraído da base de dados base map)...6
II. ARTIGO Fig.1. Flowchart representing the main steps of the mineral exploration model. This diagram is based in the method suggested by Pan and Harris (2000) and Harris and Sanborn-Barrie (2006) and adapted from Nykänen (2008) and Costa and Silva et al. (2012). ...15
Fig.2. Simplified geologic map of the Archean-Paleoproterozoic Terrane in Goiás (Pimentel et al., 2000)...17
Fig.3. Regional geologic map of the Faina Greenstone Belt produced by Toledo et al. (2014). The black polygon indicates the study area mapped at the 1:10,000 scale, which is shown in Fig.8...19
Fig.4. RGB (453) image obtained from the Landsat 7 ETM+ sensor partially covering the Faina Greenstone Belt, Sertão Mining locations and the target sites Cascavel, North Tinteiro, Central Tinteiro, Southeast Tinteiro and South Tinteiro (yellow polygons)...21
Fig. 5. Main aeromagnetic products: a) TMI, b) ASA, c) Dx, d) Dy and and) Dz. The black outline indicates the main sites analyzed in this study: A – Cascavel, B – North Tinteiro, C – Central Tinteiro, D – Southeast Tinteiro and E – South Tinteiro...25
Fig. 6. K (%), eU (ppm) and eTh (ppm) concentrations used to identify the hydrothermal alteration zones, and the RGB image, which is essential for the geologic mapping and shows the Cascavel and Tinteiro target sites...27
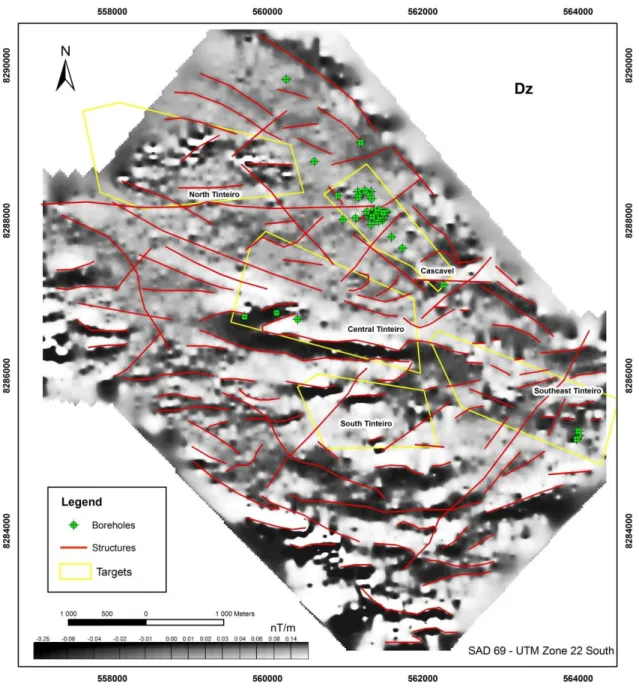
iv Fig. 7. Map showing the first vertical derivative (Dz) of the anomalous magnetic field in the study area and identifying the main geologic structures interpreted based on the Dz, Dy, and RGB 453 image of the Landsat 7 ETM+ sensor. The boreholes conducted by the Orinoco do Brasil Mineração Ltd. are indicated by the green marker...28 Fig. 8. Geologic map of the study area at the 1:10,000 scale covering the Cascavel and Tinteiro target sites; the map was produced by integrating the geologic map created by Toledo et al. (2014) at the 1:25,000 scale, the geologic map created by Orinoco do Brasil Mineração Ltd. and data obtained in this study, and it shows the boundaries of the hydrothermal alteration halos...31 Fig. 9. Main rocks found in Cascavel: a) quartzite; b) feldspathic quartzite; c) weathered metapelite; and d) intercalated carbonaceous schists in metarhythmite packages...32 Fig. 10. . Photos of the Cascavel site gallery: a) fine pinkish quartz vein (marked in yellow) from 10 to 50 cm thick and hosted in quartzite with green muscovite; b), c) and d) spots of free gold in the quartz vein or at the contact of the vein with the host rock. Photos: Orinoco do Brasil Mineração Ltd...34 Fig. 11. A. Description of the borehole CDP-04 showing mineralized layers. Photomicrography: a) S-C foliation marked by muscovite in quartz-muscovite schist; and b) deformed potassium feldspar, showing pressure shadows filled with biotite. The muscovite is older than the biotite. B. Description of the borehole CDP-09 showing mineralized layers. Photomicrography: c) hydrothermal muscovite (1) formed from biotite (2); d) feldspathic quartzite with muscovite; and e) late euhedral pyrite. Note: Bt – biotite, KF – potassium feldspar, Musc – muscovite, Qz – quartz, Py – pyrite, Chl – chlorite...36 Fig. 12. Representation of the hydrothermal alteration halos in the Cascavel site; the inner halo is represented by the mineralized zone and the external halo by distal zone 2...37 Fig. 13. Magnetic susceptibility measurements (*10-3 SI) obtained for boreholes CDP-04 and CDP-09. Layers with high magnetic susceptibility values are associated with metapelites, meta-ultramafics and carbonaceous schists. Layers with biotite mineralization layers, such as at 113 m in CDP-04 and at 221 m in CDP-09, represent magnetic susceptibility peak values...38 Fig. 14. Measurements of the radioelements K, U and Th and the Fk factor (in cpm, counts per minute) in the boreholes CDP-04 and CDP-09. Mineralized layers show peak values of radioelement K, which was highlighted by the Fk factor...39 Fig. 15. Distribution of the elements Au, Cu, Zn, Ni, Co, Cr, Pb and W (in ppm) along the boreholes CDP-04 and CDP-09, and possible correlations (red circles)...41 Fig. 16. Photos of the rocks found in Tinteiro: a) quartzite with muscovite is massive and gray; b) quartz-muscovite schist is weathered and folded; c) quartz-chlorite-quartz-muscovite schist is greenish; d) massive metachert is formed mainly by quartz; and e) finely laminated metachert shows bands rich in quartz alternated with bands rich in muscovite and biotite...43 Fig. 17. a) Hydrothermal alteration characteristic of the Tinteiro site, which shows solid portions of goethite/hematite in metachert, consisting of hematite breccia; b) hematite breccia is highly weathered and contains green muscovite; c) photomicrography of the metallic gray cement of the hematite breccia (Musc – muscovite; Ox – oxides, such as goethite and hematite); d) detail of the breccia formed by irregular fragments of metachert cemented by metallic bluish gray material; e) and f) backscatter images of the manganiferous breccia cement showing that e) 1, 2 and 3 are hollandite (lighter) and 4, 5 and 6 are lithiophorite (darker); and f) 1 is hollandite, 2, 3 and 4 are lithiophorite, and 5 and 6 are muscovite...45 Fig. 18. Chemical analyses of the borehole TIN-1A, highlighting the layer intercepting the manganiferous breccia and showing anomalous concentrations of Ag, Ba, Pb and V in addition to Co, Cu, Mn, Ni, Zn and Li, which occur in the lithiophorite structure...47 Fig. 19. Steps of the fuzzy logic method in the development of the mineral exploration model. Modified from Nykänen et al. (2008)...50 Fig. 20. Flowchart representing the steps of the fuzzy logic method and the resulting prospectivity map for Cascavel. The largest region showing high favorability coincides with the Cascavel deposit...52 Fig. 21. Flowchart representing the elements, fuzzy membership function and fuzzy operators, and the prospectivity maps produced for a) North Tinteiro and b) Central Tinteiro, which contains cobalt...54 Fig. 22. Flowchart representing the elements, fuzzy membership function and fuzzy operators, and the prospectivity maps produced for a) Southeast Tinteiro and b) South Tinteiro, which both contain silver...55
v Fig. 23. Prospectivity map for the Cascavel site integrated with the soil grid, mineralized quartz veins associated with the Cascavel deposit, and the main lineaments identified from aeromagnetic images. The soil grid refinement over the area showing the highest favorability indicates an anomalous concentration of gold in this region. The concentration of the radioelement K (%) indicates that the region of highest favorability is
associated with high K concentration...57
Fig. 24. Prospectivity map for the Tinteiro site: a) North Tinteiro and b) Central Tinteiro. The integration of the prospectivity maps with the results from the chemical analyses on the rock and soil samples and the cores validated certain high-favorability zones. These zones are intersected by lineaments and associated with high magnetic amplitudes...58
Fig. 25. Prospectivity map for the Tinteiro site: a) Southeast Tinteiro and b) South Tinteiro. The integration of the prospectivity maps with the results from the chemical analyses on the rock and soil samples and cores validate some high-favorability zones. These zones are intersected by lineaments and are associated with high magnetic amplitudes...59
LISTA DE TABELAS Table 1. Rock samples from the Cascavel site gallery...34
Table 2. Paragenesis of the hydrothermal alteration halo in Cascavel...37
Table 3. Main mineral exploration vectors identified for the Cascavel target site...42
Table 4. Paragenesis of the hydrothermal alteration halos in Tinteiro prospect...47
Table 5. Statistical values of the magnetic susceptibility in the samples from Tinteiro; M: Mean, S.D.: standard deviation...48
Table 6. Main mineral exploration vectors identified in the Tinteiro target site...49
Table 7. Fuzzy operators described by An et al. (1991) and Bonham-Carter (1994)...50
vi RESUMO
Esta dissertação de mestrado aborda o estudo da favorabilidade mineral através da caracterização de dois alvos localizados no Greenstone Belt de Faina, conhecidos como Cascavel e Tinteiro, localizados no Terreno Arqueano-Paleoproterozóico de Goiás, através do processamento, interpretação, integração e análise espacial de dados aerogeofísicos de alta resolução, geoquímicos e geológicos. O objetivo do trabalho é analisar o acervo de dados de alta resolução para definir a assinatura metalogenética dos alvos Cascavel e Tinteiro e indicar novos alvos potenciais na região de estudo.
Dados geológicos mostram que a mineralização no alvo Cascavel ocorre em dois sistemas de veios de quartzo superpostos, denominados de Mestre-Cascavel e Cuca, encaixados em quartzitos e com
espessura média de 50 cm e orientação N45o-60oW/25°SW com a presença de ouro livre em grãos
de 2-3 mm até 3 cm. O alvo Tinteiro, derivado de estudos realizados pela empresa Orinoco do Brasil Mineração Ltda., mostra uma mineralização polimetálica de ouro e cobre de alto teor, cobalto, bário, prata, urânio e ferro. Dados anteriores e derivados desse trabalho mostram que esse sistema mineralizante é posterior ao do alvo Cascavel, ocorrem em estruturas rúpteis de direção NE e assemelham-se a um sistema do tipo IOCG.
A análise dos dados aerogeofísicos de alta resolução, de sensores remotos, geoquímicos e de sondagem, associados a dados geológicos obtidos em campo, permitiram estabelecer vetores exploratórios que guiaram as análises espaciais para seleção de alvos potenciais para exploração mineral na região. Ou seja, permitiu a identificação de feições magnéticas e estruturas em imagens ETM+/Landsat-7 chaves sob o ponto de vista prospectivo. Da mesma forma, a análise de dados gamaespectrométricos permitiu individualizar assinaturas das rochas hospedeiras e encaixantes, bem como as associadas com alteração hidrotermal potássica, sulfetação e silicificação através do mapeamento da variação sutil de valores de K, eTh e eU.
A caracterização dos alvos foi refinada com descrições petrográficas e análises em microssonda eletrônica em diferentes rochas e nas zonas mineralizadas, permitiu a comparação dos principais halos de alteração hidrotermal mapeados com dados aerogeofísicos e trabalhos de campo. Medidas de propriedades físicas de rocha (susceptibilidade magnética e variação dos radioelementos K, eU e eTh) foram realizadas em amostras de rocha de afloramento e de furos de sonda para validar e correlacionar os resultados anteriormente obtidos com a aerogeofísica.
Mapas da favorabilidade mineral para a seleção de áreas potenciais para ouro no Cascavel e Cu-Au no Prospecto Tinteiro foram produzidos por meio da aplicação da lógica Fuzzy. As camadas evidenciais utilizadas equivalem a produtos derivados de dados aerogeofísicos, geoquímicos, geológicos e estruturas interpretadas nas áreas de interesse.
Este estudo apresenta modelos prospectivos para mineralização de ouro tipo Cascavel e Cu-Au tipo Tinteiro baseado na integração de dados multi-fonte utilizando a lógica fuzzy com o objetivo de definir alvos potenciais. Um total de 23 novos alvos potenciais foram identificados no terreno granito-greenstone Faina, sendo que essa técnica também confirmou com sucesso várias ocorrências já conhecidas. Para o alvo Cascavel se destacam quatro alvos de primeira prioridade e novos focos com favorabilidade média, enquanto que para o prospecto Tinteiro foram mapeados 19 áreas alvos para serem testadas em trabalhos de follow up.
vii ABSTRACT
This master dissertation comprises a study about mineral favorability study through the characterization of two targets hosted at the Faina Greenstone Belt. These are known as Cascavel and Tinteiro targets, situated inside the Archean-Paleoproterozoic Terrain in Goiás state. The methodology covers processing, interpretation, integration and spatial analysis of high-resolution geophysical data, geochemistry, structural and geological mapping information. The main goal include the analysis of high-resolution data collection in order to map the Cascavel and Tinteiro targets signature, and use it to predict new targets according to the potential indicated for this study area.
The geological data setting show the mineralization at Cascavel target occurring in two overlapping quartz veins systems, called Mestre-Cascavel and Cuca, embedded in quartzite rocks with the average thickness of 50 cm and oriented N45°-60°W/25SW. The mineralization is characterized by
free coarse gold in grains of 2 mm to 3 cm. The Tinteiro target came from the prospecting works
conducted by Orinoco do Brasil Mineração Ltd., it shows a polymetallic mineralization with gold and copper in high content, cobalt, barium, silver, uranium and iron in secondary grade. Previous information from this study shows that the mineralizing system is posterior to Cascavel target, it occur in brittle structures of NE and resemble a IOCG system.
Analysis of the derived products from high-resolution geophysics, remote sensing, geochemical and drill hole data associated with the field geology allowed to establish exploratory vectors. Those vectors have guided spatial analysis for selecting potential targets for mineral exploration follow up in the Greenstone Belt. It allowed the identification of keys features from the magnetic geophysical grid and structures interpreted from the Landsat 7 ETM+ sensor image, and put it under the prospective point of view. Analysis of gamma spectrometric data allowed the individualization of host and country rocks signatures, as well as those associated with potassic hydrothermal alteration, sulphidation and silicification by mapping the subtle variation of K, eU and eTh.
The target characterization was refined with petrographic description and electron microprobe analysis for different rocks at mineralized zones. The analyses allowed the mineral chemistry identification and the recognition of major hydrothermal alteration halos, previously mapped with geophysical data at the field work. Measurements of the physical rock properties (magnetic susceptibility and radioelement (K, eU and eTh) variability) were performed on the chip samples and boreholes samples to confirm, validate, correlate and investigate previous results obtained from airborne geophysics.
Prospective maps were produced by the selection of potential areas for gold in Cascavel and Cu-Au rich in the Tinteiro Prospect were produced through the application of fuzzy logic. The evidential layers used are equivalent to products derived from geophysical, geochemical, geological and interpreted structures at the interest areas.
This study shows prospective models for gold mineralization Cascavel-type and Cu-Au Tinteiro-type, based on the integration of multi-source data using fuzzy logic and generation of spatial models for selection of potential new targets. A total of 23 new potential targets were identified within the Faina granite-greenstone terrain, and this technique also successfully identified several already known occurrences. For Cascavel target presents four targets first-order favorability and new medium-favorability foci, while for the Tinteiro prospect were mapped 19 areas to be tested in follow up studies.
1
I. INTRODUÇÃO
2 1. INTRODUÇÃO
1.1– APRESENTAÇÃO
As empresas de mineração visam em um cenário global a utilização de metodologias eficientes, que possibilitem a redução de custos durante as etapas de exploração mineral. Para isso, necessitam de técnicas que agreguem de forma mais eficiente todos os dados gerados nas diferentes etapas de pesquisa, focando em modelos que tenham a melhor chance de gerar depósitos (Robert et al., 2007).
Os terrenos Arqueanos constituem as províncias minerais com maior potencial prospectivo. Dentre eles, destacam-se os terrenos do tipo greenstone, hospedeiros de mineralizações diversas que formam, muitas vezes, importantes depósitos. A principal mineralização hospedada em greenstone belts é a aurífera, representada por grandes depósitos de ouro presentes em todos os continentes (Robert et al., 2007). Porém, esses terrenos podem ser hospedeiros de outras mineralizações, tais como cobre, chumbo, níquel, ferro, zinco, cromo e prata. Destaca-se, o greenstone belt de Abitibi, Canadá, detentor da maior província VMS (Sulfetos Maciços Vulcanogênicos) (Mercier-Langervin et al., 2007; Allen et al., 2002), e o greenstone belt de Agnew-Wiluna, Austrália, que possui o principal depósito de níquel em komatiitos (Fiorentini et al., 2012). O período de maior incidência dessas mineralizações ocorre no Arqueano, entre 3.8 e 2.6 G.a., sobrevindo um declínio após esta data (Cawood &Hawkesworth, 2015; Groves et al., 2005; Goldfarb et al., 2001).
No Brasil, as minas de classe mundial em Greenstone Belt arqueanos estão localizadas no Quadrilátero Ferrífero e no Bloco Arqueano-Paleoproterozóico de Goiás, onde está inserida a área de trabalho. O greenstone belt de Faina, alvo deste estudo, juntamente com as faixas de Pilar de Goiás, Guarinos, Crixás e Serra de Santa Rita compreendem os terrenos graníticos-greenstone, inseridos no Terreno Arqueano-Paleoproterozóico de Goiás, situado na porção setentrional da Faixa Brasília (Pimentel et al., 2004, Jost et al., 2013). O Greenstone Belt de Faina representa a sequencia vulcano-sedimentar menos estudada em relação aos demais greenstone belts.
A área estudada recobre grande parte do terreno granito-greenstone da região de Faina e pertence ao Bloco Arqueano-Paleoproterozóico de Goiás. A região é conhecida desde a época dos Bandeirantes, no século XVIII, e mostra potencial para hospedar mineralizações de ouro. Várias empresas atuaram na área, onde se destacam a Metais de Goiás S.A. – METAGO, a Western Mining Co, a Amazônia Mineração e a Troy Resources Brazil.
A descoberta de Sertão, uma mina de ouro de baixo volume e alto teor, impactou positivamente a economia local e as cidades de Faina e Goiás. Ela foi explorada de 2000 a 2007 pela Sertão Mineração Ltda., que encerrou as suas atividades tendo explotado o minério oxidado até a profundidade de 40m. A empresa reportou que extraiu mais de 250 mil onças de ouro com um
3 teor médio 24.95g/t. A partir de 2011, a região tem sido estudada pelas empresas Yamana Gold Inc. e Orinoco do Brasil Mineração Ltda.
A Orinoco do Brasil Mineração Ltda. Se destaca pelos investimentos no GreenstoneBelt de Faina, com um programa de exploração arrojado em alvos conhecidos como Cascavel e, posteriormente, nas novas descobertas denominadas de Tinteiro e Eliseu. Os novos alvos indicam uma potencialidade para ouro e mineralizações polimetálicas na região em apreço e são apresentados no mapa da figura 4.
Cabe ressaltar que por volta de 1980 entrou em operação uma mina no greenstone belt de Crixás dentro do Bloco Arqueano-Paleoproterozoico que impulsionou novas pesquisas em toda a região e que representa o maior depósito do tipo gold-only da Faixa Brasília (Jost et al., 2014). Em 2003, a Sertão Mineração Ltda. caracterizou um depósito aurífero de baixo volume e alto teor na porção sul do greenstone belt de Faina. A Orinoco do Brasil Mineração Ltda., empresa que atua na área desde 2012, através de métodos geoquímicos e geofísicos, fez descobertas instigantes de prata na área.
Para o estudo da mineralização do greenstone belt de Faina, a partir do detalhamento de alguns alvos pré-selecionados (Cascavel e Tinteiro), utilizou-se uma metodologia baseada no processamento e interpretação de dados aeromagnéticos, gamaespectométricos, geoquímicos e geológicos para, posteriormente, integrá-los dentro de modelos de favorabilidade mineral utilizando a lógica fuzzy. Para isso, utilizou-se o software ESRI ArcSDM Inc. (versão 9.3), seguindo o modelo de exploração proposto por Pan & Harris (2000) e Harris & Sanborn-Barrie (2006) e modificado de Nykänen (2008) e Costa e Silva et al. (2013) (Figura 1).
A lógica fuzzy tem-se mostrado uma ferramenta muito eficiente na busca de novos alvos e por isso tem sido amplamente utilizada em projetos de pesquisa mineral de várias formas e em diferentes escalas (Nykänen et al., 2008), pois trata-se de uma abordagem baseada no conhecimento de especialistas permitindo que descrições semânticas sejam convertidas em um modelo espacial numérico que prevê a localização de algo de interesse (Raines et al., 2010). O uso deste método na área de pesquisa irá refletir em zonas que apresentam assinaturas geofísicas, geoquímicas e geológicas semelhantes, indicativas de possíveis potenciais para mineralização.
A principal meta deste trabalho é apresentar cenários prospectivos no Greenstone Belt de Faina através da integração de dados geológicos, geofísicos de alta resolução, geoquímicos e de sondagem exploratória.
4
Fig. 1. Fluxograma descritivo das principais etapas envolvidas no modelo de exploração mineral. Este diagrama é baseado na metodologia proposta por Pan & Harris (2000), Harris & Sanborn-Barrie (2006) e modificado de Nykänen (2008) e Costa e Silva et al. (2013).
1.2 - OBJETIVOS
O objetivo desta dissertação de mestrado consiste na utilização de técnicas de processamento e integração de dados multifonte aplicados à caracterização dos alvos Cascavel e Tinteiro no
5 Greenstone Belt de Faina. Ao final, pretende-se apontar novos alvos potenciais na região em apreço, por meio da análise espacial utilizando lógica fuzzy.
Os objetivos específicos incluem:
o cartografar estruturas regionais e locais com o intuito de definir zonas com potencial metalogenético através da investigação qualitativa de dados aeromagnetométricos e de imagens do sensor ETM+/Landsat 7;
o caracterizar a assinatura gamaespectrométrica das principais rochas dos alvos Cascavel e Tinteiro, bem como mapear as variações do teor de radiolementos que indiquem zonas de alteração hidrotermal;
o caracterizar petrograficamente os halos de alteração hidrotermal mapeados através dos dados gamaespectrométricos e em trabalho de campo para refinar os vetores indicados pela gamaespectrometria;
o caracterização química dos alvos utilizando processamento de dados geoquímicos em amostras de rocha, solo e furos de sondagem e geração de produtos derivados para análise espacial;
o coleta de dados de propriedade físicas de rocha com o intuito de refinar a interpretação dos dados aerogeofísicos;
o gerar mapas de favorabilidade mineral através da aplicação da lógica fuzzy a partir dos produtos derivados dos dados multi-fonte para os alvos Cascavel e Tinteiro, com intuito de apontar novos alvos potenciais para exploração mineral.
1.3 - LOCALIZAÇÃO E ACESSO A ÁREA
A área de estudo possui extensão aproximada de 48 km². Localiza-se na região noroeste do estado de Goiás, distando 46 km de Itapuranga (a maior cidade da região), 67 km de Goiás Velho e 211 km de Goiânia. O acesso à área é feito a partir de estrada não pavimentada que liga o município de Faina ao município de Lua Nova, ou a partir da GO-230 com acesso pela GO-164, no sentido de Lua Nova (Fig. 2).
6 Fig. 2. Localização da área de estudo e vias de acesso (parte dos dados foi extraído da base de dados base map).
1.4 – MATERIAIS E MÉTODOS
Para a elaboração deste trabalho, fez-se necessário a utilização de materiais multifontes e de metodologias diversas, que serão descritas a seguir.
1.4.1 - Materiais
Os materiais utilizados nesta dissertação de mestrado incluem: dados cartográficos, aerogeofísica de alta definição, imagem de sensores remotos, lâminas delgadas polidas, furos de sonda e geoquímica em rocha de testemunhos de sondagem, amostras de rocha de afloramento e solo.
1.4.1.1 – Dados Cartográficos
As bases cartográficas utilizadas neste trabalho foram as cartas geológicas de Goiás (SD-22-Z-C-V), Morro Agudo de Goiás (SD-22-Z-C-II) e Araguapás (SD-22-Z-C-I), na escala 1:100.000, confeccionadas pela CPRM (Baêta Jr, 2000); mapas geológicos cedidos pela Orinoco do Brasil
7 Mineração Ltda. na escala 1:25.000, abrangendo a área dos alvos na escala 1:10.000; mapa geológico regional que recobre o Greenstone Belt de Faina e parte do Greenstone Belt Serra de Santa Rita em escala 1:25.000 de Toledo et al. (2014). Os dados destes mapas foram agregados a novos dados de campo para confecção de um mapa geológico integrado.
1.4.1.2 – Dados aerogeofísicos no Greenstone Belt de Faina
Os dados aeromagnetométricos e gamaespectrométricos de alta resolução, cedidos pela Orinoco Brasil Mineração Ltda., foram executados pela empresa Lasa Prospecções S.A. entre os dias 10 e 14 de agosto de 2013. A altura de voo foi fixada em 50 metros sobre o terreno, com linhas de voo espaçadas de 200 metros, direção NS, e linhas de controle espaçadas de 1000 metros, com direção EW, recobrindo uma área de 1.562,38 km². Para este levantamento foi utilizado um helicóptero Esquilo AS-350BA. Uma área de detalhe foi recoberta com espaçamento de linhas de voo de 100 m e linhas de controle de 500 m, sobre os alvos Cascavel e Tinteiro, atingindo uma área de aproximadamente 48 km².
1.4.1.3 – Imagem de sensores remotos
Foi utilizada imagem de sensores remotos para o reconhecimento e interpretação de estruturas geológicas de primeira, segunda e terceira ordens. Inicialmente a interpretação de estruturas e domínios geológicos foi realizada sobre imagem do satélite Landsat 7, sensor Enhanced Thematic Mapper Plus (ETM+), orbita/ponto 223/071, de 08/05/2010; obtida via download grátis no site da USGS - United the States Geological Survey. Para a interpretação utilizou-se a composição colorida RGB com as bandas 4, 5 e 3 respectivamente. Esta composição colorida foi “fundida” com a banda pancromática (banda 8) via algoritmo de componentes principais objetivando unir a melhor resolução espacial da banda 8 com as informações multiespectrais das demais bandas. Foram interpretadas estruturas lineares de relevo e drenagem (lineamentos) da imagem e a estas atribuídas significado geológico conforme informações de campo associadas com a experiência do foto-intérprete.
1.4.1.4 – Testemunhos de sondagem
Foi disponibilizada uma base de 50 furos de sonda, com descrição geológica prévia e resultados geoquímicos, pertencentes aos alvos Cascavel e Tinteiro. Destes, foram selecionados dois furos do alvo Cascavel, por terem interceptados intervalos mineralizados, e cinco furos do alvo Tinteiro. Alguns destes furos foram descritos e amostrados para este trabalho, o que permitiu a realização de análise petrográfica e medidas de propriedades físicas de rochas, tais como susceptibilidade magnética, utilizando o equipamento MPP-EM2S+ (Multi Parameter Probe),
8 desenvolvido pela INSTRUMENTATION GDD INC., e gamaespectrometria a partir do aparelho BGO-SUPER-SPEC RS 230, disponibilizados pelo Instituto de Geociências da Universidade de Brasília (UnB).
1.4.1.5 – Petrografia
Foram confeccionadas 93 seções polidas. Destas, 35 lâminas foram obtidas de amostras de campo referentes à regional e aos alvos, enquanto 58 foram efetuadas de amostras de furo de sondagem dos alvos Cascavel e Tinteiro. Algumas lâminas petrográficas foram analisadas no Laboratório de Microssonda Eletrônica (JEOL JXA-8230 Electron Probe Microanalyzer) do Instituto de Geociência (UnB), caracterizando a composição química dos minerais presentes nos halos de alteração hidrotermal.
1.4.1.6 – Geoquímica
Foram utilizadas análises geoquímicas referentes a rochas de furos de sonda, amostras de rocha de afloramento, de solo e sedimento de corrente realizadas e cedidas pelas empresas Troy Exploração Mineral Ltda. e Orinoco do Brasil Mineração Ltda. Os tipos de análise compreendem Screen Fire Assay e ICP- mass spectrometry (ICP-MS), realizados pelos laboratórios ALS Minerals, Intertek, SGS Minerals Services e ACME Analytical Laboratories LTD.
As análises de ICP- mass spectrometry (ICP-MS) foram utilizadas para dosagem de óxidos e vários elementos menores em amostras de 0,25g. Cada amostra preparada é diluída com ácidos perclórico, nítrico, fluorídrico e clorídrico. O resíduo é complementado com ácido clorídrico diluído e analisado por ICP- atomic emission spectroscopy (ICP-AES). Os resultados são revisados para altas concentrações de bismuto, mercúrio, molibdênio, prata e tungstênio, que estejam em conformidade. Cumprindo este critério, as amostras são então analisadas para ICP-MS.
Os elementos químicos processados neste trabalho são os que mostraram teores anômalos em alguns furos de sonda e amostras de afloramento, tais como Au, Cu, Ag, Ni, Fe, Co e Ba, e alguns elementos farejadores, objetivando delimitar zonas anômalas e determinar a correlação entre tais elementos e feições geológico-estruturais.
1.4.2. – Métodos de Trabalho
Os métodos incluem processamento e interpretação de dados aerogeofísicos e geoquímicos, mapeamento geológico, medidas das propriedades físicas de rochas, descrições petrográficas (macro e microscópicas) e análises de microssonda eletrônica.
9 1.4.2.1 – Pesquisa Bibliográfica
Inicialmente, foi feito o levantamento bibliográfico das principais pesquisas realizadas nos greenstone belts de Faina e Serra de santa Rita, e nos demais cinturões arqueanos do Terreno Arqueano-Paleoproterozóico de Goiás, bem como artigos referentes á Faixa Brasília, e de outros temas de crucial interesse para este trabalho.
1.4.2.2 – Processamento e interpretação dos dados aerogeofísicos de alta resolução
A partir de processamento dos dados aerogeofísicos de alta resolução da área total e da área de detalhe, foram elaborados mapas aeromagnetométricos e gamaespectrométricos, utilizando-se o software GEOSOFT Inc. OASIS Montaj. A técnica de interpolação utilizada com os dados magnetométricos e gamaespectrométricos consiste no método bi-direcional, com o tamanho de célula da malha de ¼ do espaçamento entre as linhas de voo. Os principais produtos derivados utilizados neste trabalho consistem de amplitude do sinal analítico (ASA), derivada horizontal em x (Dx), derivada horizontal em y (Dy), derivada vertical (Dz), amplitude do gradiente horizontal calculado a partir de Dx e Dy (AGHT) e modelo digital de terreno (DTM) para os dados magnetométricos, além das imagens dos canais de K(%), eU(ppm) e eTh(ppm), imagem ternária (RGB) e fator Fk, para os dados gamaespectrométricos.
1.4.2.3 – Processamento de dados geoquímicos
Os dados geoquímicos referentes a amostras de solo e rocha foram “tratados” utilizando-se o software ESRI ArcGIS Inc. (versão 9.3). Os elementos químicos processados neste trabalho são os que mostraram teores anômalos em alguns furos de sonda e amostras de afloramento, tais como Au, Cu, Ag, Ni, Fe, Co e Ba, e alguns elementos farejadores, objetivando delimitar zonas anômalas e determinar a correlação entre tais elementos e feições geológico-estruturais.
1.4.2.4 – Coleta das propriedades físicas de rocha
Foram coletados dados de propriedades físicas de rocha ao longo dos furos de sonda CDP-04 e CDP-09 e em amostras de rocha coletadas em campo referentes ao alvo Tinteiro, tais como susceptibilidade magnética, condutividade elétrica e radiação gama. Para a aquisição dos dados de susceptibilidade magnética e condutividade foi utilizado o equipamento MPP-EM2S+ (Multi Parameter Probe), desenvolvido pela INSTRUMENTATION GDD INC., e gamaespectrometria a partir do aparelho BGO-SUPER-SPEC RS 230, disponibilizados pelo Instituto de Geociências da Universidade de Brasília (UnB). Este consiste em uma sonda ligada a uma unidade de leitura (PDA) e possibilita a determinação da susceptibilidade magnética (10-3 SI) e valores de condutividade
10 elétrica relativa e absoluta (Mhos/m) em amostras. Os parâmetros do equipamento utilizado na coleta de dados foram taxa de amostragem de 10 vezes por segundo e taxa apresentada a cada 0,5 segundo. A coleta dos radioelementos K, eTh e eU foi realizada utilizando-se o gamaespectrômetro portátil de 256 canais BGO-SUPER-SPEC RS 230, fabricado pela Exploranium, que consiste de um espectrômetro com detector para medições com germanato de bismuto (Bi4Ge3012 ou BGO).
1.4.2.5 – Mapeamento geológico
Durante o mês de fevereiro de 2014 foi realizado trabalho de campo para reconhecimento regional. Posteriormente, foi realizada campanha de campo no mês de abril com objetivo de checar os domínios geofísicos e obter mapa geológico e estrutural de parte do greenstone belt de Faina, na escala 1:25.000. Em outubro de 2014 foi realizada nova campanha de campo com objetivo de elaborar mapa geológico na escala 1:10.000 sobre a área dos alvos Cascavel e Tinteiro. Para a confecção dos mapas geológicos utilizou-se o software ESRI ArcMap Inc. (versão 9.3).
1.4.2.6 – Estudos petrográficos
Para a descrição petrográfica foi utilizado o microscópio Olympus (modelo BX60FS – Olympus Optical Co. Ltd.) no Laboratório de Microscopia da Universidade de Brasília (UnB). Neste estudo utilizou-se de luz transmitida, na identificação de minerais translúcidos, e luz refletida, para minerais opacos como sulfetos e óxidos. Esta etapa foi primordial na separação e caracterização de halos de alteração hidrotermal.
1.4.2.7 – Microssonda Eletrônica
Lâminas das amostras dos furos CDP-04 e CDP-09 referentes à zona mineralizada, nos intervalos proximais e distais da mineralização foram analisadas no Laboratório de Microssonda Eletrônica (JEOL JXA-8230 Electron Probe Microanalyzer) do Instituto de Geociência (UnB), objetivando caracterizar a composição química dos minerais presentes nos halos de alteração associados ao evento hidrotermal que gerou a mineralização. Foram também analisadas lâminas pertencentes a amostras de rocha obtidas em afloramento e furos de sondagem do alvo Tinteiro referentes a brechas manganesíferas, brechas hematíticas e gossan. As análises de microssonda foram realizadas em silicatos, carbonatos, sulfetos e óxidos.
1.4.2.8 – Integração de dados em um mapa prospectivo
A integração dos dados geofísicos, geoquímicos e geológicos fez-se utilizando a metodologia lógica fuzzy com o intuito de gerar cenários prospectivos indicando regiões potenciais nos alvos Cascavel e Tinteiro. Para isso, utilizou-se o software ESRI ArcSDM Inc. (versão 9.3).
11 1.5. - ESTRUTURA DA DISSERTAÇÃO
Esta dissertação de mestrado se divide em três partes. A primeira introduz o trabalho apresentando a localização da área, objetivos do estudo e metodologia utilizada. A segunda parte é composta pelo artigo: “PROSPECTIVITY ANALYSIS OF GOLD AND IRON OXIDE
COPPER-GOLD-(SILVER) MINERALIZATIONS USING HIGH RESOLUTION AIRBORNE
GEOPHYSICAL AND MULTI-SOURCE DATA FROM THE FAINA GREENSTONE BELT, BRAZIL”. A terceira contém discussões e considerações finais.
12
II. ARTIGO
13 PROSPECTIVITY ANALYSIS OF GOLD AND IRON OXIDE COPPER-GOLD-(SILVER) MINERALIZATIONS USING HIGH RESOLUTION AIRBORNE GEOPHYSICAL AND MULTI-SOURCE DATA FROM THE FAINA GREENSTONE BELT, BRAZIL
Daniela S. de Camposa,*, Adalene M. Silvaa, Catarina L.B. Toledoa, Marcelo J. de Carvalhob, Vinícius G. Rodriguesb, Kawinã Araujob
a
Institute of Geosciences/University of Brasília. Campus Universitário Darcy Ribeiro S/n, Asa Norte, Brasília – DF. Zip code: 70910-900, Brazil.
b
Orinoco do Brasil Mineração Ltda. Rua Padre Arnaldo, n°32, Centro. Cidade de Goiás, GO. Zip code:76600-000, Brazil.
* Corresponding author: e-mail, dani.schievano@gmail.com ABSTRACT
The Faina Greenstone Belt is located in the southern sector of the Goiás Archean block and has been investigated since the 18th century because of its gold deposits. Recent studies have revealed the polymetallic potential of the belt, which is indicated by the anomalous levels of Ag, Cu, Fe and Co in addition to Mn, Ba, Li, Ni, Cr and Zn. This study was developed based on a detailed analysis of two selected target sites, Cascavel and Tinteiro, and multisource data, such as airborne geophysics, geochemistry and geological information, were used to create a final prospectivity map from the integration of all these data. The applied methodology used to obtain this map was fuzzy logic.
The gold mineralization of Cascavel target is inserted in an orogenic system and occurs in two overlapping quartz veins systems, called Mestre-Cascavel and Cuca, embedded in quartzite with an average thickness of 50 cm and guidance N45°-60°W/25°SW with free coarse gold in grains 2-3 mm to 3 cm. The potentiality map created for this prospect generated four first-order favorable areas for mineralization and new medium-favorability foci. The Tinteiro area, derived from studies conducted by Orinoco do Brasil Mineração Ltd., shows polymetallic mineralization associated with an iron oxide copper gold ore deposit (IOCG) system poterior to Cascavel target mineralization. Its prospectivity map generated 19 new target sites with the potential for Au, Cu and Ag mineralization, suggesting new directions for future prospecting programs.
Keywords: Faina Greenstone Belt, aeromagnetometry, gamma spectrometry, gold mineralization, polymetallic mineralization, fuzzy logic.
14 1. Introduction
Globally, mining companies seek to utilize prospectives efficient methods that decrease costs during mineral exploration stages. To achieve such goals, they must utilize techniques that efficiently aggregate the data generated in the different stages of a given study by focusing on models that have a greater likelihood of estimating deposits (Robert et al., 2007). Magnetic surveys coupled with high-resolution gamma spectrometry data represent available technology in airborne geophysics for the detection of relevant structures for mineral exploration, and they have been shown to be efficient in the selection of follow-up target sites in tropical terranes (Costa e Silva et al., 2012; Carrino et al., 2011).
The Faina Greenstone Belt is the target of this study, and along with the Pilar de Goiás, Guarinos, Crixás and Serra de Santa Rita belts, it is part of the granite-greenstone terranes of the Archean-Paleoproterozoic terrane of Goiás, which is located in the northern sector of the Brasília belt (Pimentel et al., 2004, Jost et al., 2005, Jost et al. 2013). This region has been investigated since the time of the Bandeirantes explorers (18th and 19th centuries) and shows the potential to host gold (Au) mineralizations. Several companies have mined in the area, including the well-known Metais de Goiás S.A. (METAGO), Western Mining Co., Amazônia Mineração and Troy Resources Brazil.
The discovery of Sertão, a low-volume and high-concentration gold mine, had a positive impact on the local economy and on the cities of Faina and Goiás. The mine was explored in the period from 2000 to 2007 by Sertão Mineração Ltd., which ceased its activities after exploiting the oxidized ore to a depth of 40 m. The company reported the extraction more than 250,000 ounces of gold, with a mean content of 24.95 g/t. Since 2011, the area has been studied by Yamana Gold Inc. and Orinoco do Brasil Mineração Ltd.
Orinoco do Brasil Mineração Ltd. is particularly relevant because of its investments in the Faina Greenstone Belt, including an innovative exploration program for known target sites, such as Cascavel, and the discovery of the new target sites of Tinteiro and Eliseu. The new target sites indicate a potential for gold and polymetallic mineralizations in the region. Additionally, the company resumed and intensified their studies in the Mina de Sertão site, and they plan to reopen it as an underground mine (http://orinocogold.com/).
This study focused on detailing two selected target mineralization sites (Cascavel and Tinteiro) of the Faina Greenstone Belt using a methodology based on the processing and interpretation of aeromagnetic, gamma spectrometry and geochemical data. The data were then integrated into
15 mineral favorability models using fuzzy logic, and the methodological steps were derived from the exploration program proposed by Pan and Harris (2000) and Harris and Sanborn-Barrie (2006) and modified from Nykänen (2008) and Costa e Silva et al. (2012) (Fig. 1).
Fig. 1. Flowchart representing the main steps of the mineral exploration model. This diagram is based in the method suggested by Pan and Harris (2000) and Harris and Sanborn-Barrie (2006) and adapted from Nykänen (2008) and Costa e Silva et al. (2012).
16 Fuzzy logic has been shown to be an efficient tool in the search for new prospecting targets; therefore, it has been widely used in mineral study projects of various types and scales (Nykänen et al., 2008). Fuzzy logic is an approach based on expert knowledge and converts semantic descriptions into numerical spatial models that predict the location of the object of interest (Raines et al., 2010). The application of this method in the study area will show zones with similar geophysical, geochemical and geological signatures, thus indicating potential gold or polymetallic mineralization hosts. In recent decades, the application of this methodology has provided excellent results in areas where limited information is available, and it has provided high-level prospecting scenarios in established mining areas (Nykänen, 2008; Costa e Silva et al., 2012).
The main goal of this study is to generate mineral favorability models for the Faina Greenstone Belt by using fuzzy logic to integrate geological, geochemical, coring, and high-resolution geophysical data. The aim is to identify new exploration vectors for the study sites and generate new prospecting scenarios for the Faina Greenstone Belt.
2. Geologic Context and Mineralization in the Faina Greenstone Belt 2.1. Regional Geology
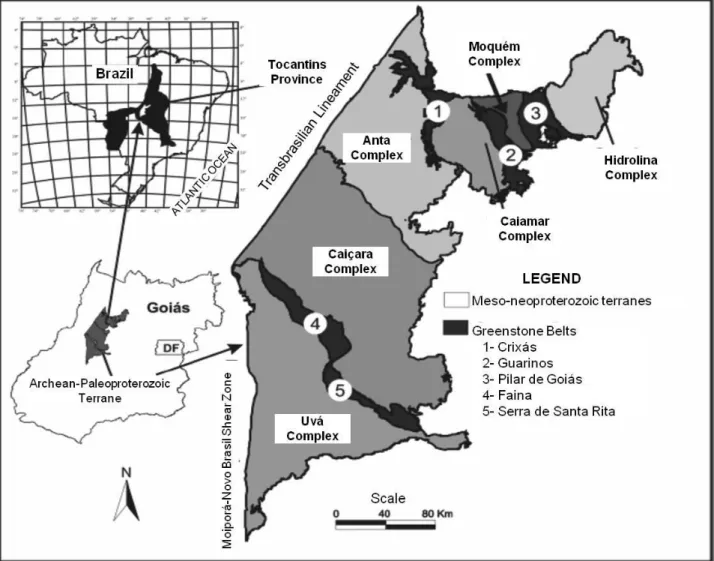
The study area is located within the Archean-Paleoproterozoic terrane of Goiás in the Brasília fold belt within Tocantins Province (Pimentel et al., 2000, Queiroz et al., 2008, Jost et al., 2013) (Fig. 2). The Archean-Paleoproterozoic terrane of Goiás extends over approximately 50,000 km2, and approximately 30% of it consists of volcano-sedimentary sequences of the greenstone belt type and 70% consists of granite-gneiss rocks, thus forming a typical granite-greenstone terrane (Fig. 2) (Almeida et al., 1977; Danni et al., 1981; Jost and Oliveira, 1991; Kuyumjian and Jost, 2006). The greenstone belts occur in five narrow belts, three of which (Crixás, Guarinos and Pilar de Goiás) are located in the northern end and two of which (Serra de Santa Rita and Faina) are located in the southern end. These belts host important gold deposits and are preserved in elongated synforms isolated by the Archean granite-gneiss complexes Hidrolina, Moquém, Caiamar, Anta, Caiçara and Uvá (Pimentel et al., 2000; Jost and Fortes, 2001) (Fig. 2).
The greenstone belts Serra de Santa Rita and Faina are located in the southern part of the granite-greenstone terrane, and they are structured in a syncline that is NW-SE aligned, 150-km long and 6 km wide (Kuyumjian and Jost, 2006; Baeta et al., 1998). These belts are separated by the strike-slip Faina Fault, which is aligned N30E (Resende et al., 1998), and they are located between two granite-gneiss complexes with distinct geologic evolution. The Caiçara complex to the north consists of 3.1 Ga old tonalitic gneisses and intrusive granodiorites, monzogranites and charnockite series, with ages between 2838 and 2818 Ma (Beghelli Junior, 2012). The Uvá complex to the south
17 consists of tonalitic gneisses and polydeformed granodiorites and dioritic rocks with crystallization ages from 3040 Ma to 2930 Ma and granitic tabular bodies dating between 2876 and 2846 Ma (Jost et al., 2013). The contacts between the granite-gneiss complexes and supracrustal rocks are intrusive or tectonic and marked by inverse shear zones with high angles converging to the northeast that completely obliterate the original architecture of these belts (Resende et al., 1998; Jost et al., 2005).
Fig. 2. Simplified geologic map of the Archean-Paleoproterozoic Terrane in Goiás (Pimentel et al., 2000).
2.2. Faina and Serra de Santa Rita Greenstone Belts
The lower stratigraphic sections of the Faina and Serra de Santa Rita greenstone belts are similar, and from the base to the top, they include metakomatiites (Manoel Leocádio Formation) and metabasalts (Digo-Digo Formation). In the Serra de Santa Rita belt, the Digo-Digo Formation consists of metabasalts and felsic metapyroclastic rocks, which are absent in the Faina Greenstone Belt. This basal unit is overlapped in both belts by distinct metasedimentary sequences, indicating different paleogeographic environments and depositional regimes in the basin (Resente et al., 1998) (Fig. 3).
18 In the Faina Greenstone Belt, the metasedimentary unit is represented by the Furna Rica Group, which is formed from the base to the top by records of two transgressive shelf sedimentary cycles (Resende et al., 1998). The first cycle begins with metaconglomerate lenses along with orthoquartzites, metapelites, carbonaceous schists and banded iron-formations (BIFs) from the Fazenda Tanque Formation laying on an angular unconformity over the underlying metavolcanic unit. The second cycle is represented by metaconglomerates, orthoquartzites and metapelites of the Serra de São José Formation covered by marbles and the iron formations of the Serra do Tatu Formation. The two sedimentary cycles are separated by an erosional unconformity indicated in Fig. 3 as the metasedimentary Units A and B (Toledo et al. 2014).
The metasedimentary record of the Serra de Santa Rita Greenstone Belt is represented by the Fazenda Paraíso Group, which was formed at the base by carbon schists, metachert, iron formations, calc-schists and marbles. The top of the sequence is covered by metagreywackes from the Fazenda Cruzeiro Formation, and its sedimentation occurred in a deep marine environment and progressed to a shallower environment, whereas in the Faina belt, shelf sedimentation occurred in two transgressive cycles of increasing depth (Resende et al., 1998). Geochemical data from the detrital rocks along the stratigraphic sections show that the Sm/Nd (TDM) model ages of the source
area decreased from 3.1 to 2.8 Ga. Additionally, the sediments originated from mafic/ultramafic sources in the initial stages of deposition, with an increase of felsic components towards the top of the sequence (Resende et al. 1999).
19
Fig. 3. Simplified regional geologic map of the Faina Greenstone Belt produced by Toledo et al. (2014). The black polygon indicates the study area mapped at the 1:10,000 scale, which is shown in Fig. 8.
20 2.3. Mineralization
In the study area, the two gold prospects Sertão and Cascavel stand out because they both have significant potential for continuous resource exploration and definition projects. The Sertão mine and the Cascavel prospect occur in the same structural context. The gold mineralization is of the lode type, and quartz veins occur that are structurally controlled by thrust faults and embedded in chlorite-quartz-schists of the second sedimentary cycle (Sertão) and feldspathic quartzites of the first sedimentary cycle (Cascavel). According to the data provided by Orinoco do Brasil Mineração Ltd., mineralized quartz veins extend along the direction and dip of the shear zone and appear to occur in structures of the second and third order as well. The locations of the Sertão mine and other study sites are indicated in Fig. 4.
The gold mineralizations inserted in the Cascavel deposit at the Cascavel target site are characterized by the presence of coarse free gold with grain sizes varying from 2-3 mm to 3 cm (Jost et al., 2014), and they are found in association with quartz veins with thicknesses of 1 cm and a pinkish coloration arranged in continuity with the tectonic foliation of the host rocks. The quartz veins are associated with shear zones that intercept the feldspathic quartzites occurring at the base of the first sedimentary cycle (metasedimentary sequence A). Lenses and dolomite layers hosting mineralizations rich in Cu, Ag and W also occur at this site.
The Tinteiro prospect represents a recent discovery by Orinoco do Brasil Mineração Ltd. and is located in the metasedimentary sequence of the first depositional cycle, and it alternates with quartzites, metapelites and metacherts. The analysis of the rock outcrops, hand samples and corings suggest a different context from that of the previous sites. Chloritoids of hydrothermal origin are observed, and they include a sericitic alteration halo and hematite breccias associated with metacherts. These rocks are of hydrothermal origin and occur in association with multiple faults in NE, NW and E-W directions that intersect the rocks in the Faina Greenstone Belt. The hydrothermal alteration zones are related to the polymetallic mineralization of gold and copper in high concentrations as well as that of cobalt, barium, silver, uranium and iron. According to studies undertaken by Orinoco do Brasil Mineração Ltd., the accumulation of these metals occurred after the orogenic gold mineralization in an iron oxide copper gold ore deposit (IOCG) system.
21
Fig. 4. RGB (453) image obtained from the Landsat 7 ETM+ sensor partially covering the Faina Greenstone Belt, Sertão Mining locations and the target sites Cascavel, North Tinteiro, Central Tinteiro, Southeast Tinteiro and South Tinteiro (yellow polygons).
22 3. Airborne Geophysical Data and Other Multi-Source Data
The Faina Greenstone Belt was covered by aeromagnetic and high-resolution gamma spectrometry surveys covering a total area of 1,562.38 km² and with a flight altitude 50 m above the terrain and flight lines spaced 200 m apart in a N-S direction and control lines spaced 1000 m apart in an E-W direction. A detailed area was covered by flight and control lines spaced 100 m and 500 m apart, respectively, over the Cascavel and Tinteiro sites. The aeromagnetic and gamma spectrometry data grids were created using the software Oasis Montaj (Geosoft Inc.). The gamma spectrometry data were interpolated using a bi-directional method with the grid cell size set to 25% of the distance between flight lines.
Images from the Landsat 7 Enhanced Thematic Mapper Plus (ETM+) sensor was used to interpret the airborne geophysical data to identify the main geologic features, with the RGB color composite bands 4, 5 and 3, respectively, selected and then fused with band 8 through a principal component algorithm. The image from orbit/spot 223/071 was made available by Orinoco do Brasil Mineração Ltd.
In this study, a geologic map that covers the Faina Greenstone Belt and part of the Serra de Santa Rita Greenstone Belt at a 1:25,000 scale was used (Toledo et al. 2014) along with geologic data obtained from two field trips, and these data were able to refine the regional geologic map within 1:25,000 scale inside the study area. Subsequently, the geologic mapping was performed at a 1:10,000 scale for the Cascavel and Tinteiro target sites. For the final integration of the results, geologic data provided by Orinoco do Brasil Mineração Ltd. were integrated. The geologic maps were created using ArcMap software (version 9.3) (ESRI).
To characterize the physical properties and mineralogical and chemical behavior of the mineralized zones of the region, 7 of the 50 probing holes that intercepted the mineralized bodies of the Cascavel and Tinteiro target sites, which were made available by Orinoco do Brasil Mineração Ltd., were selected.
Petrographic studies of the transmitted and reflected light were undertaken using 70 thin polished sections and an Olympus BX60FS microscope (Olympus Optical Co. Ltd.), which was made available by the Laboratory of Microscopy of the University of Brasília (UnB). These analyses aimed to identify and characterize the hydrothermal alterations and mineralization zones.
Chemical mineral analyses were conducted in the Electronic Microprobe Laboratory of the Instituto de Geociências (UnB) using the superprobe model JEOL JXA-8230. The voltages used were 15 kV and 20 kV. Specific minerals were analyzed when required to assist in the petrographic
23 descriptions and in the mineralogical characterizations of the hydrothermal alteration zones of both mineralization systems, which have been previously described.
During field work, the physical property data of the host rocks in the mineralized and non-mineralized zones were collected, including the magnetic susceptibility, electrical conductivity, and gamma radiation. The magnetic susceptibility and conductivity data were obtained using the MPP -EM2S+ (Multi-Parameter Probe) instrument (Instrumentation GDD, INC.). This instrument consists of a gun-shaped probe connected to a reading unit (PDA – personal digital assistant) that measured magnetic susceptibility (10-3 SI) and relative and absolute electrical conductivity values (Mho/m). The parameter settings of the equipment used for the data collection included the following: sampling rate at 10 times per second and display rate at every 0.5 seconds. The radioelements K, eTh and eU were measured every 5 minutes per sample using the 256-channel portable gamma spectrometer RS 230 BGO Super-SPEC (Exploranium), which is a spectrometer with a Bismuth Germanate oxide (Bi4Ge3012 or BGO).
The geochemical analysis used data on the major, minor and trace elements of the mineralized zones and its surroundings, which were collected in samples obtained from boreholes, rocks, soil, and stream sediment provided by the companies Troy Exploração Mineral Ltd. and Orinoco do Brasil Mineração Ltd. The analyses included a screen fire assay and inductively coupled plasma mass spectrometry (ICP-MS), which were conducted by the laboratories ALS Minerals, Intertek, SGS Minerals Services and ACME Analytical Laboratories Ltd. The geochemical data for the soil and rock samples were processed using ArcGIS (version 9.3) (ESRI). The chemical elements included in this study were those that exhibited anomalous concentrations in certain boreholes and field samples and included AU, Cu, Ag, Ni, Fe, Co and Ba as well as certain pathfinder elements, and these anomalous elements were used to identify anomalous zones and determine the correlation between these elements and the previously mapped geological-structural features.
The integration of all data was conducted using ArcSDM software (version 9.3) (ESRI), with the objective of creating the final exploration map using fuzzy logic tecnhique.
4. Data Processing and Interpretation 4.1. Geophysical Data
The high-resolution airborne geophysical data partially covering the Faina Greenstone Belt were processed following state-of-the-art pre-processing and processing methods (interpolation and microleveling), and the maps were transformed in two steps. After the grid interpolation of the anomalous magnetic field, the K (%), eTh (ppm), eU (ppm) channels, and the total count (µR/h),
24 other products were generated and transformed from the data obtained at the 200 m intervals. Similarly, data obtained at the 100 m intervals were used to map hydrothermal halos and structures related to the Cascavel, North Tinteiro, South Tinteiro, Central Tinteiro and Southeast Tinteiro target sites (Fig. 4).
4.1.1. Aeromagnetic Data
These data were processed using efficient techniques to determine the geometric parameters and identify the geological and structural limits, geologic feature depths and structural measurements, such as the amplitude and inclination of the analytic signal, vertical and horizontal derivatives (X and Y), and amplitude of the total horizontal gradient. These products were used to map shear zones known to host gold and polymetallic mineralizations as well as their extensions along the sub-surface and across flattened areas that may have the potential to host Au or Cu-Au-(Ag). Fig. 5 illustrates the processes involved in the production of the following products for the Faina Greenstone Belt and the target sites: total magnetic intensity reduced from IGRF (TMI), vertical derivative (Dz), horizontal derivative in x (Dx), horizontal derivative in y (Dy), amplitude of the horizontal gradient calculated using Dx and Dy (AGHT), analytic signal amplitude (ASA) and digital terrain model (DTM).
25
Fig. 5. Main aeromagnetic products: a) TMI, b) ASA, c) Dx, d) Dy and and) Dz. The black outline indicates the main sites analyzed in this study: A – Cascavel, B – North Tinteiro, C – Central Tinteiro, D – Southeast Tinteiro and E – South Tinteiro.
4.1.2. Gama Spectrometry Data
The gamma ray aerial survey shows the geochemical variations of potassium, uranium and thorium up to a depth of 30 cm from the earth’s surface, and the main variations of these three radioelements translate into signatures that can be used to identify each type of rock (Dickson and Scott, 1997), which provides this geophysical method with the potential to be used as an essential tool for geologic mapping. Another modern application of gamma spectrometry is the identification
26 of hydrothermal alteration areas and their relationships with the mineralizing processes of different geologic environments.
The processing of gamma spectrometry data was used to produce images of the K (%), eU (ppm) and eTh (ppm) channels, and RGB (ternary image) (Fig. 6).
Dickson and Scott (1997) warn that variations in environmental conditions might lead to different radioelement levels, with thorium showing the lowest geochemical mobility; thus, it is used as a lithological control to define ideal potassium and uranium levels (Saunders et al., 1987), which is performed using the following calculations of potassium and uranium normalized to thorium (Kd and Ud):
Kd = (%K – Ki)/Ki; where Ki = (average %K/average eTh) * eTh
Ud = (eU – Ui)/Ui; where Ui = (average eU/average eTh) * eTh; Ki and Ui are the ideal values defined by thorium, and Kd and Ud are the anomalous values.
Additionally, images of the Fk and Fu factors, known as parameter F, were obtained, and they indicate the enrichment of potassium and uranium relative to thorium as well as hydrothermal alteration zones associated with mineralization (Gnojek and Prichystal, 1985). Fk and Fu are calculated as follows:
27
Fig. 6. K (%), eU (ppm) and eTh (ppm) concentrations used to identify the hydrothermal alteration zones, and the RGB image, which is essential for the geologic mapping and shows the Cascavel and Tinteiro target sites.
4.1.3. Interpretation of Aeromagnetic Data
The analysis of the anomalous magnetic field was performed using linear transformations, such as the horizontal derivatives in x and y (Dx, Dy) and the vertical derivative (Dz), to generate the image of the analytic signal amplitude (ASA) (Roest et al., 1992). The ASA was used to identify a number of the main magnetic bodies in the area and was of great importance to this study because certain hydrothermal alterations in the Tinteiro site and along the greenstone are associated with magnetite, which was confirmed in the geologic mapping. These results indicate that magnetic bodies are identified as quartzite and metachert layers with hydrothermal alterations that consist of massive iron oxide.
The identification and characterization of the magnetic structures were obtained by interpreting the vertical derivative Dz (Fig. 4) (Miller and Singh, 1994) and complemented with the analysis of the horizontal derivatives in X and Y. It is noteworthy that the lineament term used here represents a straight or curved surface feature capable of being mapped, and it may be related to