UNIVERSIDADE DO ALGARVE
Radio frequency system for remote fish monitoring in
aquaculture
Tiago João Barbosa de Almeida
Dissertação
Mestrado Integrado em Engenharia Eletrónica e Telecomunicações
Trabalho efetuado sob a orientação de:
Prof. Doutor Henrique Leonel Gomes
UNIVERSIDADE DO ALGARVE
Radio frequency system for remote fish monitoring in
aquaculture
Tiago João Barbosa de Almeida
Dissertação
Mestrado Integrado em Engenharia Eletrónica e Telecomunicações
Trabalho efetuado sob a orientação de:
Prof. Doutor Henrique Leonel Gomes
I
Radio frequency system for remote fish monitoring in
aquaculture
Declaração de autoria de trabalho
Declaro ser o(a) autor(a) deste trabalho, que é original e inédito. Autores e trabalhos consultados estão devidamente citados no texto e constam da listagem de referências incluída.
Assinatura do candidato:________________________________________________
Copyright © 2017 Tiago Almeida
A Universidade do Algarve tem o direito, perpétuo e sem limites geográficos, de arquivar e publicitar este trabalho através de exemplares impressos reproduzidos em papel ou de forma digital, ou por qualquer outro meio conhecido ou que venha a ser inventado, de o divulgar através de repositórios científicos e de admitir a sua cópia e distribuição com objetivos educacionais ou de investigação, não comerciais, desde que seja dado crédito ao autor e editor.
II
Agradecimentos
Eu não poderia deixar de começar por apresentar uma palavra de agradecimento às pessoas que, de forma direta ou indireta, contribuíram para o sucesso da minha dissertação. O trabalho realizado insere-se no projeto europeu AquaExcell 2020, que é coordenado na Universidade do Algarve pelo Prof. Adelino Canário. O trabalho realizado nesta tese insere-se especificamente na work-package 8, coordenada pelo grupo do Prof. Juan A. Montiel-Nelson do Institute for Applied Microelectronics/EE&A, Dept.
University of Las Palmas de Gran Canaria, em Espanha.
Agradeço ao Prof. Dr. Henrique Leonel Gomes, pela oportunidade e orientação da elaboração deste trabalho que foi bastante aliciante e desafiador para mim, pondo bastante à prova as minhas capacidades de resolver problemas, indo à procura de soluções e também usando os conhecimentos que fui aprendendo ao longo do curso e também da vida. Obrigado ao Prof. Adelino Canário pela cedência do laboratório associado Centro de Ciências do Mar (CCMAR) e ao Prof. Henrique Gomes ela cedência do laboratório de Eletrónica Orgânica (Instituto de Telecomunicações) para o desenvolvimento do trabalho. Também não poderia deixar de agradecer ao Dr. Peter Hubbard pela ajuda durante os testes experimentais e ao Dr. João Reis que gentilmente cedeu o aquário usado nestes testes e ao Prof. Adelino Canário que tornou possível a realização deste trabalho. Agradeço também aos meus colegas e também amigos da universidade pelos bons momentos proporcionados, pela amizade, força e ajuda durante o longo período que passei na universidade. Um especial obrigado ao Hélder Simões e Aldric Négrier pelo apoio constante e ajuda durante o desenvolvimento dos projetos que tinha de fazer. Sem a ajuda de todos, nada disto seria possível.
Por fim, devo agradecer aos meus pais, familiares e amigos externos à universidade que me apoiaram ao longo da minha carreira académica. Embora não saibam como me poderiam ajudar dentro da universidade, deram-me sempre força e motivação para continuar em frente para chegar a estar prestes a terminar este curso universitário.
III
Resumo
A produção de peixes em aquacultura tem vindo a crescer exponencialmente. Atualmente, aproximadamente 50% do peixe consumido é produzido mundialmente em aquacultura. Com o objetivo de maximizar o rendimento de produção de peixe, são usadas densidades populacionais relativamente elevadas em espaços confinados. As condições de produção de peixe obrigam a ter um conjunto de preocupações com a saúde e bem-estar dos peixes por razões económicas e éticas.
Em ambientes de aquacultura, é importante medir parâmetros que possam indiciar o desenvolvimento de alterações no estado de saúde dos peixes, sendo crucial para tomar medidas preventivas e impedir a propagação de doenças. Um dos indicadores mais relevantes que afeta a saúde do peixe é o stress. Quando submetidos a um stress prolongado, os peixes acabam por ficar suscetíveis a doenças, que se podem propagar rapidamente por toda a população com consequências catastróficas. É possível avaliar se um peixe está em estado de stress através de um conjunto de alterações fisiológicas e comportamentais, como por exemplo o aumento da hormona cortisol no sangue ou o aumento do batimento cardíaco.
O objetivo do nosso projeto é desenvolver um sistema de monitorização capaz de detetar, em tempo real, as alterações fisiológicas ou comportamentais indicadoras de
stress. O sistema implementado é constituído por um sensor ou vários sensores colocados
no peixe a nadar livremente no tanque. Os dados recolhidos são então enviados por um sistema de transmissão de dados sem fios, através de ondas rádio, para uma estação base onde ocorre a monitorização dos dados.
O consórcio onde foi realizado o nosso projeto (AquaExcell 2020) definiu que o sistema teria de ser um sistema comercial de identificação por rádio frequência (RFID) a funcionar a 134.2 kHz. Os sistemas RFID são usados vulgarmente na identificação e leitura de etiquetas de identificação eletrónica em animais ou objetos.
O sistema RFID utilizado é um sistema passivo, em que a etiqueta eletrónica colocada no peixe não tem uma bateria. A energia que a etiqueta precisa é obtida através do sinal que é enviado pela antena do leitor. É um sistema de baixo custo, confiável e com um tempo de vida relativamente longo (duração de meses).
Foi construído um sistema RFID a funcionar à frequência de 134.2 kHz usando equipamento comercial da Texas InstrumentsTM. O trabalho envolveu a otimização da
IV confiável. Define-se a distância máxima como alcance de leitura. O alcance de leitura do sistema é um aspeto crucial porque as ondas eletromagnéticas são fortemente atenuadas pela água, que depende da frequência do sistema e da condutividade do meio. Tipicamente, um sistema a funcionar a 134.2 kHz tem um alcance inferior a um metro. O alcance de leitura do sistema depende do tipo de antenas usadas quer para a etiqueta quer para o leitor, da disposição espacial das antenas, do número de antenas e da forma como estas antenas são ligadas (em paralelo, em série, etc.). A presença de interferências externas (metais na proximidade das antenas) também condicionam o alcance.
Foram realizadas experiências quer usando uma antena, quer usando duas antenas de leitura. Usando duas antenas, foi possível fazer uma monitorização em todo o volume de um tanque de água salgada de 70 cm de comprimento, 30 cm de altura e 40 cm de largura.
Palavras-chave: Stress, Peixe, Sistema de monitorização, Aquacultura, Identificação por Rádio-Frequência (RFID).
V
Abstract
Stress is a factor that influences fish welfare. Some physiological and behavioral stress responses, such as the increase of cortisol release and heart rate, are triggered in fish and can show the severity of stress in fish.
The objective of our work is to develop a system to monitor a device placed in free-swimming fish. The device has one or multiple sensors that measures parameters related with the stress or health state of the fish. The data recorded by the sensor is transmitted to a base station. Data transmission uses radio-frequency identification (RFID) technology. The tag is battery-less and receives the energy from the magnetic field provided by the base station. The system is low-cost, reliable and provides long-term monitoring.
The project has been defined to use a commercial system operating at 134.2 kHz from Texas InstrumentsTM. The work carried out involved the optimization of the
maximum distance between the tag and reader antenna to maintain a reliable communication. The maximum distance is defined as read range. The optimization of the read range is a crucial point on this thesis because radio waves are strongly attenuated underwater.
The read range is influenced by the reader power, antennas size, antennas orientation as well as the presence of the metal in the antennas proximity. These aspects were studied in detail in this thesis. Measurements of the read range of the system were performed for a system with one reader antenna (single-antenna system) and a system with two reader antennas (multi-antenna system). For a multi-antenna system, we successfully covered the volume of a water tank with 70 cm length, 30 cm height and 40 cm width.
Keywords: Stress, Fish, Monitoring system, Aquaculture, Radio-frequency identification (RFID).
VI
Index
Agradecimentos ...II Resumo ... III Abstract ... V Index ... VI Index of Figures ... IX Index of Tables ... XII Abbreviations List ... XIIIChapter 1 ... 1
INTRODUCTION ... 1
Structure of the thesis ... 1
Objectives ... 1
Motivation ... 2
Chapter 2 ... 5
UNDERWATER RFID TELEMETRY ... 5
Introduction ... 5
Architecture of the RFID system ... 5
Tags ... 6
Readers ... 7
Host computer ... 8
Antennas ... 9
RFID operating frequencies ... 14
RF communication protocols ... 15
VII
Underwater communication ... 21
Practical underwater applications using RFID systems ... 22
Chapter 3 ... 25
RFID SYSTEM FOR SENSING APPLICATION ... 25
Introduction ... 25
Hardware description of the RFID system ... 26
Tag ... 26 3.2.1.1. MSP430F2274 microcontroller ... 27 3.2.1.2. TMS37157 analog front-end ... 28 3.2.1.3. Tag antenna ... 28 Reader... 29 3.2.2.1. TMS37F158 control chip ... 29 3.2.2.2. RI-RFM-007B RF module ... 30 3.2.2.3. RI-ANT-G01E antenna ... 30 Host computer ... 30
Communication interfaces between devices ... 30
Interface between AFE and MCU of the tag ... 31
Interface between control module and RF module ... 32
Interface between reader and tag antennas ... 33
Interface between host computer and control module ... 34
3.3.4.1. Downlink protocol ... 35
3.3.4.2. Uplink protocol ... 36
3.3.4.3. Example of a telegram: battery charge command ... 36
3.3.4.4. Example telegram: MSP access command ... 37
Software development ... 38
Firmware ... 38
3.4.1.1. Tag firmware ... 39
3.4.1.2. Reader firmware ... 40
VIII
Chapter 4 ... 45
EXPERIMENTAL WORK ... 45
Introduction ... 45
Characterization of RF components ... 46
Characterization of the RF module ... 47
Characterization of the gate antenna ... 48
4.2.2.1. Parasitic effects caused by additional wires ... 50
4.2.2.2. Parasitic effects caused by nearby metals ... 52
Read range measurement using single-antenna system ... 57
Characterization of the mutual coupling between two antennas ... 57
Measurements of the read range in air ... 59
Read range measurement using multi-antenna system ... 63
Tuning of the LC circuit ... 64
Measurement of the read range in air ... 68
Measurements of the read range in water... 74
Chapter 5 ... 76
CONCLUSION ... 76
Conclusions about the work ... 76
Suggestions for future work ... 77
IX
Index of Figures
Fig. 2.1 – Schematic diagram of the RFID system [39]. ... 6 Fig. 2.2 – Photograph of different types of RFID tags, developed by Texas
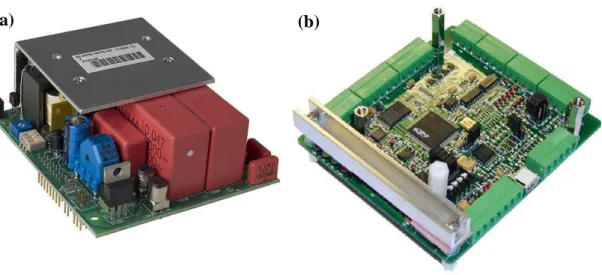
InstrumentsTM [41]. ... 7 Fig. 2.3 – Photographs of the individual modules of a RFID reader, developed by Texas InstrumentsTM. (a) RF module [42] (b) Control module [43]. ... 8 Fig. 2.4 – Photographs of different loop antennas in shape and size for tags, developed by Texas InstrumentsTM [41]. ... 9 Fig. 2.5 – Photograph of three gate loop antennas of different sizes behind two stick loop antennas of the reader, developed by Texas InstrumentsTM [46]. ... 10
Fig. 2.6 – Principle of inductive coupling between reader and tag antennas [47]. ... 11 Fig. 2.7 – LC circuits of reader and tag. The inductor is the antenna itself and the
capacitor is connected in series or in parallel to the antenna. The reader has the capacitor in series with the antenna for maximizing current through the antenna. The tag has the capacitor in parallel with the antenna for maximizing induced voltage in the tag antenna [48]. ... 12 Fig. 2.8 – The RF output power of a high Q antenna is compared with the RF output power of a low Q antenna. The parameter f0 is the resonance frequency of the system
[46]. ... 13 Fig. 2.9 – FDX operation. The TX is the reader and the RX is the tag. In ASK, the reader transmit a continuous RF signal and the tag sends an amplitude modulated signal. A high envelope is a binary code ‘1’ and a low envelope is a binary code ‘0’ [49]. ... 15 Fig. 2.10 – HDX operation. The TX is the reader and the RX is the tag. In FSK, the reader transmits a periodic RF signal and the tag sends a frequency modulated signal. The tag sends 0’s nearly in the resonance frequency and 1’s in a slightly lower
frequency [49]... 16 Fig. 2.11 – Detrimental effect of the presence of metal on magnetic field [51]. (a) The magnetic field is produced by a wire in an environment without metals. (b) The lines of the magnetic field are distorted by the presence of metal, causing a non-readable area. 17 Fig. 2.12 – Magnetic field lines of the reader antenna. The reader antenna couples with two “in-perpendicular” tags and one “in-parallel” tag in different positions. The
maximum distance of the read range is obtained with the “in-parallel” tag antenna [46]. ... 18 Fig. 2.13 – Readout pattern of the system for the different tag orientation angles [52]. (a) 0º tag orientation (“in-parallel” tag). (b) 30º tag orientation. (c) 60º tag orientation. (d) 90º tag orientation (“in-perpendicular” tag). ... 19 Fig. 2.14 – “In-phase” connection. (a) Opposing gate antennas whose respective
currents are flowing in the same direction (adapted from [53]). (b) Resulting magnetic field pattern, easily detecting three “in-parallel” tags in the field [46]. ... 20 Fig. 2.15 – “Out-of-phase” configuration. (a) Opposing gate antennas whose respective currents are flowing in opposite directions (adapted from [53]). (b) Resulting magnetic field pattern, detecting two “in-perpendicular” tags [46]. ... 20 Fig. 2.16 – Animal tracking in an aquarium, using a circular antenna [55]. ... 23 Fig. 2.17 – Environmental tracking of a coastal dynamics [55]. (a) A “Smart Pebble”. On its surface is possible to notice a dark hole housing the tag. (b) A moment of the identification operations. ... 23 Fig. 3.1 – Schematic diagram of the implemented RFID system. ... 26 Fig. 3.2 – 40-Pin configuration of the MSP430F2274 unit [57]. ... 27
X
Fig. 3.3 – 16-pin configuration of the TMS37157 unit [58]... 28
Fig. 3.4 – 30-pin configuration of the TMS37F158 unit [59]. ... 29
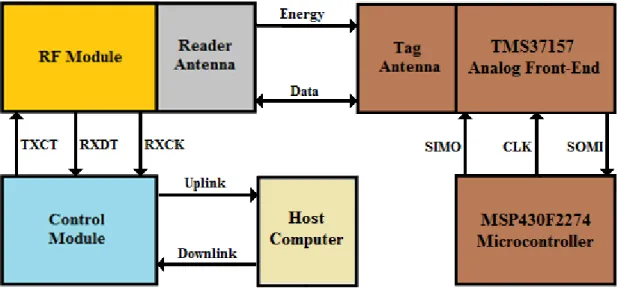
Fig. 3.5 – Schematic diagram of the communication between the elements which integrate the RFID system. ... 31
Fig. 3.6 – Interface between the AFE and the MCU of the tag (adapted from [61]). .... 32
Fig. 3.7 – Interface between the control module and the RF module of the reader (adapted from [43]). ... 33
Fig. 3.8 – Example of a pulse width cycle (adapted from [42]). (a) Pulse width ratio of 50%. (b) Pulse width ratio of 25%. ... 33
Fig. 3.9 – Example of high bit and low bit modulated in FSK, respectively. The time required for transmitting a high bit and a low bit are slightly different due to slightly difference between modulation frequencies (adapted from [58]). ... 34
Fig. 3.10 – Downlink protocol structure. ... 35
Fig. 3.11 – Uplink protocol structure. ... 36
Fig. 3.12 – Example of a structured battery charge command. Every field contains one byte each. The battery charge command is designated as the code 0x68 on TX Data. .. 37
Fig. 3.13 – Example of a structured MSP access command. Every field contains one byte, except CMD2 which contains no bytes and TX Data which contains nine bytes. The MSP access command is designated as the first byte 0x7D on TX Data, along with a set of arbitrary values (0x00). Finally two bytes for a block check character (BCC) checksum in the end of the field (0x03 for MSB of BCC and 0x48 for LSB of BCC). . 37
Fig. 3.14 – Example of a structured received response. Every field contains one byte each, except Tag Data which contains 10 bytes. It starts by the first byte (0x7E), following 6 bytes corresponding to sensor data. Next, 0x7D byte corresponds to the MSP access command which was previously sent to the tag and the following two bytes corresponds to a 16-bit BCC checksum. ... 38
Fig. 3.15 – Screenshot of the work environment of the Code Composer Studio™ software program. ... 39
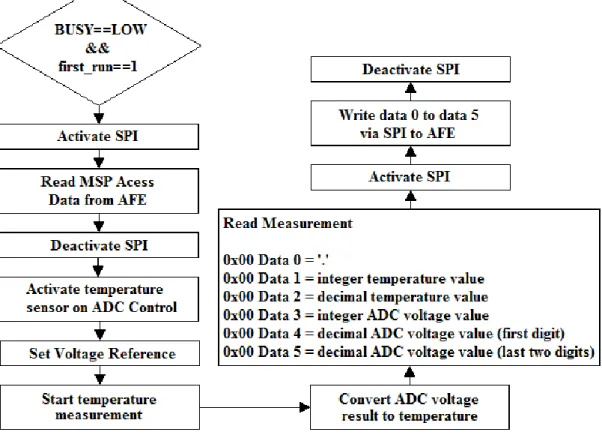
Fig. 3.16 – Flow diagram of the modified BUSY interrupt service routine. ... 40
Fig. 3.17 – Flow diagram of the modified main program. ... 41
Fig. 3.18 – Screenshot of the work environment of the GUI RFID application provided by Texas InstrumentsTM. ... 42
Fig. 3.19 – Flow diagram of the application. ... 43
Fig. 3.20 – Example of an output on the console where 28 measurements were taken in 28 seconds, displaying the temperature values and respective ADC voltage. ... 44
Fig. 3.21 – Example of a graphic of temperature as a function of the sample number (total of 500 samples were acquired). ... 44
Fig. 4.1 – Block diagram of the implemented RFID system. It is represented the three parameters which influence the communication distance between reader and tag. The DC current i is flowing to the RF module, the maximum distance d between reader and tag antennas and the tuning capacitance C. ... 46
Fig. 4.2 – The variation of the DC current provided by the RF module as function of the capacitance... 47
Fig. 4.3 – Frequency response of the antenna inductance. ... 48
Fig. 4.4 – Frequency response of the antenna resistance... 49
Fig. 4.5 – Frequency response of the quality factor of the antenna. ... 50
Fig. 4.6 – Equivalent circuit of the reader antenna. The resistance and inductance of the reader antenna were measured for a frequency of 134.2 kHz. ... 51
XI Fig. 4.7 – Equivalent circuit of the reader antenna connected in series with a one-meter length cable. The resistance and inductance of the reader antenna were measured for a frequency of 134.2 kHz. ... 51 Fig. 4.8 – The magnitude of the supply DC current versus capacitance tuning of the RF module, with and without extra cable added in the terminals of the antenna... 52 Fig. 4.9 – The influence of a metal plate in the vicinity of a reader antenna. The shorter the distance between the metal plate and the antenna the lower is the supply DC current. ... 53 Fig. 4.10 – Antenna inductance as function of the distance between a parasitic metal plate and the antenna. ... 54 Fig. 4.11 – Antenna resistance R as function of the distance between a parasitic metal plate and the antenna. ... 55 Fig. 4.12 – Antenna quality factor as function of the distance between a parasitic metal plate and the antenna. ... 56 Fig. 4.13 – Schematic diagram to perform the measurements of the induced voltage. .. 57 Fig. 4.14 – Measurement of the induced voltage of the receiving reader antenna as a function of distance between antennas. ... 58 Fig. 4.15 – Magnetic field flux lines generated by the reader antenna. Three specific locations in the magnetic field pattern were defined. In location A, the straight line detects an parallel” tag. In location B, the longest curved line detects an “in-perpendicular” tag. In location C, the shortest curved line detects an “in-parallel” tag (adapted from [46]). ... 59 Fig. 4.16 – Readout pattern of the magnetic field generated by the reader antenna. A, B and C are pre-selected locations of the tag antennas with specific orientation, exactly the same points as described in the figure 4.16 (adapted from [46]). ... 60 Fig. 4.17 – Read range as function of the capacitance for the three pre-selected
locations. ... 60 Fig. 4.18 – The effect of parasitic elements (metals and power supplies) in the RFID system cover area... 61 Fig. 4.19 – Maximum read range values obtained by measurement in tuned system for low Q antenna and high Q antenna. ... 62 Fig. 4.20 – Modified LC circuit with additional fixed capacitors. (a) “In-series”
antennas, (b) “In-parallel” antennas. ... 64 Fig. 4.21 – Antenna supply current as function of the capacitance tuning of the RF module, with “in-phase” and “out-of-phase” connections of the “in-series” antennas. . 65 Fig. 4.22 – Antenna supply current as function of the capacitance tuning of the RF module, with “in-phase” and “out-of-phase” connections of the “in-parallel” antennas. ... 66 Fig. 4.23 – Antenna supply current as function of the distance (between antennas) for four configurations. ... 67 Fig. 4.24 – Pre-selected locations of the tags inside the volume between the areas of the antennas. Point P is the centered point of the gate antenna. Location A provides the furthest read range relative to the y-axis. Location B provides the furthest read range relative to the x-axis. Location C provides the furthest read range relative to the z-axis, covering all the volume between the areas of the reader antennas. ... 68 Fig. 4.25 – Comparison of the minimum antenna supply current with the distance
between antennas arranged in two configurations, for phase” connection with “in-parallel” antennas and with “in-series” antennas (tags are placed in location A). ... 69
XII Fig. 4.26 – Comparison of the minimum antenna supply current with the distance
between antennas arranged in two configurations, for phase” connection with
“in-parallel” antennas and with “in-series” antennas (tags are placed in location B). ... 70
Fig. 4.27 – Comparison of the minimum antenna supply current with the distance between antennas arranged in two configurations, for phase” connection with “in-parallel” antennas and with “in-series” antennas (tags are placed in location C). ... 71
Fig. 4.28 – Comparison of the minimum antenna supply current with the distance between antennas arranged in two configurations, for “out-of-phase” connection with “in-parallel” antennas and with “in-series” antennas (tags are placed in location B). ... 72
Fig. 4.29 – Comparison of the minimum antenna supply current with the distance between antennas arranged in two configurations, for “out-of-phase” connection with “in-parallel” antennas and with “in-series” antennas (tags are placed in location C). ... 73
Fig. 4.30 – Implementation of the RFID system to detect tags underwater. (a) Schematic diagram, (b) Photograph taken during measurements in water tank. ... 74
Fig. 4.31 – Comparison between the minimum DC supply current required to detect the tag in air, freshwater and seawater at 40 cm distance between the antennas. ... 75
Fig. 5.1 – Mounted antennas arrangement [64]. (a) Pass-over arrangement as if the antenna is placed on the bottom of the tank. (b) Pass-by arrangement as if the antenna is placed on the walls of the tank. (c) Pass-through arrangement as if an antenna is placed in the middle of the tank. ... 78
Fig. 5.2 – Dual loop antennas arranged as a shifted gate in the x-axis. The distance d is the separation between gate antennas and the distance r is the shifted distance in the x-axis (adapted from [53]). ... 79
Index of Tables
Table 2.1 – Theoretical results of the skin depth. ... 22Table 2.2 – Read ranges of different LF tags [55]... 24
Table 3.1 – Downlink telegram description. ... 35
XIII
Abbreviations List
AC Alternating Current
ADC Analog-to-Digital Converter AFE Analog Front-End
ASK Amplitude Shift Keying DC Direct Current
DCO Digitally Controlled Oscillator
EEPROM Electrically-Erasable Programmable Read-Only Memory FDX Full-Duplex
FSK Frequency Shift Keying GUI Graphical User Interface HDX Half-Duplex
HF High Frequency I2C Inter-Integrated Circuit JTAG Joint Test Action Group LF Low Frequency
LSB Least Significant Bit MCU Microcontroller MSB Most Significant Bit PPM Pulse Position Modulation PWM Pulse Width Modulation RF Radio Frequency
RFID Radio-f requency Identification SIMO Slave-Input Master-Output SOMI Slave-Output Master-Input SPI Serial Peripheral Interface
UART Universal Asynchronous Receiver/Transmitter UHF Ultra High Frequency
USB Universal Serial Bus
1
Chapter 1
INTRODUCTION
SummaryThis chapter presents the main objective of the thesis and describes how the thesis is organized. It also describes the current understanding about fish welfare and some methods and techniques for measuring stress indicators and transmitting sensor data from a device to a base station.
Structure of the thesis
The thesis is organized in 5 chapters. Chapter 1 outlines the structure of the thesis, summarizes the objectives, and presents a brief description about fish welfare in aquaculture. Chapter 2 provides a review about RFID technology. Chapter 3 presents the architecture of the RFID system used on this thesis. The optimization and characterization of the RFID system is described in chapter 4 where results related to read range and other factors are presented and discussed. Finally, chapter 5 presents the relevant conclusions as well as suggestions for further work.
Objectives
The main objective of the thesis is to develop a radio frequency identification (RFID) system to transmit data from a tag located on a free-swimming fish in an aquaculture tank to a base station located outside the tank. The RFID system operates at the frequency of 134.2 kHz. The tag has sensors which monitor several parameters related with stress or the health state of the fish. The crucial point of the RFID system is to maximize the read range of the antennas to cover the largest possible volume underwater. The work is developed as part of the European project called AQUAEXCEL2020. The objective of the project is to coordinate and improve the performance of key European aquaculture research facilities to provide adequate experimental support and innovation to the European industry. One of the project work packages aims to design, probe and implement miniaturized biosensors for the specific, individual and remote fish monitoring of parameters related to overall fish performance and welfare.
2
Motivation
Aquaculture is the farming of aquatic organisms in any type of aquatic environment, under human control. The aim of aquaculture is human consumption and income. Aquaculture industry has been growing fast in world food production, accounting in the present approximately 50% of global fish used for human consumption and an annual average growth rate of approximately 6% [1]. With the continued expansion of the aquaculture industry, fish welfare has become a concern in terms of fish well-being and aquaculture production [2], [3]. The definition of fish welfare has led to debate worldwide and consequently to the creation of legislations and guidelines, concerning the general status of fish welfare [4]–[7]. An individual fish is in a good state of welfare, if it is healthy, comfortable, well-nourished, safe and able to express natural behavior with the surrounding ambient. Also, avoiding negative effects such as pain, fear and stress are indicators of good fish welfare [8].
Stress is a major factor that influences fish welfare. Fish have mechanisms necessary to cope with harmful stimuli (or stressors) through physiological and behavioral stress responses [9]. Divided in three stages, primary responses evoke the release of hormones such as cortisol and adrenaline into the blood. Short-term (low duration) secondary responses are triggered immediately with metabolic changes and increased heart and ventilation rate, which make fish better able to cope with the stressor. However, if fish cannot cope with the stressor, longer-term tertiary responses evoke changes detrimental to fish welfare, including adverse changes in behavior, immune function, growth, reproduction, disease resistance and may cause mortality. Stress can evoke any of the responses, directly or indirectly, depending on the magnitude, frequency and duration of the stressor. Stressors can be physical (e.g. aquaculture practices such as handling, capture, confinement and transport), chemical (e.g. toxic heavy metals) and perceived (e.g. undesirable sounds and the presence of predators) [10].
The concern about fish welfare in aquaculture has evoked the importance to create or develop methods and techniques to measure some stress indicators. The main indicators are the concentration level of plasma cortisol, color changes in fish body, heart and ventilation rate, and changes in behavior of the fish. Monitoring welfare of farmed fish requires effective, simple, accurate, economical and practical systems [11].
3 Fish release cortisol into the water via gills, bile and urine [12]. Laboratorial methods such as radioimmunoassay, enzyme-linked immunosorbent assay and high-performance liquid chromatography are used to assess cortisol release rate [12]–[14]. Water samples are extracted and measured outside the tank, without disturbing the fish, being a great advantage to measure free cortisol with a non-invasive method. However, the techniques are time-consuming, technical demanding, complex, expensive and not suitable to probe individual fish.
Visual methods are ones of the least invasive methods, because fish are not required to be handled or captured. Visual changes in body color and fish behavior can be observed directly by researcher’s eye or with the aid of video cameras, or indirectly by using automated image processing techniques. Stress can be quantified through body darkening (the darker is the body, the most stressed is the fish), which can be mainly observed on their skin [15]–[18] and eyes [18]–[21]. Behavioral changes are easily observed in a stressed fish. An automatic image analysis method combined with video recording was used to quantify food anticipatory behavior in fish population [22] and tracking of individual fish in two dimensions [23] and three dimensions [24]. The advantages of the visual methods and techniques are the easy implementation, high reliability and no physical contact with the fish. A potential disadvantage is related to real-time monitoring of fish because constant visual contact of fish would be required. Situations where an individual fish is located in remote zones of the tank or in highly populated environment are not suitable for visual monitoring.
Heart rate can be assessed by the operculum or directly over the heart of fish. However, heart rate is difficult to assess and requires invasive methods. Four sensors providing the least invasive methods to monitor heart rate are electrocardiogram [25]– [30], Doppler [25], pulse oximeter [27] and ultrasonography [27]. The use of the sensors has been impracticable underwater, which means fish must be captured and removed from the tank to apply the sensors and requires fish to be sedated for the surgical procedures. However, the development of a wearable, flexible and waterproof sensor applied in free-swimming fish [30] shows potential for an effective, real-time and long-term underwater monitoring and the procedure does not require anesthesia on fish. However, the device coupled to the fish body is large and difficulties come when the sensors are applied on a population. Heart rate techniques uses expensive, complex equipment which with low
4 portability. Also, in order to assess heart rate, fish need to be handled and captured from the environment.
The ventilation rate can be assessed manually by measuring the opercula beat rate of fish, which is easily measured by visually observing the operculum and manually counting the beats per minute [31]. However, the method is only possible in smaller environments and larger fish. Furthermore, the automatic assessment of the ventilation rate provides the possibility to monitor free-swimming fish through low-cost and reliable sensors such as the electromyogram [32], [33] and accelerometers [34], [35]. The ventilation rate assessment is non-invasive, inexpensive and does not require sophisticated equipment to monitor free-swimming fish. However, ventilation rate does not reflect the stress level, only shows whether fish are stressed or not.
The sensor is integrated in a tag with an antenna to transmit the measured data remotely through telemetry techniques. The term telemetry is defined as the wireless transmission of data acquired by single or multiple sensors, from a transmitter to a receiver placed at some distance away. The transmitter is usually an electronic tag attached to the fish, containing the sensing circuitry coupled with an antenna. Electronic tags can be either active, where tags require an internal battery, or passive, where tags require energy from an external source, in order to power their circuits. There are five common electronic tags used in telemetry, radio tag, acoustic tag, data storage tag, pop-up satellite archival tag and passive integrated transponder [36]. The tags are relatively expensive, but in many cases, some of the collected types of data cannot be provided by other methods. The most suitable tag is the one which lasts longer, the cheaper and smaller one with a variety of sensors and a long read range.
The proposed method for the system of this thesis is the passive integrated transponder, more specifically the RFID tag, which is very popular among the tags commercially available. The feature of the RFID tag having no battery is the key, which dramatically reduces the cost and size of the tag and provides the possibility to monitor fish of all sizes for over a year. Also, since the aquaculture tank is a relatively small system, the proposed system is highly suitable. All efforts to optimize the system are necessary in order to transmit continuously sensor data in any spatial point in the aquaculture tank at any moment, providing so the real-time system.
5
Chapter 2
UNDERWATER RFID TELEMETRY
Summary
This chapter provides a review about radio frequency identification (RFID) technology used in PIT tags. The fundamental elements which compose a RFID system are described in detail as well as some factors contributing to a better performance of the system. A review about the application of RFID systems underwater is also provided.
Introduction
Radio frequency identification (RFID) is a wireless technology which uses radio frequency (RF) signals for communication between the device attached to objects or animals (including humans), and a receiving equipment placed at a distance away. RFID technology does not require the transmitter to be in direct contact or in line-of-sight with a receiver in order to transmit data. Comparing with conventional methods of identification such as bar-code and optical character recognition systems, RFID technology provides several advantages. Higher read range, identification of devices in remote locations, reliable reading in harsh environments, faster data transmission and the possibility of reading multiple devices at the same time are some of the advantages [37]. RFID technology provides a wide range of applications such as access control, electronic toll collection and animal identification, tracking and sensing [38].
Architecture of the RFID system
A RFID system is composed of three fundamental elements, the tag, the reader and the computer (also called as host computer). The reader interrogates a tag by transmitting a RF signal and waits for tag response. The reader receives the tag signal and sends the information to the host computer for further processing. The communication between reader and tag is made via two antennas, each antenna attached to either reader or tag. Figure 2.1 shows a schematic diagram of a typical RFID system.
6 Fig. 2.1 – Schematic diagram of the RFID system [39].
Tags
The RFID tag is a data carrier device which contains a chip and an antenna. The chip processes received information by demodulating a RF signal and storing the data in memory. For data transmission, the chip modulates a backscatter RF signal with other information already stored in memory to the reader. The antenna is used for transmitting and receiving the RF signal and also collects energy from the reader [40]. Tags have a wide variety of sizes, shapes and protective housings, including circular plastic disks, rectangular smart cards or cylindrical fiber glass as shown in figure 2.2.
7 Fig. 2.2 – Photograph of different types of RFID tags, developed by Texas InstrumentsTM [41].
RFID tags can be active, passive or semi-passive. Active tags have a battery and can transmit RF signals to the reader using a far-field antenna. Passive tags do not have battery and can collect energy transmitted by an interrogation of the RFID reader through a near-field antenna and transmits a backscatter RF signal to the reader using the obtained energy. Passive tags are smaller, lighter, cheaper and more long-lasting than active tags. However, passive tags have a shorter transmission range comparing with active tags. Semi-passive tag contains an internal battery like an active tag to be used for measuring sensor data in the tag. In order to conserve battery life, some semi-passive tags act as passive tags by waiting for an interrogation of the reader to transmit back data. Semi-passive tags have the middle transmission range, size and cost, but may have the worst battery lifetime [38].
Readers
The RFID reader is an equipment which reliably reads the RF signal of tags within the range and communicates the results to the host computer. The reader interrogates the tag by transmitting a modulated RF signal with enough energy to activate the tag chip, perform data processing and transmit back data stored in the chip. The reader receives the backscatter RF signal from the tags and examines the tag data [40].
8 RFID readers comprise two functional blocks, the RF module and the control module. The RF module provides energy to the tags using RF field and performs the modulation/demodulation of the RF signal to/from the tag. The control module communicates and executes the commands sent by the host computer, codes and decodes the signal and have communication control with tags [38]. The two modules are represented in figure 2.3.
Fig. 2.3 – Photographs of the individual modules of a RFID reader, developed by Texas InstrumentsTM. (a) RF module [42] (b) Control module [43].
RFID readers can be fixed or mobile. Fixed readers are placed in a specific interrogation zone which can be deeply controlled, allowing a highly defined reading area for when tags go in and out of the interrogation zone. Mobile readers provides dynamic reading in various locations although the reading area is lower and not highly defined. Mobile readers can be hand-held or mounted on carts or vehicles [40].
Host computer
The host computer provides an interface between the RFID reader and the user, being useful for processing and monitoring data collected by the reader. The RFID system, along with all hardware elements, comprises several software elements. Two important software elements are the firmware and the application. The firmware is a software with control operations and basic functions to be performed in the reader and the tag. The firmware is composed and uploaded inside the microcontroller of the reader or the tag by the host computer and may be upgraded to fix errors, add new functionalities
9 and improve stability. The application is a program with a set of instructions designed for the host computer to perform specific operations for the user, such as accessing, analyzing and monitoring data collected by the reader. Data can be accessed directly from the reader or from a database where data was previously stored. A graphical user interface (GUI) application allows users to interact directly with the RFID system [44].
Antennas
Both tag and reader have an antenna. The shape of the antenna may be squared, rectangle, circular, ellipse, hexagonal, or spiral. The size of the antenna usually depends on the wavelength. For a large wavelength, a true antenna emitting low-frequency radio waves is difficult to build. Alternatively, smaller sized loop antennas resonating at the frequency of interest are widely used and is basically a wire winded around, making a coil [45]. Figure 2.4 represents the different loop antennas with varied sizes and shapes.
Fig. 2.4 – Photographs of different loop antennas in shape and size for tags, developed by Texas InstrumentsTM [41].
There are two types of loop antennas, gate antennas and stick antennas. A typical gate antenna is a rectangular or circular loop antenna which provides larger magnetic field than stick antennas, having higher read range. However, the strength of the magnetic field is weaker, mainly close to the antenna. The gate antenna is normally applied in pass-through arrangements for applications such as anti-theft retail store and animal identification in livestock. Stick antennas are generally smaller loop antennas, which are winded around a ferrite rod with magnetic properties, increasing the strength of the magnetic field in the vicinity of the antenna. Stick antennas are used in close-range systems, for applications such as animal or object identification using mobile reader or antenna [46]. Gate and stick antennas with varied sizes are represented in figure 2.5.
10 Fig. 2.5 – Photograph of three gate loop antennas of different sizes behind two stick loop antennas of the reader, developed by Texas InstrumentsTM [46].
The communication between reader and tag antennas is mainly done through methods of energy coupling. Inductive coupling is one method, which involves the reader antenna generating a magnetic field, produced by alternating current (AC) flowing through reader antenna. The strength of the magnetic field varies in time, resonating at the frequency of interest. When the time-varying magnetic field is passing through the tag antenna, an AC voltage is induced across the tag antenna terminals, which is rectified and filtered to get the direct current (DC) voltage. The DC voltage is stored in a capacitor to be used to activate the chip and sensors of the tag when the voltage reaches a certain level. The activation and successive transmission of the backscatter RF signal from the tag to the reader depends on the read range of the system. Read range is considered to be the maximum distance between reader and tag antennas to reliably communicate with each other [47]. The principle of inductive coupling is represented in figure 2.6.
11 Fig. 2.6 – Principle of inductive coupling between reader and tag antennas [47].
A great advantage for inductive coupling is magnetic field does not require line-of-sight, because the flux lines cross most of the common materials. However, the strength of the magnetic field on tag is attenuated sharply over distance away from the reader as 1/r3, where r is the distance between the reader and the tag. Also, inductive coupling requires large antennas and does not provide a well-defined reading area. The coupling between tag and reader is not uniform in all locations inside the area.
Loop antennas use inductive coupling between reader and tag, detecting RF signals in various different frequencies. Equation 2.1 calculates the strength of the magnetic field at a spatial point z from a circular loop antenna [45].
𝐵𝑧 = µ0𝐼𝑁𝑎
2
2√(𝑎2 + 𝑟2)3 (2.1)
In equation 2.1, Bz is the strength of the magnetic field at a specific point z in Webers per square meter (Wb/m2), µ0 is the absolute magnetic permeability of the vacuum (4π*10-7)
in Henrys per meter (H/m), I is the AC current flowing through the antenna in Amperes (A), N is the number of loops of the antenna, a is the radius of the loop in meters (m) and
r is the radial distance in meters (m) between the center of the loop and the spatial point
where magnetic field is determined. According to equation 2.1, the strength of the magnetic field is directly proportional to the AC current of the transmitting antenna, but falls off rapidly over distance away from the antenna.
12 To maximize energy transfer between the reader and the tag, LC (inductance-capacitance) resonance circuits in the reader and also in the tag are required. The resonance frequency of the system need to be tuned for both circuits by changing the inductance and capacitance to the desired values [48]. Figure 2.7 represents the LC circuit of reader and tag.
Fig. 2.7 – LC circuits of reader and tag. The inductor is the antenna itself and the capacitor is connected in series or in parallel to the antenna. The reader has the capacitor in series with the antenna for maximizing current through the antenna. The tag has the capacitor in parallel with the antenna for maximizing induced voltage in the tag antenna [48]. Inductance is mainly influenced by size, shape, number of loop turns and wire length of the antenna, among other factors. Capacitance is influenced just by an equivalent circuit of capacitors in the antenna terminals. Equation 2.2 calculates the resonance frequency for both reader and tag LC circuits [46].
𝑓0 =
1
2𝜋√𝐿𝐶 (2.2)
In equation 2.2, f0 is the resonance frequency in Hertz (Hz), L is the inductance in Henrys (H) and C is the capacitance in Faradays (F).
The system amplifies oscillations within a particular bandwidth centered by the resonance frequency, while reducing oscillations at the other frequencies outside the bandwidth. The efficiency of the system is determined by quality factor Q, a parameter of the antenna which characterizes the rate of stored energy relative to the dissipated energy of the resonance circuit. A high Q antenna provides way higher output RF power than low Q antennas, for the same input power, thus high Q antenna provides better efficiency and higher read range [46]. Equation 2.3 calculates the quality factor of the antenna.
13 𝑄 =𝑓0
𝐵 (2.3)
In equation 2.3, Q is the quality factor, f0 is the resonance frequency in Hertz (Hz) and B is the bandwidth in Hertz (Hz). According to equation 2.3, a high Q antenna provides lower bandwidth than low Q antennas, filtering more undesirable signals and noise, although being less tolerant to detuning. Figure 2.8 represents the RF output power of two antennas with different quality factor [46].
Fig. 2.8 – The RF output power of a high Q antenna is compared with the RF output power of a low Q antenna. The parameter f0 is the resonance frequency of the system [46].
Equation 2.4 calculates the quality factor of the antenna in terms of resistance and inductance [46].
𝑄 =2𝜋𝑓0𝐿
𝑅 (2.4)
In equation 2.4, Q is the quality factor, f0 is the resonance frequency in Hertz (Hz), L is
the inductance in Henrys (H) and R is the resistance of the antenna in Ohms (Ω). According to equation 2.4, the quality factor is inversely proportional to the resistance of the antenna. The type of wire determines the resistance of the antenna and consequently the quality factor. A type of cable with low resistance used to build a high Q antenna is litze wire, which uses multiple insulated wire strands twisted as close together as possible and then is used silk to cover the wire strands. For low Q antennas, the insulated transformer wire with high resistance is used [46].
14 The induced AC voltage across the antenna is also a product of the quality factor of the antenna. Equation 2.5 calculates the induced voltage in the tuned antenna [45].
𝑉0 = 2𝜋𝑓0𝑁𝑆𝑄𝐵0cos ∝ (2.5)
In equation 2.5, V0 is the induced AC voltage in the antenna terminals in Volts (V), f0 is the resonance frequency of the system in Hertz (Hz), N is the number of loops of the antenna, S is the area of the loop antenna in square meters (m2), Q is the quality factor of
the antenna, B0 is the strength of the magnetic field in Webers per square meter (W/m2) at the point where the receiver antenna is located and α is the angle of the antenna relative to the receiving magnetic field flux lines. According to equation 2.5, the induced AC voltage across the tag antenna terminals is dependent on the strength of the magnetic field generated by the AC current which flows through the reader antenna. A tuned large high
Q reader antenna increases the induced AC voltage across the tag antenna terminals,
which increases read range.
RFID operating frequencies
RFID systems operate in several frequency bands, ranging between low frequency (LF), high frequency (HF), ultra high frequency (UHF) and microwaves.
LF systems operate between 100 and 500 kHz, being generally operated at 125 kHz in applications such as access and inventory control, and vehicle immobilizers, and 134.2 kHz in animal identification and tracking. One great advantage about LF systems is the low interference with materials present around the system such as water, metals and electrical power sources. LF systems have short read range, large antennas, low cost, small read rate and have poor ability to detect multiple tags [38].
HF systems operate between 10 and 15 MHz, being generally operated at 13.56 MHz in applications such as access and library control, items and case tracking, and smart-cards. The antennas are smaller than in LF systems and have good ability to detect multiple tags. Also, the cost, read range and read rate of the HF systems are higher than in LF systems. However, HF systems has some interference issues, mainly with metal [38].
UHF systems operate between 0.4 and 1 GHz, being generally operated at 433 MHz for active tags and 860-960 MHz for passive tags. UHF systems uses shorter
15 antennas than in LF and HF systems in applications such as electronic toll collection and case, pallet and container tracking. Due to their larger bandwidth, UHF systems provides a high read range, high read rate and great ability to read multiple tags. However, line-of-sight is required for the communication between reader and tags. Also, UHF systems are expensive and have interference issues with materials in close proximity such as metal and water [38].
Microwave systems operate between 2.4 and 6.8 GHz, being generally operated at 2.45 GHz using passive tags and 5.8 GHz using active tags. Microwave systems are used in applications such as electronic toll collection and case, pallet and container tracking and are also used by systems such as Bluetooth and Wi-Fi. Microwave systems have basically the same characteristics as UHF systems, only provide the fastest read rate and the longest read range, although the cost is higher due to the use of active tags [38].
RF communication protocols
The RF communication protocol provides a way of communication between the reader and tag in order to transfer reliably data. The two most used protocols are Full-Duplex (FDX) and Half-Full-Duplex (HDX) protocols.
Full-Duplex (FDX) is a communication protocol able to have data travelling bi-directionally at the same time. The reader interrogates the tag by sending energy and data, and the tag responds back while being powered by the RF field still activated by the reader [49]. The typical modulation used on FDX is amplitude shift keying (ASK), as shown in figure 2.9.
Fig. 2.9 – FDX operation. The TX is the reader and the RX is the tag. In ASK, the reader transmit a continuous RF signal and the tag sends an amplitude modulated signal. A high envelope is a binary code ‘1’ and a low envelope is a binary code ‘0’ [49].
16 The advantages of using FDX is the fast data transmission rate, where tag may transmit immediately continuous data and can be read more quickly and more often. However, the disadvantages of FDX are the high susceptibility to atmospheric noise due to the use of ASK, in which the noise may influence the amplitude of the signal and transmission of data is not highly reliable. Also, there are first read issues where FDX systems have to make multiple reads and compare the results [49].
Half-Duplex (HDX) is a communication protocol able to have data travelling bidirectionally. However, the communication does not travel in both directions at the same time. Instead, the reader interrogates the tag by sending energy and data, and the tag only responds back when the reader deactivates the RF field, after a pre-defined period. While waiting to transmit data, the tag stores the energy in a capacitor to be used later [49]. The typical modulation used on HDX is frequency shift keying (FSK), as shown in figure 2.10.
Fig. 2.10 – HDX operation. The TX is the reader and the RX is the tag. In FSK, the reader transmits a periodic RF signal and the tag sends a frequency modulated signal. The tag sends 0’s nearly in the resonance frequency and 1’s in a slightly lower frequency [49].
The advantage of using HDX is the low susceptibility to atmospheric noise because HDX tags use FSK which is not influenced by signal amplitude, being less sensible to noise. Besides, during tag transmission period there is no interference from reader RF field. Therefore, HDX tags are usually large tags with increased read range. Also, HDX reader only have to read a tag once, because 16-bit checksum validates the data and ensures the read is good. Also, HDX reader requires less power. However, the disadvantage of the HDX is slow data transmission rate, because the tag cannot transmit data immediately while the reader RF field is still activated. The period of the RF field
17 time can be shorten in order to increase the tag read rate, but the tag may not get enough energy to transmit data, decreasing reliability [49].
Factors affecting the read range
For inductive coupling systems, the read range depends on several factors. One of the critical aspects of the read range is the size of the reader and tag antennas. The larger is the antenna, the higher is the read range. However, when antennas get too large, they may collect more noise and the performance may decrease, which can have shorter read range than smaller antennas [46]. Also, increasing the size of the antenna may introduce difficulties to balance the LC circuits with extreme values. Other factor increasing read range is the RF power of the reader, where increased power may increase RF field and does not result in increased noise. However, there are limitations about the increase of both antenna size and RF power of the reader due to regulatory issues in order to operate without interferences with other systems [50].
One factor which reduces the read range is the environmental noise generated by power sources such as inverters, switched-mode power supplies and electric motors. The increased noise implies the tag to get closer to the reader antenna in order to be detected. Other factor is the used communication protocol, where FDX provides shorter read range than HDX due to high susceptibility to noise provided by ASK. Also, the presence of metals near the system may detune the resonance frequency, by changing the inductance of the antenna and thus reducing read range [50]. Figure 2.11 represents the detrimental effect of the presence of metal on the RF field of the reader antenna.
Fig. 2.11 – Detrimental effect of the presence of metal on magnetic field [51]. (a) The magnetic field is produced by a wire in an environment without metals. (b) The lines of the magnetic field are distorted by the presence of metal, causing a non-readable area.
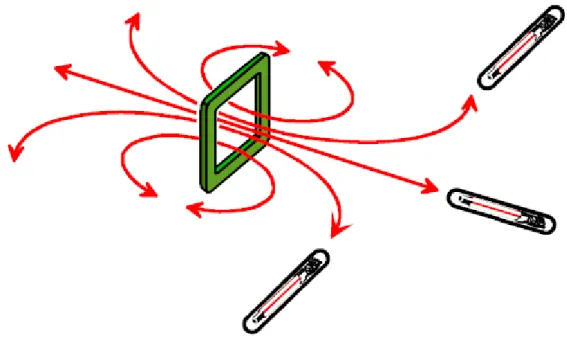
18 At last, the presence of the reading holes is another factor which reduces the read range of the system. Reading holes are areas within the reader RF field where communication between antennas is not possible, due to tag orientation (the angle of the tag antenna relative to the plane of the reader antenna). For example, at a specific point within the RF field, an “in-parallel” tag (the antenna is in parallel relative to the reader antenna) may be detected by the reader, while an “in-perpendicular” tag (the antenna is in perpendicular relative to the reader antenna) may not be detected, being positioned into a reading hole. There are possibilities for a tag to be relatively close to the reader antenna in some orientations and still not be read [50]. Figure 2.12 represents the magnetic field pattern of the reader antenna.
Fig. 2.12 – Magnetic field lines of the reader antenna. The reader antenna couples with two “in-perpendicular” tags and one “in-parallel” tag in different positions. The maximum distance of the read range is obtained with the “in-parallel” tag antenna [46].
Reading holes change position, depending on the tag orientation. Figure 2.13 represents the readout pattern of the system for different tag orientations.
19 Fig. 2.13 – Readout pattern of the system for the different tag orientation angles [52]. (a) 0º tag orientation (“in-parallel” tag). (b) 30º tag orientation. (c) 60º tag orientation. (d) 90º tag orientation (“in-perpendicular” tag).
Other way to increase the read range is using two or more gate antennas on reader, making a multi-antenna system. When the two antennas are connected in parallel or in series, the reader interprets them as a single antenna. The magnetic field distribution changes and assures better transfer of energy between the loops. There are two antenna connections for the multi-antenna system, when antennas are connected in phase (“in-phase” connection) and when antennas are connected “out-of-(“in-phase” (“out-of-(“in-phase” connection) [46].
When two antennas are connected in phase, the currents in the two antennas are flowing in the same direction, resulting in the cancellation of the magnetic field in the x-axis in the region between the two antennas [53]. This connection generates a certain pattern of the magnetic field lines between antennas as represented in figure 2.14.
(a) (b)
20 Fig. 2.14 – “In-phase” connection. (a) Opposing gate antennas whose respective currents are flowing in the same direction (adapted from [53]). (b) Resulting magnetic field pattern, easily detecting three “in-parallel” tags in the field [46].
When two antennas are connected “out-of-phase”, the currents in the two antennas are flowing in the opposite direction, resulting in the cancellation of the magnetic field in the y-axis in the region between the two antennas [53]. This connection generates a different pattern of the magnetic field lines between antennas relative to the “in-phase” connection, as represented in figure 2.15.
Fig. 2.15 – “Out-of-phase” configuration. (a) Opposing gate antennas whose respective currents are flowing in opposite directions (adapted from [53]). (b) Resulting magnetic field pattern, detecting two “in-perpendicular” tags [46].
The two gate antennas designed for pass-through arrangement are separated by a distance. If the distance is too large, the strength of the magnetic field in the middle region may be too weak to activate the tag [54]. However, if the distance is too close, mutual coupling between two or more reader antennas would occur, which may interfere on the system and decrease read range. There are two options to minimize mutual coupling.
(a) (b) (a) (b) x y z x y z
21 First, placing the antennas “in-perpendicular” to each other, the magnetic field patterns would not overlap to each other, but rather cross, having no interference. Second, the “nulling-out” technique can be applied, which is an optimization technique to measure the optimal distance between the reader antennas where mutual coupling is nullified. The technique proceeds by connecting one antenna to the system, working as a single-antenna system and connecting the other antenna to an oscilloscope to measure the induced voltage. Moving away the second antenna until the induced voltage by the system with the first antenna is nullified, gives the optimal distance [50].
Underwater communication
The biggest issues to overcome when using RFID systems in aquatic environments are the severe effects of radio waves when travelling underwater. However, the transmission of radio signals underwater is possible and the underwater travel distance of radio waves depends mainly on two factors, the conductivity of the water and the frequency of the radio wave. Salinity affects the conductivity of the water. The more saline is the water, the shorter is the travel distance of radio waves underwater. At saltwater, the conductivity ranges from around 2 S/m to around 6 S/m, where average conductivity is normally considered about 4 S/m. At freshwater, the conductivity ranges from around 0.003 S/m to around 0.3 S/m, where average conductivity is normally considered about 0.15 S/m [55].
Skin depth is a measure of how deep electromagnetic waves can penetrate into a material, being defined as the depth at which the intensity of the radiation inside the material falls to 1/e (about 37%) of its original value at the surface [55]. Equation 2.6 calculates the skin depth of the electromagnetic wave.
δ = 1
√𝜋𝑓𝜇𝜎 (𝑚) (2.6)
In equation 2.6, f is the frequency of the electromagnetic wave in Hertz (Hz), μ is the absolute magnetic permeability of the vacuum (4π*10-7 H/m) in Henrys per meter (H/m)
and σ is the conductivity of the water in Siemens per meter (S/m). According to equation 2.6, the lower are both frequency and conductivity, the higher is the skin depth [55].
22 Table 2.1 represents the theoretical values of the skin depth calculated for one representative value of each operating RF range (LF, HF, UHF, microwave) and average conductivity of freshwater and saltwater, respectively.
Table 2.1 – Theoretical results of the skin depth.
RF range Frequency Freshwater conductivity (0.15 S/m) Saltwater conductivity (4 S/m)
LF 134.2 kHz 3.55 m 69 cm
HF 13.56 MHz 35 cm 6.8 cm
UHF 960 MHz 4.1 cm 8.1 mm
Microwave 2.45 GHz 2.6 cm 5.1 mm
For LF range, the skin depth for freshwater conductivity is a great result for long-range applications implemented underwater and even the skin depth for saltwater conductivity is still a considerable result to implement a LF system underwater.
For HF range, the skin depth for freshwater conductivity is a reasonable result for RFID systems implemented in small aquatic environments. However, the skin depth for saltwater conductivity is small, which can be implemented some close-range applications.
For UHF and microwave ranges, the skin depth for freshwater conductivity are relatively smaller than for the HF range, which can be used in close-range applications. However, the skin depth for saltwater conductivity is extremely small, which can be used in contact-only applications with the antenna of the device placed on the water surface.
In conclusion, theoretical results suggest several solutions when RFID is required for underwater applications. However, the values obtained for the skin depth are ideal values and essentially represent an upper bound. In most cases, the system present practical read range values considerably lower. To obtain reliable results in underwater applications, the chosen operating frequency should be as low as possible. Therefore, LF RFID systems are the most suitable to be implemented underwater.
Practical underwater applications using RFID systems
Practical applications for tracking objects and animals underwater has been implemented. LF systems has been used to track fish and pebbles in aquariums, rivers and oceans.
The first application is a 134.2 kHz LF RFID system applied in aquariums where tagged fish approaching the antenna placed outside are identified and all information from its species is displayed on the screen. The application was placed in saltwater and
23 managed to achieve a read range up to 22 cm. The read range is relatively low due to the high conductivity of the water, so the biologists expected to increase the read range by changing the position or the design of the antenna. The biologists tried to put the antenna inside the tank, using a pipe waterproof made of polyvinyl chloride. The biologists also tried multiple antenna shapes, including circular (60 cm diameter), rectangular (30 cm * 120 cm) and also a vertical straight line [55]. Figure 2.16 represents a demonstration of the implemented system with a circular antenna placed near the aquarium.
Fig. 2.16 – Animal tracking in an aquarium, using a circular antenna [55].
Another application is a 125 kHz LF RFID system applied on a gravel beach where tagged pebbles were identified for the monitoring of coastal dynamics. One of the goals of the application was to achieve the largest read range possible in saltwater [55]. The tagged “Smart Pebble” and the respective identification operations underwater are represented in figure 2.17.
Fig. 2.17 – Environmental tracking of a coastal dynamics [55]. (a) A “Smart Pebble”. On its surface is possible to notice a dark hole housing the tag. (b) A moment of the identification operations.
24 The geologists first tested different tag types such as plastic discs and fiber glass cylinders in laboratory environment, which tried to simulate as much as possible the real environmental conditions [55]. Table 2.2 represents the read range values for different types of tags under ideal conditions (outside water) and real conditions (underwater).
Table 2.2 – Read ranges of different LF tags [55].
Tag housing Ideal conditions Real conditions
Transparent disc 50 cm 38 cm
Long glass cylinder (34 mm) 65 cm 56 cm
Short glass cylinder (14 mm) 42 cm 36 cm
Results from saltwater are great results, comparing with ideal results outside saltwater. The results are in accordance with the theoretical analysis, where the achieved read range is lower than the theoretical skin depth of LF systems in saltwater (69 cm), which acts then as an upper bound. This solution has been implemented on different beaches, where the effective use of the system has achieved great results, comparing with the results measured in the laboratorial tests. The tags placed inside the pebbles were located even from distances higher than 50 cm [55].
Achieving a great read range underwater is possible and is influenced mainly by the following factors, low frequency and low conductivity (134.2 kHz and freshwater, respectively), using RF communication protocol that uses frequency modulation (HDX), large size antennas (for tag and reader), high RF power and using multiple antennas on the system. Also, some factors which may decrease the read range such as the presence of nearby metals and reading holes to the RF field should be also taken into account. This system may provide long-term, low-cost and battery-less circuit that can be implemented underwater, giving the opportunity to measure fish stress indicators in real time that may minimize fish welfare concerns.
![Fig. 2.4 – Photographs of different loop antennas in shape and size for tags, developed by Texas Instruments TM [41]](https://thumb-eu.123doks.com/thumbv2/123dok_br/18876539.931956/24.892.131.764.501.735/fig-photographs-different-antennas-shape-developed-texas-instruments.webp)
![Fig. 2.15 – “Out-of-phase” configuration. (a) Opposing gate antennas whose respective currents are flowing in opposite directions (adapted from [53])](https://thumb-eu.123doks.com/thumbv2/123dok_br/18876539.931956/35.892.135.759.112.353/configuration-opposing-antennas-respective-currents-flowing-opposite-directions.webp)
![Fig. 2.17 – Environmental tracking of a coastal dynamics [55]. (a) A “Smart Pebble”. On its surface is possible to notice a dark hole housing the tag](https://thumb-eu.123doks.com/thumbv2/123dok_br/18876539.931956/38.892.137.745.800.1018/environmental-tracking-coastal-dynamics-pebble-surface-possible-housing.webp)
![Fig. 3.8 – Example of a pulse width cycle (adapted from [42]). (a) Pulse width ratio of 50%](https://thumb-eu.123doks.com/thumbv2/123dok_br/18876539.931956/48.892.173.721.109.356/example-pulse-width-cycle-adapted-pulse-width-ratio.webp)