INTRODUCTION
Non-alcoholic fatty liver disease (NAFLD) is increasingly di-agnosed worldwide and is the most prevalent chronic liver disease in both developed and developing countries ranging from simple steatosis and steatohepatitis to fibrosis and long-term complica-tions like cirrhosis and hepatocellular carcinoma(1,2,3). Therefore, early assessment of extent of hepatic steatosis and monitor dur-ing therapy are important. The gold standard method to detect hepatic steatosis and steatohepatitis is liver biopsy but it has some limitations like sampling errors, intra- and inter-observer variability, invasiveness of the procedure and major complications like bleeding(4). To avoid these limitations of liver biopsy and to quantify the hepatic steatosis, controlled attenuation parameter (CAP) being implemented on Fibroscan has been introduced as a non-invasive method in order to evaluate both steatosis and fibrosis simultaneously(5), and is reported to be highly sensitive in detecting low grade steatosis as fat deposition ≥10%(6). Several bi-opsy-controlled clinical studies showed that CAP can adequately detect and quantify hepatic steatosis(7,8,9). Lifestyle modification
Measurement of controlled attenuation parameter:
a surrogate marker of hepatic steatosis in patients
of nonalcoholic fatty liver disease on lifestyle
modification – a prospective follow-up study
Jayanta
PAUL
, Raj Vigna
VENUGOPAL
, Lorance
PETER
, Kula Naresh Kumar
SHETTY
and Mohit P
SHETTI
Received 17/7/2017 Accepted 5/9/2017
ABSTRACT – Background – Liver biopsy is a gold standard method for hepatic steatosis assessment. However, liver biopsy is an invasive and painful procedure and can cause severe complications therefore it cannot be frequently used in case of follow-up of patients. Non-invasive assessment of steatosis and fibrosis is of growing relevance in non-alcoholic fatty liver disease (NAFLD). To evaluate hepatic steatosis, transient elastography
with controlled attenuation parameter (CAP) measurement is an option now days. Objective – Aim of this study is to evaluate role of measurement
of controlled attenuation parameter, a surrogate marker of hepatic steatosis in patients of nonalcoholic fatty liver disease on lifestyle modification.
Methods – In this study, initially 37 participants were included who were followed up after 6 months with transient elastography, blood biochemical
tests and anthropometric measurements. The results were analyzed by Multivariate linear regression analysis and paired samples t-test (Dependent
t-test) with 95% confidence interval. Correlation is calculated by Pearson correlation coefficients. Results – Mean CAP value for assessing hepatic
steatosis during 1st consultation (278.57±49.13 dB/m) was significantly improved (P=0.03) after 6 months of lifestyle modification (252.91±62.02
dB/m). Only fasting blood sugar (P=0.008), weight (P=0.000), body mass index (BMI) (P=0.000) showed significant positive correlation with CAP.
Only BMI (P=0.034) and weight (P=0.035) were the independent predictor of CAP value in NAFLD patients. Conclusion – Lifestyle modification
improves the hepatic steatosis, and CAP can be used to detect the improvement of hepatic steatosis during follow-up in patients with NAFLD on lifestyle modification. There is no relation between CAP and Fibroscan score in NAFLD patients. Only BMI and weight can predict CAP value independently.
HEADINGS – Fatty liver. Biopsy, adverse effects. Elasticity imaging techniquesm, utilization. Life style.
Declared conflict of interest of all authors: none Disclosure of funding: no funding received
Department of Gastroenterology, Manipal Hospital, Bangalore, India.
Correspondence: Jayanta Paul. Department of Gastroenterology, Manipal Hospital, Bangalore, India. E-mail: [email protected]
including weight loss and increased physical activity is vital in managing NAFLD patients irrespective of their underlying liver histology. There is no research using CAP values to assess effect of lifestyle modification on hepatic steatosis in Indian population with non-alcoholic fatty liver disease.
Therefore, the aim of this study is to evaluate role of measure-ment of controlled attenuation parameter, a surrogate marker of hepatic steatosis in patients of nonalcoholic fatty liver disease on lifestyle modification.
METHODS
Study design and study population
CAP value (dB/m) Hepatic steatosis (S0) CAP<238dB/m Hepatic steatosis (S1) CAP>238dB/M Hepatic steatosis (S2) CAP>260dB/m Hepatic steatosis (S3) S3≥ 293 dB/m
Transient elastography score (kPa) 252.91 ± 62.02 dB/m N=15 (42.85%) N=4 (11.43%) N=8 (22.86%) N=8 (22.86%)
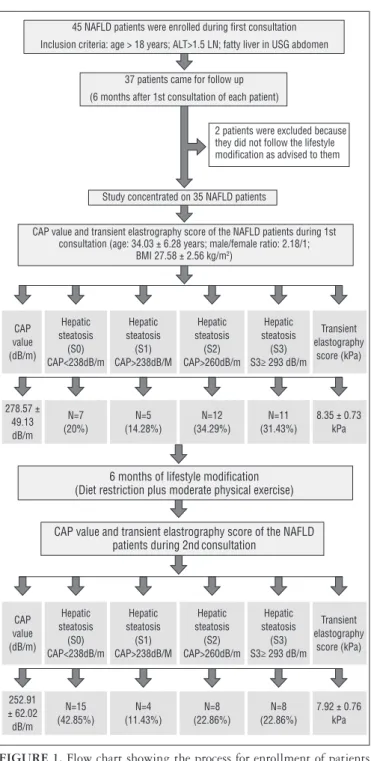
7.92 ± 0.76 kPa 45 NAFLD patients were enrolled during first consultation
Inclusion criteria: age > 18 years; ALT>1.5 LN; fatty liver in USG abdomen
37 patients came for follow up
(6 months after 1st consultation of each patient)
2 patients were excluded because they did not follow the lifestyle modification as advised to them
Study concentrated on 35 NAFLD patients
CAP value and transient elastrography score of the NAFLD patients during 1st consultation (age: 34.03 ± 6.28 years; male/female ratio: 2.18/1;
BMI 27.58 ± 2.56 kg/m2)
CAP value (dB/m) Hepatic steatosis (S0) CAP<238dB/m Hepatic steatosis (S1) CAP>238dB/M Hepatic steatosis (S2) CAP>260dB/m Hepatic steatosis (S3) S3≥ 293 dB/m
Transient elastography score (kPa) 278.57 ± 49.13 dB/m N=7 (20%) N=5 (14.28%) N=12 (34.29%) N=11 (31.43%)
8.35 ± 0.73 kPa
6 months of lifestyle modification (Diet restriction plus moderate physical exercise)
CAP value and transient elastrography score of the NAFLD patients during 2ndconsultation
FIGURE 1. Flow chart showing the process for enrollment of patients and, controlled attenuation parameter value and transient elastography value before and after lifestyle modification.
Inclusion criteria
Age of the patient was >18 years, Elevated liver enzyme [ala-nine aminotransferase (ALT) levels >1.5 times of the upper limit of normal]. The upper limit of normal for ALT was defined as 35 U/L in males and 19 U/L in females(10), fatty liver in USG abdomen.
Exclusion criteria
Alcohol consumption, smoking, medications & toxins caus-ing fatty liver, autoimmune & inflammatory disease,
malnutri-tion, total parenteral nutrimalnutri-tion, severe weight loss, viral hepatitis and metabolic liver disease (Wilson’s disease, hemochromatosis, etc.), ascites, cirrhosis, chronic illness: e.g. tuberculosis, renal failure, pregnancy, gastroplasty / bowel resection / bowel bypass surgery.
Study site: Department of Gastroenterology, Manipal Hospital, Bangalore, India.
Study duration: 1 year and 3 months. Follow up evaluation (2nd consultation) has been done after 6 months of first consultation.
Methodology
Anthropometry measurements • Weight in kilograms, height in meters.
• Body mass index (BMI): BMI was calculating with the using of weight in kilograms/height in meters2.
• Blood pressure: hypertension was diagnosed when a patient had received medicine for hypertension or had systolic blood pressure ≥140 mmHg and/or diastolic blood pressure ≥90 mmHg after taking 5 min rest(11).
Others biochemical tests: blood sample was collected after an overnight fast of >12 hours.
• Fasting blood sugar.
• Total cholesterol: patients who used cholesterol lowering medication or had a total serum cholesterol level ≥200 mg/ dL were classified as having hypercholesterolemia(12).
• Serum fasting insulin.
• HOMA-IR (Homeostatic Model Assessment of Insulin Resistance) = {Fasting insulin (μU/m) × [Fasting glucose (mmol/L) /22.5]} was calculated to assess the insulin resist-ance. A HOMA-IR value of ≥2.5 is taken as an indicator of insulin resistance (IR) in adults(13).
• Alanine aminotransferase.
CAP and liver stiffness measurement
The Fibroscan equipped with the M probe placing on the skin between the ribs over the right lobe of the liver was used to capture both CAP and liver stiffness measurement (LSM) values simultaneously. CAP values and LSM values were ex-pressed in units of decibels per meter (dB/m) and kilopascal (kPa) respectively.
During measurement, patients were in supine position with the right arm in abduction. At least 10 valid measurements were obtained in one particular site from each participant. A success rate of ≥60% and the ratio of the interquartile range (IQR) of liver stiffness to the median (IQR/MLSM) ≤30% were considered reliable and used for the final analysis(14).
Steatosis was graded depending on CAP value according to a previous study(5): S1≥238 dB/m, S2≥260 dB/m, and S3≥293 dB/m.
Trans-abdominal ultrasonography
Physical activity
In this study, physical exercise was assessed by self-reported questionnaires which include questions about duration, frequency, and intensity of exercise.
We advised to do regular moderate physical activity which is defined as doing physical exercise of at least moderate intensity at least 3 days per week, for at least 45 minutes each time (The Uni-versity of California San Diego approach) for an uninterrupted duration of 6 months.
Physical activity of moderate intensity is defined by World Health Organization as requiring a metabolic equivalent task (MET) score of 3.0–6.0 and a typical activity of moderate intensity is ‘‘brisk’’ walking at 5.6 km/h on a flat surface requiring 3.8 MET(17).
Metabolic equivalent of functional capacity(18); 3 MET: brisk walking; 4 MET: raking leaves, gardening, jogging; 5 MET: climb-ing 1 flight of stairs, dancclimb-ing, bicyclclimb-ing, badminton, swimmclimb-ing; 6 MET: plying golf, carrying clubs.
Diet
Caloric intake was restricted to 25-30 kcals/kg/day of ideal body weight(19) in our study population. Patients were advised to avoid saturated fats, simple carbohydrates, sweetened drinks, ‘fast food diet’ and monitored after 6 months with self-reported questionnaires.
Statistical analysis
The Statistical Package for Social Sciences (SPSS) is used for statistical analysis. The results were analyzed by multivariate linear regression analysis and paired samples t-test (Dependent t-test) with 95% confidence interval. Correlation is calculated by Pear-son correlation coefficients. A probability value (P) below 0.05 is considered significant. Data were expressed as means ± standard deviation (SD).
RESULTS
Demographic and clinical data
Out of 35 participants, 24 (68.57%) participants were male and 11 (31.43%) participants were female. The mean age of our study population was 34.03±6.28 years. Mean age of male and female participants were 34.25±6.47 years and 33.54±6.14 years respectively.
Ten (28.57%) and four (11.42%) participants during their 1st consultation and 2nd consultation were insulin resistance respectively.
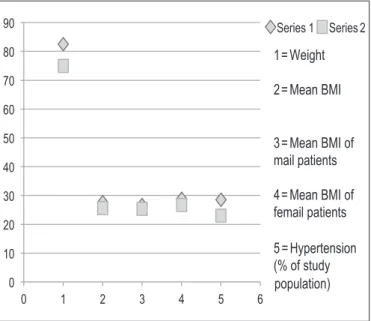
Overall mean BMI of study population at the time of 1st consultation was 27.58±2.56 kg/m2 but Mean BMI of male
partici-pants (26.95±2.29 kg/m2) was lower than the female participants
(28.95±2.70 kg/m2) (FIGURE 2).
During follow up visit after 6 months of lifestyle modification, overall BMI of study populations was 25.65±2.31 kg/m2 but BMI of
male participants and female participants were 25.27±2.26 kg/ m2
and 26.46±2.31kg/m2 respectively (FIGURE 2).
Out of 35 NAFLD patients, 10 (28.57%) and 8 (28.85%) were hypertensive during their 1st consultation and 2nd consultation respectively. During 1st visit, 17 (48.7%) participants and during 2nd consultation, 11 (31.42%) participants had hypercholester-olemia (FIGURE 3).
Effects of 6 months lifestyle modification
Mean HOMA-IR value for detection of insulin resistance of our study population during 1st and 2nd visit were 2.13±0.63 and 1.75±0.45 respectively (P=0.001) (FIGURE 3).
Mean Fibroscan value for liver stiffness during 1st consultation and after 6 months of lifestyle modification were 8.35±0.73 kPa and 7.92±0.76 kPa respectively (P=0.019).
Mean ALT value before and after 6 months of lifestyle modi-fication were 99.57±14.37 U/L and 68.51±14.70 U/L respectively (P=<0.001) (FIGURE 3).
Mean CAP value for assessing hepatic steatosis during 1st consultation (278.57±49.13 dB/m) was significantly improved (P=0.03) after 6 months of lifestyle modification (252.91±62.02 dB/m) (TABLE 1) (FIGURE 4).
FIGURE 2. Anthropometric parameters before (Series 1) and after (Series 2) lifestyle modification. BMI: body mass index.
TABLE 1. Demographic characters and clinical data of study population before and after of 6 months lifestyle modification
Demographic character and clinical data At the time of first consultation After 6 months of lifestyle modification P value
Mean age (years) 34.03 ± 6.28
Mean weight (kg) 82.42 ± 9.27 74.92 ± 8.60
---Number of patients N =35
Male N= 24 (68.57%)
Female N= 11 (31.43%)
Insulin resistance (HOMA-IR >2.5) N= 10 (28.57%) N= 4(11.42%)
---HOMA-IR value 2.13 ± 0.63 1.75 ± 0.45 0.001
Hypertension N= 10 (28.57%) N= 8 (22.85%)
---Hypercholesterolemia N= 17 (48.7%) N= 11 (31.43%)
---Mean BMI (kg/m2) 27.58 ± 2.56 25.65 ± 2.31 <0.001
Mean BMI of Male (kg/m2) 26.95 ± 2.29 25.27 ± 2.26
---Mean BMI of Female (kg/m2) 28.95 ± 2.70 26.46 ± 2.31
---ALT (U/L) 99.57± 14.37 68.51 ± 14.70 <0.001
FBS 96.28 ± 10.59 89.71 ± 9.08 0.002
Fibroscan value (kPa) 8.35 ± 0.73 7.92± 0.76 0.019
CAP (dB/m) 278.57 ± 49.13 252.91± 62.02 0.03
Hepatic steatosis (S0)* N= 7 (20%) N= 15 (42.85%)
---Hepatic steatosis (S1)* N= 5 (14.28%) N= 4 (11.43%)
---Hepatic steatosis (S2)* N= 12 (34.29%) N= 8 (22.86%)
---Hepatic steatosis (S3)* N= 11 (31.43%) N= 8 (22.86%)
---HOMA IR: homeostatic model assessment of insulin resistance; BMI: body mass index; ALT: alanine aminotransferase; FBS: fasting blood sugar; CAP: controlled attenuation parameter. *Staging of steatosis done on the basis of CAP value(28).
FIGURE 4. Controlled attenuation parameter (CAP) value and percen-tages of study population with different spercen-tages of hepatic steatosis before (Series 1) and after (Series 2) lifestyle modification.
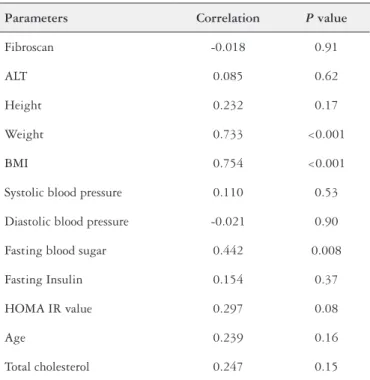
Correlations of CAP with different parameters during first consultation
Fibroscan (P=0.91), ALT (P=0.62), height (P=0.17), systolic blood pressure (P=0.53), diastolic blood pressure (P=0.90), serum fasting insulin (P=0.37), HOMA IR value (P=0.08), Total choles-terol (P=0.15) and age (P=0.16) were not significantly correlated with CAP. But fasting blood sugar (P=0.008), weight (P=0.000), BMI (P=0.000) showed significant positive correlation with CAP
(TABLE 2) (FIGURE 5).
TABLE 2. Correlation between the controlled attenuation parameter and clinical parameters
Parameters Correlation P value
Fibroscan -0.018 0.91
ALT 0.085 0.62
Height 0.232 0.17
Weight 0.733 <0.001
BMI 0.754 <0.001
Systolic blood pressure 0.110 0.53
Diastolic blood pressure -0.021 0.90
Fasting blood sugar 0.442 0.008
Fasting Insulin 0.154 0.37
HOMA IR value 0.297 0.08
Age 0.239 0.16
Total cholesterol 0.247 0.15
400.00- 350.00- 300.00- 250.00- 200.00- 150.00-CAP
I I I I I 22.50 25.00 27.50 30.00 32.50
BMI 400.00- 350.00- 300.00- 250.00- 200.00- 150.00-CAP
I I I I I I
70.00 80.00 90.00 100.00 110.00 120.00
FBS 400.00- 350.00- 300.00- 250.00- 200.00- 150.00-CAP
I I I I I
60.00 70.00 80.00 90.00 100.00
Wieght 400.00- 350.00- 300.00- 250.00- 200.00- 150.00-CAP
I I I I I I I
7.00 7.50 8.00 8.50 9.00 9.50 10.00
Fibroscan
C D
A B
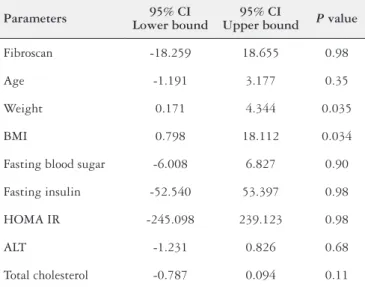
Multivariate linear regression analysis of CAP with other parameters during first consultation
Only BMI (P=0.034) and weight (P=0.035) were the independ-ent predictor factors of CAP value (TABLE 3).
CAP value is not affected by age (P=0.35), fasting blood sugar (P=0.90), fasting insulin (P=0.98), HOMA IR (P=0.98), ALT (P=0.68) and cholesterol (P=0.11).
DISCUSSION
Hepatic steatosis, particularly due to NAFLD, is common and increasing in prevalence. In around 20% patients, hepatic steatosis may progress to non-alcoholic steatohepatitis, cirrhosis, end-stage liver disease and hepatocellular carcinoma(20).
Liver biopsy, the gold standard for assessing hepatic steatosis, is rarely performed due to the trauma, sampling error, complications and imperfect reproducibility. Recently hepatic fat quantification by non-invasive methods has gained importance for the diagnosis and monitoring of hepatic steatosis. Although for detecting hepatic steatosis, ultrasound is a useful technique but it cannot be used for grading of hepatic steatosis.
Serological scoring methods such as the SteatoTest, the Fatty Liver Index (FLI)(21) and the Hepatic Steatosis Index (HSI)(22) include a number of biochemical markers and/or anthropometric parameters that have been developed in the last decade to diagnose hepatic steatosis. The FLI is an independent predictor of mortal-ity(23). Similarly, the HSI, which includes the alanine transaminase/ aspartate transaminase ratio, BMI, gender and diabetes, is associ-ated with the presence and severity of steatosis on ultrasound(22). Ultrasound is the most commonly used imaging method to detect hepatic steatosis, which is recognized by a diffuse increase in hepatic echogenicity(24). It is accepted as an initial tool for fatty liver as it is non-invasive, non-ionizing, inexpensive and widely available. Limitations of ultrasound of liver include its low sensitivity for mild steatosis (<30%)(25), operator and machine-dependence, the inability to quantify hepatic fat(24,25) and the potential for extensive fibrosis to increase liver echogenicity.
Other abdominal imaging techniques such as computed tomogra-phy (CT), magnetic resonance imaging (MRI) and proton magnetic resonance spectroscopy are expensive, not widely available, absence of standardization, and exposure to ionizing radiation in CT scan. CAP, a recently used novel and noninvasive method for both diagnosing and quantifying hepatic steatosis(6,8,26) as it has accuracy, convenience, and economic feasibility. CAP values did not appear to be influenced by inflammation, fibrosis or etiology(26).
As far as my knowledge perhaps this is the first study where the effect of lifestyle modification (including diet restriction and moderately intense physical exercise) on CAP in patients with NAFLD has been studied.
In our study, we have seen that after 6 months of lifestyle modification CAP value, a surrogate marker of hepatic steatosis has improved significantly (P=0.03). All the previous studies involving liver biopsy for the detection of hepatic steatosis in NAFLD pa-tients has showed that lifestyle modification has helped to reduce the hepatic steatosis significantly(27,28,29,30). Same result was also found in another study using abdominal ultrasonography for detection of hepatic steatosis in NAFLD patients(31).
The mean BMI in our cohort was 27.58±2.56 kg/m2 and 80% of
patients had steatosis during first consultation. In the other studies, mean BMI was 24-25 kg/m2 and 31%-58% had significant steatosis(5). Significant improvement in fasting blood sugar and HOMA-IR index (P=0.001) were noted in our study. These findings are compatible with those of previous reports(28,32).
Like the other previous studies(28,33), in our present study it has been demonstrated that there is reduction in ALT level (P<0.001) in NAFLD patients after 6 months of lifestyle modification.
In this study, there is no correlation between CAP value and Fibroscan sore in NAFLD patients.
FIGURE 5. Correlations of controlled attenuation parameter (CAP) with different parameters during first consultation. A: correlation of CAP with BMI (body mass index) (P=<0.001); B: correlation with fasting blood sugar (P=0.008); C: correlation of CAP with weight (P=<0.001); D: correlation of CAP with Fibroscan (P=0.91).
TABLE 3. multivariate linear regression analyses between controlled attenuation parameter and different parameters during first consultation
Parameters 95% CI Lower bound
95% CI
Upper bound P value
Fibroscan -18.259 18.655 0.98
Age -1.191 3.177 0.35
Weight 0.171 4.344 0.035
BMI 0.798 18.112 0.034
Fasting blood sugar -6.008 6.827 0.90
Fasting insulin -52.540 53.397 0.98
HOMA IR -245.098 239.123 0.98
ALT -1.231 0.826 0.68
Total cholesterol -0.787 0.094 0.11
CONCLUSION
Lifestyle modification improves the hepatic steatosis and CAP can be used to detect the improvement of hepatic steatosis dur-ing follow-up in patients with NAFLD on lifestyle modification. There is no correlation between CAP and Fibroscan score. CAP value is affected by weight and BMI, but age, fasting blood sugar, fasting insulin, HOMA IR value, ALT and cholesterol don’t have any effect on CAP value.
ACKNOWLEDGEMENTS
We are extremely thankful to Manipal Hospital to allow me to conduct this work. We express our gratitude to colleagues, technical
and non-technical staff of Gastroenterology department, Manipal Hospital, Bangalore because without their support conducting this research work would not have been possible.
Authors’ contributions
Paul J: substantial contributions to the conception, design of the work, the acquisition, analysis, and interpretation of data for the work. Drafting the work, revising it critically for important intellectual content and Final approval of the version. Venugopal RV: design of the work, analysis, interpretation of data for the work. Peter L: design of the work, analysis, inter, interpretation of data for the work. Shetty KNK: design of the work, analysis, interpretation of data for the work. Shetti MP: design of the work, analysis, interpretation of data for the work.
Paul J, Venugopal RV, Peter L, Shetty KNK, Shetti MP. Medição do parâmetro de atenuação controlada: um marcador substituto da esteatose hepática em pacientes com doença hepática gordurosa não alcoólica na modificação do estilo de vida – acompanhamento de um estudo prospectivo. Arq Gastro-enterol. 2018;55(1):7-13.
RESUMO – Contexto – A biópsia hepática é o método padrão-ouro para avaliação de esteatose hepática. No entanto, é um procedimento invasivo e do-loroso que pode causar complicações graves e, portanto, não pode ser usado com frequência em caso de acompanhamento dos pacientes. A avaliação não invasiva de esteatose e fibrose é de crescente relevância na doença hepática gordurosa não alcoólica (DHGNA). Para avaliar a esteatose hepática,
a elastografia transitória com parâmetro de atenuação controlada (PAC) é uma opção atual. Objetivo – O objetivo deste estudo foi de avaliar o papel
da medição do PAC, um marcador substituto da esteatose hepática em pacientes da doença hepática gordurosa não alcoólica, com modificação do
estilo de vida. Métodos – Foram incluídos inicialmente neste estudo 37 participantes acompanhados por 6 meses com elastografia transitória, testes
bioquímicos no sangue, e medidas antropométricas. Os resultados foram analisados por análise de regressão linear multivariada e emparelhado em amostras-teste t (teste t-dependente) com intervalo de confiança de 95%. A correlação foi calculada pelos coeficientes de correlação de Pearson.
Resultados – O valor do PAC para avaliar esteatose hepática durante a primeira consulta (278,57±49,13 dB/m) foi significativamente melhorado
(P=0,03) após 6 meses de modificação do estilo de vida (252,91±62,02 dB/m). Somente a glicemia de jejum (P=0,008), o peso (valor de P=0,000), o
índice de massa corporal (IMC) (P=0,000) mostraram correlação positiva significativa com PAC. Apenas o IMC (P=0,034) e o peso (P=0,035) foram
o preditores independentes de valor de PAC em pacientes com DHGNA. Conclusão – A modificação do estilo de vida melhora a esteatose hepática,
e o PAC pode ser usado para detectar a melhoria da esteatose hepática durante o seguimento em pacientes com DHGNA. Não existe relação entre o PAC e o escore do Fibroscan em pacientes com DHGNA. Só o IMC e o peso podem prever o valor do PAC independentemente.
DESCRITORES – Fígado gorduroso. Biópsia, efeitos adversos. Técnicas de imagem por elasticidade, utilização. Estilo de vida.
REFERENCES
1. Adams LA, Sanderson S, Lindor KD, Angulo P. The histological course of
non-alcoholic fatty liver disease: a longitudinal study of 103 patients with sequential liver biopsies. J Hepatol 2005;42:132-38.
2. Browning JD, Szczepaniak LS, Dobbins R, Nuremberg P, Horton JD, Cohen JC,
Grundy SM, Hobbs HH. Prevalence of hepatic steatosis in an urban population in the United States: impact of ethnicity. Hepatology. 2004;40:1387-95.
3. Karlas T, Wiegand J, Berg T. Gastrointestinal complications of obesity:
non-alco-holic fatty liver disease (NAFLD) and its sequelae. Best Pract Res Clin Endocrinol Metab. 2013;27:195-208.
4. Castera L, Pinzani M. Biopsy and non-invasive methods for the diagnosis of liver
fibrosis: does it take two to tango? Gut. 2010;59:861-6.
5. Sasso M, Beaugrand M, de Ledinghen V, et al. Controlled attenuation parameter
(CAP): a novel VCTE(TM) guided ultrasonic attenuation measurement for the evaluation of hepatic steatosis: preliminary study and validation in a cohort of patients with chronic liver disease from various causes. Ultrasound Med Biol. 2010;36:1825-35.
6. de Lédinghen V, Vergniol J, Foucher J, Merrouche W, le Bail B. Non-invasive
diagnosis of liver steatosis using controlled attenuation parameter (CAP) and transient elastography. Liver Int 2012;32:911-8.
7. Myers RP, Pollett A, Kirsch R, Pomier-Layrargues G, Beaton M, et al. Controlled
Attenuation Parameter (CAP): a noninvasive method for the detection of hepatic steatosis based on transient elastography. Liver Int. 2012;32:902-10.
8. Kumar M, Rastogi A, Singh T, Behari C, Gupta E, et al. Controlled attenuation
parameter for non-invasive assessment of hepatic steatosis: Does etiology affect performance? J Gastroenterol Hepatol. 2013;28:1194-201.
9. Chon YE, Jung KS, Kim SU, Park JY, Park YN, et al. Controlled attenuation
parameter (CAP) for detection of hepatic steatosis in patients with chronic liver diseases: a prospective study of a native Korean population. Liver Int. 2014;34:102-9.
10. Prati D, Taioli E, Zanella A, Della TE, Buttelli S, et al. Updated definitions of healthy ranges for serum alanine aminotransferase levels. Ann Intern Med. 2002;137:1-10.
11. Chobanian AV, Bakris GL, Black HR, Cushman WC, Green LA, Izzo JL Jr, et al. The seventh report of the joint national committee on prevention, detection, evaluation, and treatment of high blood pressure: The JNC 7 report. JAMA. 2003;289:2560–72.
12. Nesar Hoseini V, Taziki O. Relationship between microalbuminuria and sever-ity of coronary artery disease in nondiabetic patients. Iran Cardiovasc Res J. 2008;4:234-7.
13. Muniyappa R, Lee S, Chen H, Quon MJ, Current approaches for assessing insulin sensitivity and resistance in vivo: advantages, limitations, and appropriate usage. Am J Physiol Endocrinol Metab. 2008;294:15-26.
15. Sanyal AJ. AGA technical review on nonalcoholic fatty liver disease. Gastroen-terology. 2002;123:1705-25.
16. Foster KJ, Dewbury KC, Griffith AH, Wright R. The accuracy of ultrasound in the detection of fatty infiltration of the liver. Br J Radiol. 1980;53:440-2. 17. Jeon CY, Lokken RP, Hu FB, van Dam RM. Physical activity of moderate
intensi-ty and risk of intensi-type 2 diabetes: a systematic review. Diabetes Care. 2007;30:744-52. 18. Jette M, Sidney K, Blumchen G. Metabolic equivalents (METS) in exercise test-ing, exercise prescription, and evaluation of functional capacity. Clin Cardiol. 1990;13:555-65.
19. Ueno T, Sugawara H, Sujaku K, Hashimoto O, Tsuji R, Tamaki S, et al Ther-apeutic effects of restricted diet and exercise in obese patients with fatty liver. J Hepatol. 1997;27:103-7.
20. Angulo P. Nonalcoholic fatty liver disease. N Engl J Med. 2002;346:1221-31. 21. Bedogni G, Bellentani S, Miglioli L, Masutti F, Passalacqua M, Castiglione A,
Tiribelli C. The Fatty Liver Index: a simple and accurate predictor of hepatic steatosis in the general population. BMC Gastroenterol. 2006;6:33.
22. Lee JH, Kim D, Kim HJ, Lee CH, Yang JI, Kim W, et al. Hepatic steatosis index: a simple screening tool reflecting nonalcoholic fatty liver disease. Dig Liver Dis. 2010;42:503-8.
23. Calori G, Lattuada G, Ragogna F, Garancini MP, Crosignani P, Villa M, et al. Fatty liver index and mortality: the Cremona study in the 15th year of follow- up. Hepatology. 2011;54:145-52.
24. Schwenzer NF, Springer F, Schraml C, et al. Non-invasive assessment and quan-tification of liver steatosis by ultrasound, computed tomography and magnetic resonance. J Hepatol. 2009;51:433-45.
25. Saadeh S, Younossi ZM, Remer EM, et al. The utility of radiological imaging in nonalcoholic fatty liver disease. Gastroenterology. 2002;123:745-50.
26. Shen F, Zheng R-D, Mi Y-Q, et al. Controlled attenuation parameter for non-in-vasive assessment of hepatic steatosis in Chinese patients. World J Gastroenterol. 2014;20:4702-11.
27. Eckard C, Cole R, Lockwood J, et al. Prospective histopathologic evaluation of lifestyle modification in nonalcoholic fatty liver disease: a randomized trial. Therapeutic Advances in Gastroenterology. 2013;6:249-59.
28. Bhat G, Baba CS, Pandey A, Kumari N, Choudhuri G. Life style modification improves insulin resistance and liver histology in patients with non-alcoholic fatty liver disease. World J Hepatol. 2012;4:209-17.
29. Centis E, Marzocchi R, Di Domizio S, Ciaravella MF, Marchesini G. The effect of lifestyle changes in non-alcoholic fatty liver disease. Dig Dis. 2010;28:267-73. 30. Vilar-Gomez, Martinez-Perez Y, Calzadilla-Bertot L, Torres-Gonzalez A, Gra-Oramas B, Gonzalez-Fabian L, Friedman SL, Diago M, Romero-Gomez M. Weight Loss Through Lifestyle Modification Significantly Reduces Features of Nonalcoholic Steatohepatitis. Gastroenterology. 2015;149:367-78. 31. Chen SM , Liu CY, Li SR, Huang HT, Tsai CY, Jou HJ. Effects of therapeutic
lifestyle program on ultrasound-diagnosed nonalcoholic fatty liver disease. J Chin Med Assoc. 2008;71:551-8.
32. Tock L, Dâmaso AR, de Piano A, Carnier J, Sanches PL, Lederman HM, et al. Long-Term Effects of Metformin and Lifestyle Modification on Nonalcoholic Fatty Liver Disease Obese Adolescents. J Obes. 2010;2010: pii: 831901. 33. Sreenivasa Baba C, Alexander G, Kalyani B, Pandey R, Rastogi S, et al. Effect