Revista Brasileira de
Engenharia Agrícola e Ambiental
Campina Grande, PB, UAEA/UFCG – http://www.agriambi.com.br
v.22, n.7, p.458-464, 2018
S-Index as an indicator of physical quality in soils of the Paraná state
DOI: http://dx.doi.org/10.1590/1807-1929/agriambi.v22n7p458-464
João H. Caviglione
1Palavras-chave:
curva de retenção de água no solo estrutura do solo
porosidade do solo van Genuchten-Mualem
A B S T R A C T
From the 1990s, the demand for soil quality indicators has increased with the agricultural sustainability approaches. The S-index was proposed as an indicator of soil physical quality. The objective was to evaluate the sensitivity of S-index as an indicator of soil physical quality and its correlation with bulk density, organic carbon content, macroporosity, microporosity, total porosity and clay, sand and silt contents, under field conditions in the diversity of the Paraná state. Samples were collected from 21 sites with textures from clay and heavy clay, in the layers of 0-0.1 and 0.1-0.2 m, in soil under native forest and in cultivated soil. Eight soil physical attributes were determined. A soil-water retention curve with six moisture points was fitted and the S-index was calculated for each condition. The Wilcoxon Test showed differences in S-index between soil managements with p-value = 0.0015 in the 0-0.1 m layer and less than 0.0001 in the 0.1-0.2 m layer. The observed S-index showed to be a sensitive indicator of soil physical quality and with a significant Pearson correlation with bulk density (-0.826), macroporosity (0.760), total porosity (0.836), and organic carbon content (0.583).
Índice S como indicador de qualidade física
em solos do estado do Paraná
R E S U M O
A partir da década de 1990, a busca por indicadores de qualidade do solo aumentou com as abordagens de sustentabilidade agrícola. O índice S foi proposto como indicador da qualidade física de solo. Objetivou-se avaliar a sensibilidade do índice S como indicador de qualidade física do solo e verificar sua correlação com a densidade do solo, teor de carbono orgânico, macroporosidade, microporosidade, porosidade total e os teores de argila, areia e silte, em condições de campo na diversidade do Paraná. Amostras foram coletadas em 21 locais de solos argilosos e muito argilosos, nas camadas de 0 a 0,1 e 0,1 a 0,2 m, sob mata nativa e solo explorado. Determinaram-se oito atributos físicos do solo. Uma curva de retenção de água do solo, com seis pontos de umidade, foi ajustada e o índice S calculado em cada condição. O teste de Wilcoxon mostrou diferença no índice S entre os manejos com p-valor = 0,0015 na camada de 0 a 0,1 m e menor que 0,0001 na 0,1 a 0,2 m. O Índice S observado mostrou ser um indicador sensível de qualidade física do solo e apresentou correlação de Pearson significativa com a densidade do solo (-0,826), macroporosidade (0,760) porosidade total (0,836), e teor de carbono orgânico (0,583).
Key words:
soil-water retention curve soil structure
soil porosity
van Genuchten-Mualem
1 Instituto Agronômico do Paraná/Área de Solos. Londrina, PR. E-mail: [email protected] (Corresponding author) - ORCID: 0000-0002-2518-0031
Introduction
Soil quality is defined by the Soil Science Society of America (SSSA) as “the capacity of a specific kind of soil to function, within natural or managed ecosystem boundaries, to sustain plant and animal productivity, maintain or enhance water and air quality, and support human health and habitation.” (Karlen et al., 1997). From 1990, the demand for soil quality indicators has increased.
Soil attributes such as bulk density, total porosity, optimal water range, aggregate stability, soil resistance to penetration have been used as physical quality indicators because they are modified by soil use and management, besides being of easy determination and reduced cost (Stefanoski et al., 2013).
Dexter (2004) proposes the S-index, which is the tangent (slope) of the Soil-Water Retention Curve (SWRC) at its inflection point, as an indicator of soil physical quality because the S-index would reflect microstructural porosity, governed by many of the physical properties of the soil.
Dexter & Czyż (2007) identified the S value = 0.035 as the limit between soils with good and poor structural quality. They also defined other limits; S < 0.02 for soils with very poor quality and S > 0.05 for soils with optimal or very good quality.
Oliveira et al. (2014) evaluated the S-index, soil aeration capacity (ACt/Pt) and soil water storage capacity (FC/Pt) as indicators of soil physical quality, in horizons of soils of a pedosequence under semideciduous seasonal forest. These authors concluded that the three indicators were effective in differentiating the horizons with respect to their physical-hydraulic behaviors, but the results suggested the need for reevaluation of the ideal limits of the S-index, specific to tropical regions.
This study aimed to evaluate the sensitivity of S-index as indicator of soil physical quality and verify its correlation with bulk density, organic carbon content, macroporosity,
microporosity, total porosity and clay, sand and silt contents, under field conditions in the diversity of some soils of the Paraná state.
Material and Methods
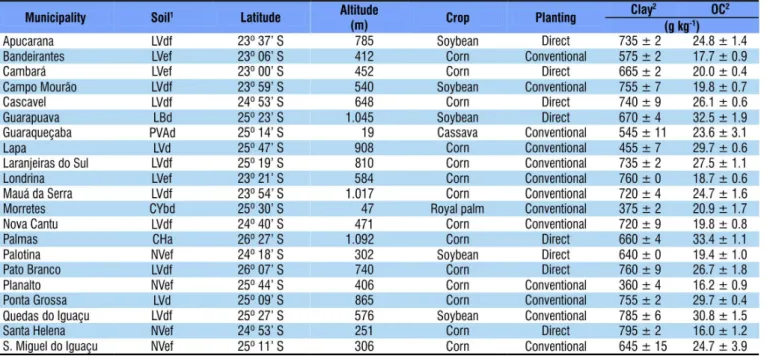
Samples were collected in 21 sites in the Paraná state, in two layers (0-0.10 and 0.10-0.20 m) in soil under management and crop representative of the region and under native forest, close to one another. Forest soil was used as reference of quality, superior to the cultivated soil.
Each site had a specific management, crop and form of planting, defined by the owner (Table 1), as well as the mean contents of clay and organic carbon (OC) of the managed areas.
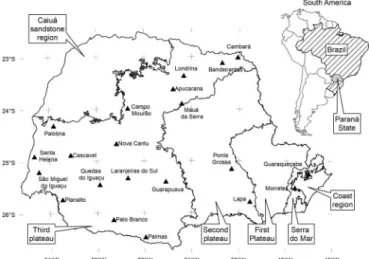
Samples were collected in soils with clayey and heavy clayey texture, with clay contents higher than 350 g kg-1. Sandy or medium-textured soils were avoided because, although Dexter (2004) did not establish limits for the low clay contents in the soil, he describes a trend that in this situation S values are high. Figure 1 shows the 21 sites sampled in the Paraná state and the morpho-physiographic regions.
A total of 252 undisturbed soil samples were randomly collected in triplicates. Steel volumetric rings (99.37 cm3) were vertically inserted into the soil, using a manual device specifically built for this purpose. Samples were also collected to determine the contents of clay, sand, silt and organic carbon.
Soil bulk density (Ds) and gravimetric moisture content at tensions of 6, 30, 100, 300, 500 and 1,500 kPa, on tension table or Richards pressure-plate apparatus, were determined. In addition, soil organic carbon - OC contents were determined by the Walkley-Black method (Donagema et al., 2011).
Macroporosity (MacroP), microporosity (MicroP), and total porosity (PoT) were determined according to Donagema et al. (2011). Clay, sand and silt contents were determined using a pipetted with slow agitation (Donagema et al., 2011).
1Soils according to Brazilian system of soil classification (SiBCS) (Santos et al., 2013): LVdf - Latossolo Vermelho Distroférrico (Hapludox); LVef - Latossolo Vermelho Eutroférrico (Hapludox);
LVd - Latossolo Vermelho Distrófico (Hapludox); LBd – Latossolo Bruno Distrófico (Hapludox); NVef - Nitossolo Vermelho Eutroférrico (Rhodudults); PVad - Argissolo Vermelho-Amarelo Distrófico (Paleudult); CHa - Cambissolo Húmico Alumínico (Humudepts) and CYbd - Cambissolo Flúvico Tb Distrófico (Dystrudepts). 2Mean contents of clay and organic carbon - OC (and
standard deviation of the mean) between the layers of the cultivated soil
The most widely used model to describe SWRC is probably the van Genuchten-Mualem (VGM) model (Vereecken et al., 2010). The SWRC was fitted by this model, described by Eq. 1 (Genuchten, 1980), maintaining the Mualem restriction (m = 1 - 1/n).
Residual moisture was fixed at 0.01 m3 m-3. By definition, θres comprehends the moisture when in equilibrium with the air or when tension tends to infinity (Vereecken et al., 2010). These authors also describe a strong influence of this parameter within the dry range of the SWRC and that, during the optimization, θres could assume negative values. One of the recommendations to avoid negative values would be to fix the residual moisture.
The fittings of the 252 curves were evaluated based on the statistical coefficients calculated by the SWRC software. S-index was obtained by fitting the parameters of the VGM model to the observed data for each of the three curves of each condition of management, site and layer.
One curve of each triplicate of the conditions (management, site and layer) was selected based on the best coefficients. The fitting of each curve generated one coefficient of determination (R2), Akaike Information Criterion - AIC (Burnham & Anderson, 2004) and significance level (p-value) of the analysis of variance of the fitting regression. AIC is used to differentiate models, and the smaller the difference in the AIC value, the closer the models.
Differences in the attributes between the conditions were evaluated by the Wilcoxon paired-sample test. This test was used to evaluate the S-index capacity to differentiate soil physical quality between the conditions (native forest and management). One-tailed test was adopted because the S-index of the soil under native forest should be superior.
Pearson coefficient (ρ) and p-value were used in the analysis of correlation between S-index and soil physical attributes, calculated using the program Bioestat® (Ayres et al., 2007). Initially, the conditions of soil management and layer were not differentiated (n = 84) and, subsequently, they were differentiated (n = 21).
Cargnelutti Filho et al. (2010) warned that, for large number of samples, even low Pearson correlation coefficients (ρ) can be significant. Because of that, coefficients between - 0.5 and 0.5 were considered as non-significant in the evaluations which did not distinguish layers and managements.
Results and Discussion
According to the Wilcoxon test (α = 1%), there was no significant difference in the mean contents of sand, silt and clay between cultivated soil and native forest in both layers (Table 2). This result was expected because the management would not interfere significantly with the contents of the granulometric fractions, given the mineral constitution of these fractions.
Figure 1. Distribution of the sampled sites and morpho-physiographic regions of the Paraná state
θh θsat θres α θ n m
res
h
=
(
−)
1+(
)
− +where:
θh - soil moisture content at tension h, g g-1;
θsat - gravimetric moisture content of the saturated soil, g g-1;
θres - residual gravimetric moisture of the soil, g g-1; and, m, n and α - parameters of the equation.
S-index is described as the tangent (slope) of the SWRC at its inflection point. When VGM model is adopted with the Mualem restriction, the S-index can be obtained by Eq. 2, in absolute value, with the parameters of Eq. 1 (Dexter, 2004).
S n n
n sat res n = −
(
−)
− − − θ θ 2 1
1
1 2
where:
S - S-index proposed by Dexter (2004).
Soil moisture and tension data were used to fit SWRCs using the SWRC software (Dourado Neto et al., 2000).
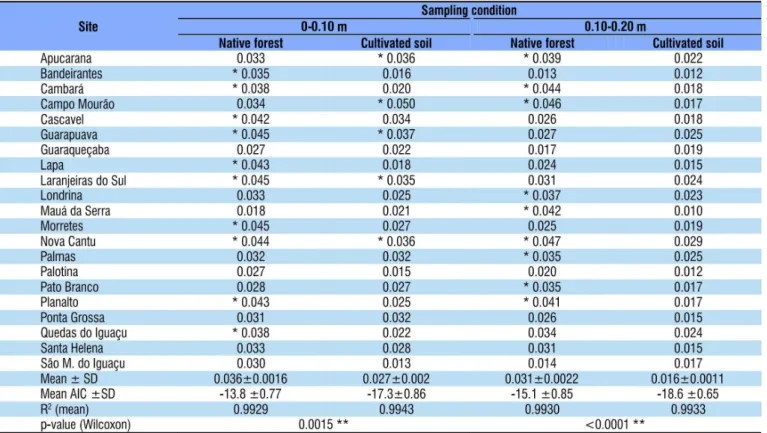
ns - Not significant; * and **Significant at 0.05 and 0.01 probability levels
Table 2. Significant difference (Wilcoxon test) between the means of the attributes for each management, separated by layer, with standard error, maximum value, minimum value and Pearson correlation with the S-index
(1)
Significant difference was found in soil OC in both layers, 0-0.10 m (32.8 and 23.7 g dm-3) and 0.10-0.20 m (22.8 and 17.7 g dm-3), in cultivated soil and native forest, respectively (Table 2). Such difference was similar to results found by Costa et al. (2016), who worked with a heavy clayey Rhodic Hapludox (Latossolo Vermelho distroférrico), under direct planting, conventional planting and native forest, analyzing two depths (0.05 and 0.15 m).
In the 0-0.10 m layer, significant differences were found in Ds (0.96 and 1.15 Mg m-3) and MacroP (0.26 and 0.14 m3 m-3) between forest soil and cultivated soil, respectively (Table 2).
Similar results between cultivated soil and forest soil with respect to both Ds and MacroP were also found by Tavares Filho et al. (2014), who studied a Rhodic Hapludox (Latossolo Vermelho distroférrico) managed for 20 years up to the 0.5 m depth.
The mean coefficient of determination was higher than 0.99 and AIC was between -13.8 and -18.6, expressing a good fit of the curves (Table 3).
Management differentiation by the S-index was more pronounced in the 0.10-0.20 m layer than in the 0-0.10 m layer. The difference in the p-values of the Wilcoxon paired-sample test of each layer indicates this condition, equal to 0.0015 and lower than 0.0001 in surface and subsurface, respectively, in addition to the lower number of sites in which S-index did not distinguish the good quality of the forest soil.
There were seven situations in which the S-index was not able to differentiate managements (Table 3), and the value for the cultivated soil was higher than or equal to that of the native forest. Out of these seven situations, five were in the 0-0.10 m layer (Apucarana, Campo Mourão, Mauá da Serra, Palmas and Ponta Grossa) and two were in the 0.10-0.20 m layer (Guaraqueçaba and São Miguel do Iguaçu).
There was no Pearson correlation of the S-index in all conditions with sand, silt and clay contents and MicroP. However, the correlation was positive (Table 2) with PoT (0.836), OC (0.583) and MacroP (0.760) and negative with Ds (- 0.826). A best-fit line of the S-index with the attributes was illustrated in Figures 2 and 3, not being a regression analysis.
This result is consistent with the theory about the S-index (Dexter & Czyż, 2007), because there would be very little or no dependence on textural porosity (between particles), evidencing that the S-index depends on soil PoT, especially on MacroP, since it represents soil structural porosity (microcracks, microaggregates and biopores).
The attributes with significant Pearson correlation (PoT, soil organic carbon, MacroP and Ds) were selected for a correlation analysis in which the conditions of layer and management were distinguished. Correlations of MacroP and OC with the S-index were not statistically significant in at least one condition.
The conditions in which MacroP was significantly correlated with the S-index were: native forest soil in the 0.10-0.20 m layer, 0.663 (**); cultivated soil in the 0-0.10 m layer, 0.821 (**) and cultivated soil in the 0.10-0.20 m layer, 0.474 (*). With the OC, significant correlations occurred in the following conditions: native forest soil in the 0.10-0.20 m layer, 0.481 (*) and cultivated soil in the 0.10-0.20 m, 0.467 (*). These data were not presented in graphs or tables.
Pearson correlation was significant in all conditions for Ds, oscillating between - 0.687 and - 0.900 (Figure 2), and for PoT, between 0.916 and 0.462 (Figure 3). Ds and PoT were also the two attributes with highest Pearson correlation coefficients in general (Table 2).
AIC - Akaike Information Criterion; ±SD - Standard deviation of the mean; R2 - Coefficient of determination; *Values of S-index ≥ 0.035, considered as soils of good structural quality
according to the criterion of Dexter & Czyż (2007)
Figure 2. Correlation between S-index and bulk density in the sampled sites (n = 21) for: forest soil in the 0-0.10 m layer (A); forest soil in the 0.10-0.20 m layer (B); cultivated soil in the 0-0.10 m layer (C); cultivated soil in the 0.10-0.20 m layer (D)
Figure 3. Correlation between S-index and soil total porosity in the sampled sites (n = 21) for: forest soil in the 0-0.10 m layer (A); forest soil in the 0.10-0.20 m layer (B); cultivated soil in the 0-0.10 m layer (C); cultivated soil in the 0.10-0.20 m layer (D)
0 to 0.10 m 0.10 to 0.20 m
0.10 to 0.20 m
0.10 to 0.20 m
0.10 to 0.20 m 0 to 0.10 m
0 to 0.10 m
S-index correlations were negative with Ds (Figure 2) and positive with PoT (Figure 3) and both correlations were strong (Callegari-Jacques, 2003). Only the correlation with PoT in forest soil in the 0-0.10 m layer was moderate (ρ = 0.462), but still significant with α = 5%.
Andrade & Stone (2009) studied 2364 samples of the soil analysis data set, with results of texture, bulk density, particle density and soil water retention, all located in the Cerrado region, with textures from sandy to heavy clayey, but without information on management. These authors concluded that S-index was highly correlated with bulk density, PoT and MacroP, with the respective determination coefficients (R2) between 0.66** and 0.51** for bulk density, between 0.64** and 0.50** for PoT and between 0.60** and 0.40** for MacroP.
The S-index theory (Dexter, 2004) confirms the correlation between S-index and PoT, MacroP and Ds, because it would be assessing the structural porosity and pore functionality with the connectivity of soil microstructure.
Andrade & Stone (2009) established a different limit from the one presented by Dexter & Czyż (2007). These authors identified S = 0.045, instead of 0.035, as a limit between soils with good and poor structural quality, and also defined the limit for soils with very poor quality as below 0.025, instead of 0.020.
Although the S-index was correlated with Ds and soil porosity (PoT and MacroP), adopting absolute limits of both 0.035 and 0.045, for the results, is questionable, to say the least. Assuming that the quality of the soil under forest and in the surface would be the best, only 10 sites of the 21 reached the limit of 0.035 (good physical condition). It should also be considered that, in 7 situations, the S-index was lower for the forest soil than for the cultivated soil.
These considerations were also made by Rossetti et al. (2013) and Lier (2014), who do not consider S-index as an absolute indicator of soil quality. In addition, its limit could not be absolute, either 0.035 or 0.045.
Under local conditions, the S-index was correlated with organic carbon and not correlated with the granulometric fractions or texture. Although without statistical analysis, there was no correlation with type of soil, altitude, latitude or planting system. However, a trend related to the soybean crop was detected; approximately 50% of the samples had S-index higher than the limit of 0.035 (Dexter & Czyż, 2007). Nonetheless, conclusions on this require further research.
Conclusions
1. S-index was sensitive to soil physical quality because it significantly differentiated managements in the Paraná state.
2. S-index was significantly correlated with total porosity, bulk density, macroporosity and organic carbon content, under the conditions evaluated.
3. Using S-index in the Paraná state as absolute indicator of soil physical quality is questionable because, in 10 sites of soil under forest, the limit of good physical condition was not reached; therefore, instead of a limit with absolute value, the S-index needs to be interpreted.
Acknowledgments
To the IAPAR - Agronomic Institute of Paraná and to the UEL - State University of Londrina, for the necessary support to the study.
Literature Cited
Andrade, R. da S.; Stone, L. F. Índice S como indicador da qualidade física de solos do cerrado brasileiro. Revista Brasileira de Engenharia Agrícola e Ambiental, v.13, p.382-388, 2009. https:// doi.org/10.1590/S1415-43662009000400003
Ayres, M.; Ayres Júnior, M.; Ayres, D. L.; Santos, A. S. Bioestat 5.0: Aplicações estatísticas nas áreas das ciências biomédicas. Belém: ONG Mamirauna, 2007. 364p.
Burnham, K. P.; Anderson, D. R. Multimodel inference: Understanding AIC and BIC in model selection. Sociological Methods & Research, v.33, p.261-304, 2004. https://doi.org/10.1177/0049124104268644 Callegari-Jacques, S. M. Bioestatística: Princípios e aplicações. Porto
Alegre: Artemed, 2003. 255p.
Cargnelutti Filho, A.; Toebe, M.; Burin, C.; Silveira, T. R. da; Casarotto, G. Tamanho de amostra para estimação do coeficiente de correlação linear de Pearson entre caracteres de milho. Pesquisa Agropecuaria Brasileira, v.45, p.1363-1371, 2010. https://doi. org/10.1590/S0100-204X2010001200005
Costa, A. B. F. da; Araujo-Junior, C. F.; Caramori, P. H.; Yada, I. F. U.; Medina, C. de C. Physical and hydraulic properties of a Latosol influenced by land use and management changes. African Journal of Agricultural Research, v.11, p.3217-3226, 2016. https://doi. org/10.5897/AJAR2016.11255
Dexter, A. R. Soil physical quality: Part I. Theory, effects of soil texture, density, and organic matter, and effects on root growth. Geoderma, v.120, p.201-214, 2004. https://doi.org/10.1016/j. geoderma.2003.09.004
Dexter, A. R.; Czyż, E. A. Applications of S-theory in the study of soil physical degradation and its consequences. Land Degradation & Development, v.18, p.369-381, 2007. https://doi.org/10.1002/ ldr.779
Donagema, G. K.; Campos, D. V. B. de; Calderano, S. B.; Teixeira, W. G.; Viana, J. H. M. Manual de métodos de análise de solo. Rio de Janeiro: Embrapa Solos, 2011. 230p.
Dourado Neto, D.; Nielsen, D. R.; Hopmans, J. W.; Reichardt, K.; Bacchi, O. O. S. Software to model soil water retention curves (SWRC, version 2.00). Scientia Agricola, v.57, p.191-192, 2000. https://doi.org/10.1590/S0103-90162000000100031
Genuchten, M. T. van. A closed-form equation for predicting the hydraulic conductivity of unsaturated soils. Soil Science Society of America Journal, v.44, p.892-898, 1980. https://doi.org/10.2136/ sssaj1980.03615995004400050002x
Karlen, D. L.; Mausbach, M. J.; Doran, J. W.; Cline, R. G.; Harris, R. F.; Schuman, G. E. Soil quality: A concept, definition, and framework for evaluation (A guest editorial). Soil Science Society of America Journal, v.61, p.4-10, 1997. https://doi.org/10.2136/ sssaj1997.03615995006100010001x
Oliveira, T. C.; Silva, L. F. S. da; Cooper, M. Evaluation of physical quality indices of a soil under a seasonal semideciduous forest. Revista Brasileira de Ciência do Solo, v.38, p.444-453, 2014. https://doi.org/10.1590/S0100-06832014000200009
Rossetti, K. de V.; Centurion, J. F.; Sousa Neto, E. L. de. Physical quality of an Oxisol after different periods of management systems. Revista Brasileira de Ciência do Solo, v.37, p.1522-1534, 2013. https://doi.org/10.1590/S0100-06832013000600009
Santos, H. G. dos; Jacomine, P. K. T.; Anjos, L. H. C. dos; Oliveira, V. Á. de; Oliveira, J. B. de; Coelho, M. R.; Lumbreras, J. F.; Cunha, T. J. F. Sistema brasileiro de classificação de solos. 3.ed. rev. amp. Brasília: Embrapa Informação Tecnológica, 2013. 353p.
Stefanoski, D. C.; Santos, G. G.; Marchão, R. L.; Petter, F. A.; Pacheco, L. P. Uso e manejo do solo e seus impactos sobre a qualidade física. Revista Brasileira de Engenharia Agrícola e Ambiental, v.17, p.1301-1309, 2013. https://doi.org/10.1590/S1415-43662013001200008 Tavares Filho, J.; Melo, T. R. de; Machado, W.; Maciel, B. V. Structural
changes and degradation of Red Latosols under different management systems for 20 years. Revista Brasileira de Ciência do Solo, v.38, p.1293-1303, 2014. https://doi.org/10.1590/S0100-06832014000400025 Vereecken, H.; Javaux, M.; Weynants, M.; Pachepsky, Y.; Schaap,