PHYSICAL QUALITY OF AN OXISOL UNDER DIFFERENT
USES
(1)Francisco Ocian Bastos Mota(2), Ricardo Luiz Lange Ness(3), Jaedson Cláudio Anunciato Mota(4), Celso Augusto Clemente(5) & Sebastião Cavalcante Sousa(6)
SUMMARY
The use of a soil induces changes in the physical properties according to the management, tillage intensity and type of crop. The objective of this work was to measure the alterations of some of the soil physical properties and evaluate the physical quality by the S index, an indicator proposed by Dexter (2004), comparing the land uses: eucalyptus plantations at different ages, grazing pasture, annual crops, and an area of preserved secondary vegetation with an area of preserved native forest (National Forest Araripe - NFA) as control. The study was carried out on an Oxisol on the Fazenda Redenção, in Jardim, State of Ceará, Brazil. The experiment was arranged in a completely randomized design with seven treatments and three replications in the layers 0-0.1 and 0.1-0.2 m. The soil was analyzed for the following physical properties: bulk density, particle density, total pore volume, micro and macroporosity, soil water retention curves and water availability. Based on the S index, the hypothesis that the use of a soil deteriorates the physical quality was accepted. Clearly, native forest (NFA) was the land use with the best conditions in all physical properties studied, followed closely by the area reforested with 20 year-old eucalyptus. The use as grazing pasture affected the soil physical conditions most, especially in the surface layer (0-0.1 m), as evidenced by increased bulk density and a substantial reduction in soil porosity, mainly in macroporosity. Microporosity was not influenced by any of the uses and in any layer studied.
Index terms: land use, soil physical properties, S index, soil degradation, Araripe Plateau - Brazil.
(1) Received for publication in January 10, 2012 and approved in September 13, 2012.
(2) Agronomist, DSc, Federal University of Ceará (UFC), Campus Cariri, Department of Agronomy. CNPq/FUNCAP Scholarship. Av. Tenente Raimundo Rocha, s/n. CEP 63040-360 Juazeiro do Norte (CE), Brazil. E-mail: [email protected]
(3) Professor, UFC/Campus Cariri, Department of Agronomy. E-mail: [email protected]
(4) Professor, Federal University of Ceará (UFC), Department of Soil Science. Av. Mister Hull, 2977, Presidente Kennedy. CEP 60021-970 Fortaleza (CE), Brazil. E-mail: [email protected]
(5) Professor, São Paulo University (USP), Department of Soil Science. Av. Pádua Dias, 11. CEP 13418-900 Piracicaba (SP), Brazil.E-mail: [email protected]
(6) Professor, UFC/Campus Cariri, Department of Agronomy. E-mail: [email protected]
RESUMO: QUALIDADE FÍSICA DE UM LATOSSOLO AMARELO SOB
DIFERENTES USOS
O uso do solo promove alterações em seus atributos físicos de acordo com o manejo, a intensidade de preparo e o tipo de cultura. Os objetivos deste trabalho foram medir as alterações de alguns atributos físicos do solo e avaliar sua qualidade física pelo índice S, um indicador proposto por Dexter (2004), comparando usos com reflorestamento com eucalipto de diferentes idades, pastagem utilizada para os animais, culturas anuais e uma área preservada de vegetação secundária em relação a uma área preservada de mata nativa (Floresta Nacional do Araripe - Flona), a qual foi utilizada como controle. O estudo foi conduzido em Latossolo Amarelo distrófico, em áreas da Fazenda Redenção, localizada no município de Jardim, Estado do Ceará, Brasil. O delineamento experimental foi o inteiramente casualizado com sete tratamentos e três repetições, nas profundidades de 0-0,1 e 0,1-0,2 m. Os atributos físicos do solo analisados foram: densidade do solo e de partícula, volume total de poros, micro e macroporosidade, curvas de retenção de água no solo e água disponível. Com base no índice S, a hipótese de que o uso do solo piora a sua qualidade física foi aceita, ficando evidente que o solo sob mata nativa foi o que apresentou as melhores condições físicas em todos os atributos estudados, seguido de perto pela área reflorestada com eucalipto de 20 anos. O solo utilizado com pastagem para os animais foi o tratamento com os atributos físicos mais alterados, sobretudo na camada surface (0-0,1 m), fato evidenciado pelo aumento na densidade do solo e pela redução do volume total de poros, especialmente da macroporosidade. A microporosidade não se alterou em todos os tipos de usos e profundidades pesquisados.
Termos de indexação: uso do solo, atributos físicos do solo, índice S, degradação do solo, Chapada do Araripe - Brasil.
INTRODUCTION
The Mesoregion Southern Ceará in Brazil covers an area of 14,800 km2, consisting of 25 municipalities.
The most important morphostructural setting in this region consists of the Araripe Plateau, a Mesozoic sedimentary basin, at 800 to 900 m asl, distributed in the States of Ceará, Pernambuco and Piauí (Funceme, 2006).
The soil, climatic conditions and groundwater availability (aquifers) make this area a prosperous region for agribusiness. However, on the other hand, the soil resources have been strongly affected by human intervention. According to Oliveira & Araújo (2007), the conservation status of the Araripe Plateau is rather complex because of its higher population density, compared with the drier surrounding areas, which means that the soil has to support a high pressure of use.
The soil management related to different uses and/ or different agroecosystems, with greater or lesser contributions of organic matter to the soil surface layer, creates structural conditions that influence the porosity, bulk density and penetration resistance, making the soil receptive or not to water infiltration and favorable or unfavorable to the growth and development of root crops (Imhoff et al., 2000; Stone et al., 2002; Tavares & Ribon, 2008). According to Cheng et al. (2002), soils under forest vegetation, due to their higher porosity, especially macropores, facilitate water infiltration and consequently increase aquifer recharge. Mapa (1995) found that the compaction of Oxisols was reversed after some years
of land use with reforestation, because of the higher organic matter input into the soil.
The microporosity of a soil seems to be less affected by land use, and more influenced by the soil texture and organic matter content. Araújo et al. (2004) found no significant differences between the microporosity in the areas of native forest and cultivated land in a field experiment with an Oxisol.
The long-term use as extensive cattle pasture modifies the characteristics and physical properties of a soil, since the trampling of the animals contributes to a reduction of total porosity, especially of macroporosity, and increases bulk density as well (Souza & Alves, 2003). Collares (2005) found that the average pressure of cattle is 0.17 MPa per head and can penetrate the soil to about 12 cm.
The soil water retention curve shows the relationship of the soil water content with the energy of water in the soil which is useful for calculations related to the water movement and availability to plants. Silva et al. (1994) defined this condition of soil water (availability) as the moisture range where plant growth is little affected. In practice, for medium textured soils, the parameter is defined as the moisture retained in the soil between field capacity (33 kPa) and the permanent wilting point (1,500 kPa).
properties that are essential to explain the behavior of plants under water or physical stress. Dexter & Czyz (2007) proposed applications considering the use of S and concluded that S is suitable to quantify the soil physical properties and correlated the soil physical quality with plant growth. According to the authors, the S index predicts the hydraulic conductivity, compression, particle aggregation, root penetration resistance, water availability to plants and soil stability. Howeveer, further studies are required to establish values that quantify changes in the soil structure based on the application of the S index.
Based on the hypothesis that different land uses and management affect the soil physical properties differently and deteriorate the quality compared to a soil under natural vegetation, the purpose of this research was to assess changes in some physical properties and calculate the S index of a representative Oxisol on the Araripe Plateau, Ceará, Brazil.
MATERIAL AND METHODS Soil, climate, experimental design
The study was carried out on a Latossolo Amarelo Latossolo Amarelo distrófico (Embrapa, 2006) or Typic Haplustox sandy clay loam, kaolinitic, iso-hyperthermic (USDA, 2006), in areas of the Fazenda Redenção on the Araripe Plateau, in the municipality of Jardim, Ceará, Brazil (7o 3’ 25" S and 39o 19' 30" W, mean altitude 867
m asl). Mendonça et al. (2009) mentioned that the climate of the experimental location is Aw’ according to the Köppen classification, with average annual rainfall of 801.5 mm, average maximum temperature of 34 oC and
minimum of 18 oC, and relative air humidity with a
maximum of 80 % and minimum of 49 %.
The agroecosystems and/or uses studied were: (a) native forest (National Forest Araripe - NFA, as control), (b) secondary vegetation with native species, preserved for more than 20 years, (c) annual crops (Cassava - Manihot esculenta Crantz; corn - Zea mays
L.; bean - Phaseolus vulgaris L.), (d) pasture (Brachiaria decumbens Stapf.), (e) reforestation with eucalyptus for 20 years (Eucalyptus spp. L.), (f) reforestation with eucalyptus 13 years (Eucalyptus spp. L.), and (g) eucalyptus plantation 1 year (Eucalyptus
spp. L.), in an area previously used for sugar cane (Saccharum officinarum L.) for about 10 years.
The types of uses and/or agricultural ecosystems, management and some physical and chemical properties in the 0-0.1 m layer, directly or indirectly correlated with the physical properties studied, are presented in table 1. Soil samples were collected in June 2010 from the layers 0-0.1 and 0.1-0.2 m.
Particle size analysis and organic carbon
To determine the total clay (pipette method), NaOH 1 mol L-1 was used as chemical dispersant,
and organic carbon (oxidation by potassium dichromate 0.4 mol L-1 and titration of the excess with
ammonium ferrous sulfate 0.1 mol L-1). Organic
matter was calculated by multiplying organic carbon by 1.724. All tests and calculations were based on Embrapa (1997).
Particle density (PD), bulk density (BD), total porosity (TP), microporosity (Micro) and macroporosity (Macro)
The particle density was analyzed by the pycnometer method and the bulk density based on undisturbed soil samples of known volume (50 cm3).
The microporosity was determined by a porous plate apparatus (Richards, 1948). According to Kiehl (1979) and Danielson & Sutherland (1986), the microporosity corresponds to the moisture retained up to a tension of 0.006 MPa. The macroporosity was obtained by the difference between total porosity (TP) and microporosity, and TP was calculated from the values of BD and PD, using the equation: VTP = 1 - BD/PD (Embrapa, 1997).
Water retention, soil water retention curve, S index and water availability
Water retention was obtained by drying, using undisturbed soil samples subjected to the following tensions: 6, 8, 10, 33, and 1,500 kPa. For low tensions (6, 8 and 10 kPa), the water content was determined with porous plate funnels (Haines funnels), while for the other tensions (33 and 1,500 kPa) a porous plate apparatus was used, according to the method of Klute (1986). To construct the soil water retention curve, the total soil porosity, the total soil porosity was considered as the water content of saturated soil and a constant value of PD of 2.65 Mg m-3. The data,
calculated as means of three replications per point, were adjusted to a mathematical model proposed by van Genuchten (1980):
[
]
m) (
1 n
r s r
h
a q q q q
+ -+ =
where θr and θs are, respectively, the residual water content and saturation (m3 m-3), h the matric
potential of soil water and α, m and n (empirical constants related to the shape of curve). For the S index, Dexter & Czyz (2007) suggested, from the van Genuchten equation, expressing the gravimetric water content as a function of matric potential
(
) ( )
[
]
resm n res
sat w h w
w
w= - 1+a - +
and to simplify the calculation of the S index by means of mathematical manipulations. Thus, one should derive the equation of van Genuchten two times compared to the logarithm of tension (ln h), and equating it to zero, establish the water potential (hi)
n
i m
h
1 1 1
úû ù êë é = a
Returning to the van Genuchten equation and substituting the value of the modulus of the soil water potential, the water content at the inflection point (wi)
is given by:
(
)
resm
res sat
i w w m w
w= - êëé + úûù +
-1 1
Thus, the inclination of the tangent line at the inflection point (S index) was calculated based on the parameters of the van Genuchten equation by the equation:
(
wsat wres)
m ( m) nS
+
-úû ù êë
é +
-=
1 1 1
The available water was calculated as the difference between the water content in the soil between tensions of 10 and 1,500 kPa, due to the high sand content of the soil.
The experimental design was completely randomized with seven treatments and three repetitions. The results were statistically analyzed using the statistical software Assistat (UFCG, 2010). The effects of different uses and management on the soil physical properties at both depths were verified by analysis of variance, and the results subjected to the F test at 1 and 5 % and the treatment means were compared by the Tukey test at 5 %.
RESULTS AND DISCUSSION
Bulk density (BD), total porosity (TP), microporosity (Micro) and macroporosity (Macro)
The results (presented in table 2) show that there was no statistical difference between total porosity,
macro and microporosity in the 0.1-0.2 m layer among all treatments when compared with the control (native forest - NFA). No significant difference was observed for microporosity either between treatments in the 0-0.1 m layer, reinforcing the theory that this type of porosity seems to be little affected by soil use and management, but is more influenced by organic matter (OM) content and soil texture. Similar results were obtained by Araújo et al. (2004) in a study on an Oxisol.
Significant differences were found in the same layer with regard to BD. In the layer 0-0.1 m, density was lowest in the areas under eucalyptus (20 years), fallow agricultural area (preserved for 20 years), annual crops, and native forest. In the 0.1-0.2 m layer, the BD of the native forest differed only from that of the area reforested with eucalyptus after 13 years and was statistically similar to the values measured in the other treatments.
The depth of 0-0.1 m was the most sensitive to changes by different types of land use on the physical properties listed above. The lowest total porosity and macroporosity and highest bulk density were found in the pasture treatment, which can be explained by the intensive trampling by cattle grazing in the area. Furthermore, the values of the control treatment of these properties were highest due to the higher content of OM and the absence of agricultural machinery traffic in the area, in agreement with the results reported by Souza & Alves (2003), Collares (2005) and Cheng et al. (2002).
Macroporosity is considered an indicator of soil compaction and was relatively low under pasture only, statistically significant compared to other treatments. The measured value (0.128 m3 m-3)
approaches the restrictive limit for soil aeration (0.1 m3 m-3). However, macroporoasity was higher
in the 0.1-0.2 m layer, not differing from other treatments or land uses. This is evidence that the animal trampling on the pasture compacts the soil only at the surface.
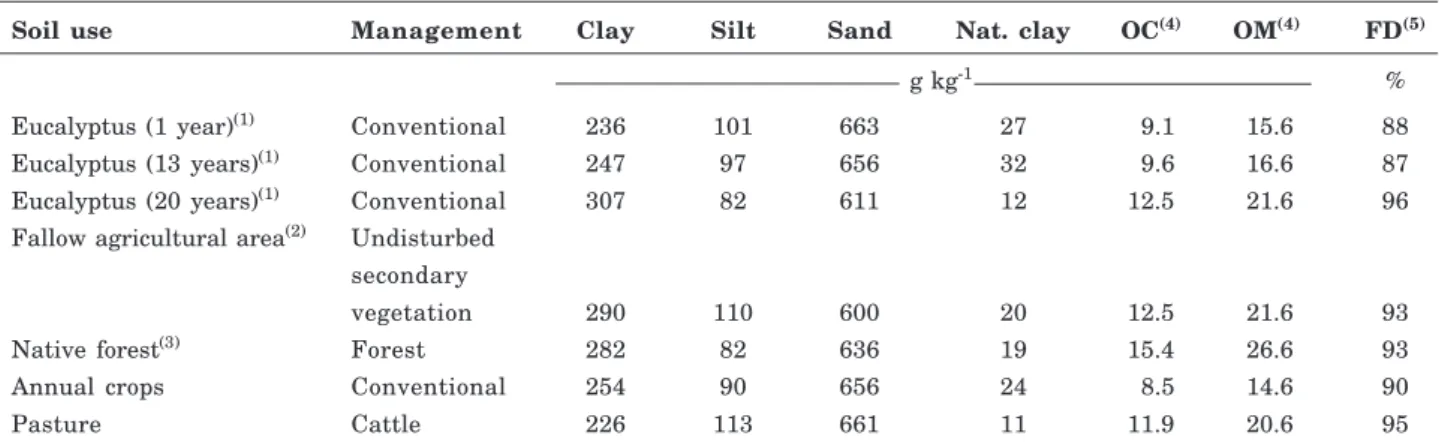
Soil use Management Clay Silt Sand Nat. clay OC(4) OM(4) FD(5)
g kg-1 %
Eucalyptus (1 year)(1) Conventional 236 101 663 27 9.1 15.6 88
Eucalyptus (13 years)(1) Conventional 247 97 656 32 9.6 16.6 87
Eucalyptus (20 years)(1) Conventional 307 82 611 12 12.5 21.6 96
Fallow agricultural area(2) Undisturbed secondary
vegetation 290 110 600 20 12.5 21.6 93
Native forest(3) Forest 282 82 636 19 15.4 26.6 93
Annual crops Conventional 254 90 656 24 8.5 14.6 90
Pasture Cattle 226 113 661 11 11.9 20.6 95
Table 1. Land use management and some physical and chemical properties in the 0-0.1 m layer
In the areas under 13 and 20-year-old eucalyptus, the thick layer of leaf litter accumulated on the soil surface exerted a marked and positive influence on total porosity, macroporosity and bulk density, agreeing with Tavares Filho & Ribon (2008), Imhoff et al. (2000), Stone et al. (2002) and Mapa (1995). It was also found that in general, across the different treatments, there was a direct relationship between BD and microporosity and an inverse relationship between macroporosity and BD. Similar results were reported by Matias et al. (2009).
Water retention, soil moisture characteristic curves, water availability and S index
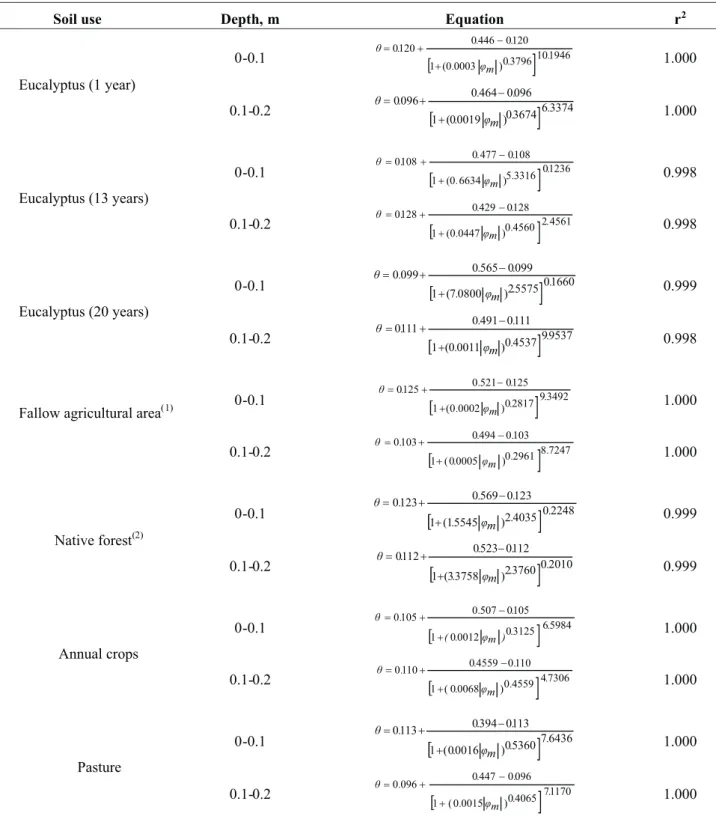
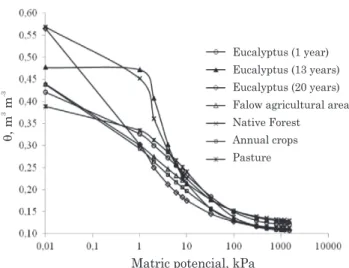
The adjustment parameters of the van Genuchten (1980) model for the soil water retention curves in different situations of use are presented in table 3, and the respective curves are shown in figures 1 and 2.
In the layer 0-0.1m, the highest saturation water content was found in native forest soil, followed closely by soil under eucalyptus growing for 20 years. The characteristic curve of soil moisture under eucalyptus for 13 years was similar to the native forest, differing only in total porosity.
It is noteworthy that despite the large pore volume, the water content of the soil under eucalyptus for 20 years was significantly reduced in the range close to saturation, despite small increases in matric potential, indicating the existence of a reasonable volume of pores
in the domain of the macroporosity. The lowest water content was found in soil under pasture, which must be due to animal trampling that causes compaction with a reduction of total soil porosity. Generally, in spite of using the conventional system for eucalyptus cultivation in this study, the soil physical quality in the surface layer tended to improve over time.
In the 0.1-0.2 m layer, similar to that in the 0-0.1 m layer, the highest water content in saturated soil was observed in the native forest, followed by soil under eucalyptus for 20 years and annual crops. The lowest water content at saturation was found in the fallow agricultural area. It was observed that the total porosity in this layer (0-0.1 m) was very sensitive to changes caused by soil use.
In the layer from 0-0.1 m, the soil water available to crops was lowest in soil under eucalyptus (20 years), 0.067 m3 m-3, and increased, in increasing order:
fallow agricultural area, annual crops, NFA, eucalyptus (13 years ) and eucalyptus (1 year), reaching the maximum in the pasture system, 0.127 m3 m-3. In the layer 0.1-0.2 m, water availability was
lowest in soil under NFA, 0.070 m3 m-3, and increased,
in increasing order: fallow agricultural area, eucalyptus (13 years), eucalyptus (1 year), pasture and annual crops, reaching the maximum in the eucalyptus (20 years), 0.113 m3 m-3. In the figures 1
and 2, the available water is sufficient for irrigation. However, in a modern concept, it is important to note that these values can be modified by the definition of the least limiting water range (LLWR), proposed by
Soil use Porosity BD PD
Total Macro Micro
m3 m-3 Mg m-3
0-0.1 m
Eucalyptus (1 year)(1) 0.446 bc 0.194 bc 0.252 a 1.48 ab 2.67
Eucalyptus (13 years)(2) 0.477 abc 0.246 abc 0.231 a 1.39 abc 2.66
Eucalyptus (20 years)(3) 0.565 a 0.359 a 0.206 a 1.17 d 2.69
Fallow agricultural area(2) 0.521 c 0.282 ab 0.239 a 1.24 cd 2.59
Native forest 0.569 a 0.312 ab 0.257 a 1.13 d 2.62
Annual crops 0.507 a 0.291 ab 0.216 a 1.32 bcd 2.68
Pasture 0.394 ab 0.128 c 0.266 a 1.60 a 2.64
0.1-0.2 m
Eucalyptus (1 year)(1) 0.464 a 0.248 a 0.216 a 1.43 ab 2.67
Eucalyptus (13 years)(1) 0.429 a 0.197 a 0.232 a 1.52 a 2.66
Eucalyptus (20 years)(1) 0.491 a 0.243 a 0.248 a 1.37 ab 2.69
Fallow agricultural area(2) 0.494 a 0.301 a 0.193 a 1.31 ab 2.59
Native forest(3) 0.523 a 0.315 a 0.208 a 1.25 b 2.62
Annual crops 0.489 a 0.239 a 0.250 a 1.37 ab 2.68
Pasture 0.447 a 0.218 a 0.229 a 1.40 ab 2.64
Table 2. Total pore volume, macroporosity, microporosity, bulk density (BD) and particle density (PD), at two depths in the soil under different uses
Soil use Depth, m Equation r2
Eucalyptus (1 year)
0-0.1 [
[
[
[
[
1946 10 3796 0 0003 0 1 120 0 446 0 120 0 . . ) m φ . ( . . . θ + -+ = 1.0000.1-0.2 [ 63374
3674 0 0019 0 1 096 0 464 0 096 0 . . ) m φ . ( . . . θ + -+ = 1.000
Eucalyptus (13 years)
0-0.1 [ 01236
3316
5 6634 0 1 108 0 477 0 108 0 . . ) m φ . ( . . . θ + -+ = 0.998
0.1-0.2 [ 24561
4560 0 0447 0 1 128 0 429 0 128 0 . . ) m φ . ( . . . θ + -+ = 0.998
Eucalyptus (20 years)
0-0.1 [1 70800 2557501660
099 0 565 0 099 0 . . ) m φ . ( . . . θ + -+ = 0.999
0.1-0.2 [ 99537
4537 0 0011 0 1 111 0 491 0 111 0 . . ) m φ . ( . . . θ + -+ = 0.998
Fallow agricultural area(1) 0-0.1 [
3492 9
2817
0 0002 0 1 125 0 521 0 125 0 . . ) m φ . ( . . . θ + -+ = 1.000
0.1-0.2 [ 87247
2961 0 0005 0 1 103 0 494 0 103 0 . . ) m φ . ( . . . θ + -+ = 1.000
Native forest(2)
0-0.1
[
1 15545 24035 02248123 0 569 0 123 0 . . ) m φ . ( . . . θ + -+ = 0.999
0.1-0.2
[
23760020103758 3 1 112 0 523 0 112 0 . . ) m φ . ( . . . θ + -+ = 0.999 Annual crops
0-0.1 [ 65984
3125
0
0012
0 1 105 0 507 0 105 0 . . ) m φ . ( . . . θ + -+ = 1.000
0.1-0.2 [ 47306
4559 0 0068 0 1 110 0 4559 0 110 0 . . ) m φ . ( . . . θ + -+ = 1.000 Pasture
0-0.1
[
764365360 0 0016 0 1 113 0 394 0 113 0 . . ) m φ . ( . . . θ + -+ = 1.000
0.1-0.2 [ 71170
4065 0
0015
0 1 096 0 447 0 096 0 . . ) m φ . ( . . . θ + -+ = 1.000
[
[
[
[
[
[
[
[
[
[
Silva et al. (1994). The definition of available water, unlike the definition of the LLWR, has the limitation of not taking the properties related to soil moisture into consideration, for example, aeration and soil resistance, which can be limiting to plant growth.
Table 4 shows S index values evaluating the soil physical quality, defined as the inclination of the tangent line at the inflection point of the soil moisture characteristic curve, i.e., a measure associated with the porous soil structure (Dexter, 2004). According to
Table 3. Equations adjusted, with determination coefficients, to the soil water retention curves to obtain water content
Dexter & Czyz (2007), the interpretation of the results obtained for this index classifies the soil as being physically very good (>0.050), good (0.050> S > 0.035), poor (0.035> S > 0.02) and very poor (< 0.02).
The soil physical quality under native forest was classified as very good, a fact confirmed by Matias et al. (2009), and the soil physical quality under eucalyptus for a longer time tended to be improved, even approaching the conditions of preserved forest. The physical quality in the area reforested with eucalyptus for 20 years was also excellent according to the S index, and was considered very good and good in the layers 0-0.1 and 0.1-0.2 m, respectively.
In the fallow agricultural area, although preserved for nearly 20 years, the physical quality was classified as poor by the S Index. However, the index values found are very close to 0.035, the value that separates good from poor structural physical quality. According to Dexter (2004), only values below 0.020 characterize soils with very poor physical conditions.
CONCLUSIONS
1. Based on the S index, the hypothesis that the use of a soil degrades its physical quality was accepted. Clearly, the native forest (National Forest Araripe) was the land use that preserved the best conditions in all physical properties studied, followed closely by the area reforested with eucalyptus for 20 years.
2. Grazing pasture was the treatment that most affected the soil physical conditions, especially in the surface layer (0-0.1 m), as evidenced by increased bulk density and a substantial reduction in soil porosity, mainly macroporosity. Microporosity was not affected in any use types and layer investigated.
ACKNOWLEDGEMENTS
This work was financed by the National Council for Scientific and Technological Development (CNPq), Federal University of Ceará - Campus Cariri and Ceará Foundation for Research and Culture (FUNCAP), whose support is gratefully acknowledged.
LITERATURE CITED
ARAÚJO, M.A.; TORMENA, C.A. & SILVA, A.P. Propriedades físicas de um Latossolo Vermelho distrófico cultivado e sob mata nativa. R. Bras. Ci. Solo, 28:337-345, 2004. CHENG, J.D.; LIN, L.L. & LU, H.S. Influences of forests on
water flows from headwater watersheds in Taiwan. For. Ecol. Manage., 165:11-28, 2002.
Soil use
S index SPQ S index SPQ
Depth
0-0.1 m 0.1-0.2 m
Eucalyptus (1 year) 0.031 Poor 0.032 Poor Eucalyptus (13 years) 0.111 Very good 0.027 Poor Eucalyptus (20 years) 0.106 Very good 0.044 Good Fallow agricultural area 0.031 Poor 0.030 Poor Native forest 0.119 Very good 0.091 Very good
Annual crops 0.033 Poor 0.042 Good
Pasture 0.033 Poor 0.034 Poor
Table 4. The S index and soil physical quality (SPQ) for an Oxisol as a function of land use
Matric potencial, kPa
q
, m
m
3-3
Eucalyptus (1 year)
Eucalyptus (13 years)
Eucalyptus (20 years)
Falow agricultural area
Native Forest
Annual crops
Pasture
Figure 1. Soil water retention curves, adjusted by the van Genuchten model, in the 0-0.1 m layer as a function of soil use.
q
, m
m
3-3
Matric potencial, kPa
Eucalyptus (1 year) Eucalyptus (13 years)
Eucalyptus (20 years) Falow agricultural area Native Forest
Annual crops Pasture
COLLARES, G.L. Compactação em Latossolos e Argissolos e relação com parâmetros de solos e de plantas. Santa Maria, Universidade Federal de Santa Maria, 2005. 106p. (Tese de Doutorado)
DANIELSON, R.E. & SUTHERLAND, P.L. Porosity. In: BLACK, C.A., ed. Methods of soil analysis. I. Physical and mineralogical methods. Madison: American Society of Agronomy, Soil Science Society of America, 1986. p.443-461.
DEXTER. A.R. Soil physical quality. Part I: Theory. effects of soil texture. density and organic matter. and effects on root growth. Geoderma, 120:201-214, 2004.
DEXTER, A.R. & CZYZ. E.A. Applications of S-theory in the study of soil physical degradation and its consequences. Land Degrad. Develop., 18:369-381, 2007.
EMPRESA BRASILEIRA DE PESQUISA AGROPECUÁRIA -EMBRAPA. Manual de métodos de análise de solos. 2.ed. Rio de Janeiro, 1997. 212p.
EMPRESA BRASILEIRA DE PESQUISA AGROPECUÁRIA -EMBRAPA. Sistema brasileiro de classificação de solos. 2.ed. Rio de Janeiro, 2006. 306p.
FUNCEME. Zoneamento geoambiental do estado do Ceará: Parte II mesorregião do sul cearense. Fortaleza, 2006. 132p.
IMHOFF, S.; SILVA, A.P. & TORMENA, C.A. Aplicações da curva de resistência no controle da qualidade física de um solo sob pastagem. Pesq. Agropec. Bras., 35:1493-1500, 2000. KIEHL, E.J. Manual de edafologia: Relação solo-planta.
Piracicaba, Ceres, 1979. 262p.
KLUTE, A. Water retention: Laboratory methods. In: KLUTE. A., ed. Methods of soil analysis. 2.ed. American Society of Agronomy/Soil Science Society of America, 1986. Part 1. p.635-662. (Agronomy Monography, 9).
MAPA, R.B. Effect of reforestation using Tectona grandis on infiltration and soil water retention curve. For. Ecol. Manage., 77:119-125, 1995.
MATIAS, S.S.R.; BORBA. J.A.; TICELLI, M.; PANOSSO, A.R. & CÂMARA, F.T. Atributos físicos de um Latossolo Vermelho submetido a diferentes usos. Ci. Agron., 40:331-338, 2009.
MENDONÇA, L.A.R.; VÁSQUEZ, M.A.N.; FEITOSA, J.V.; OLIVEIRA, J.F.; FRANCA, R.M.; VÁSQUEZ, E.M.F. & FRISCHKORN, H. Avaliação da capacidade de infiltração de solos submetidos a diferentes tipos de manejo. Eng. San. Amb., 14:89-98, 2009.
OLIVEIRA, T.S & ARAÚJO, F.C., orgs. Diversidade e conservação da biota na serra de Baturité. Fortaleza, Edições UFC, 2007. 445p.
RICHARDS, L.A. Porous plate apparatus for measuring moisture retention and transmission by soils. Soil Sci., 66:105-110, 1948.
SILVA, A.P.; KAY, B.D. & PERFECT. E. Characterization of the least limiting water range of soils. Soil Sci. Soc. Am. J., 58:1775-1781, 1994.
SOUZA, Z.M. & ALVES, M.C. Movimento de água e resistência à penetração em um Latossolo Vermelho distrófico de cerrado sob diferentes usos e manejos. R. Bras. Eng. Agríc. Amb., 7:18-23, 2003.
STONE, L.F.; GUIMARÃES, C.M. & MOREIRA, J.A.A. Comparação do solo na cultura do feijoeiro - I: Efeitos nas propriedades físicas-hídricas do solo. R. Bras. Eng. Agríc. Amb., 6:207-212, 2002.
TAVARES FILHO. J. & RIBON. A.A. Resistência do solo à penetração em resposta ao número de amostras e tipo de amostragem. R. Bras. Ci. Solo, 32:2-11, 2008.
UFCG. Assistat. Campina Grande, UFCG, 2010.
USDA. Keys to soil taxonomy. 10.ed. Washington, DC, 2006. 339p.