CRUDE PROTEIN LEVELS IN THE DIETS OF TAMBAQUI,
COLOSSOMA MACROPOMUM
(CUVIER, 1818), FINGERLINGS
1CHARLYAN DE SOUSA LIMA2*, MARCOS ANTONIO DELMONDES BOMFIM2, JEFFERSON COSTA DE
SIQUEIRA2, FELIPE BARBOSA RIBEIRO2, EDUARDO ARRUDA TEIXEIRA LANNA3
ABSTRACT – Tambaqui is intensively farmed because of its production characteristics; however, there is a lack of information lacks about the nutritional requirements of this species. The present study aimed to evaluate the effects of various crude protein (CP) levels in the diets of tambaqui fingerlings. A total of 750 fingerlings with an initial weight of 0.35 ± 0.09 g were selected in a completely randomized design with six treatments (experimental feeds with 20%, 24%, 28%, 32%, 36%, and 40% CP), five replicates, and 25 fish per experimental unit. Performance, survival rate, carcass yield, body composition, protein deposition, body fat, and nitrogen retention efficiency were evaluated after 45 days. CP levels did not affect the following: feed conversion, survival rate, moisture content, and carcass yield. However, with increasing CP levels, protein efficiency ratio decreased. Weight gain, feed conversion, and specific growth rate improved until CP levels of 31.57%, 28.90%, and 31.12%, respectively, were achieved. Quadratic effects of elevated CP levels on body fat and body fat deposition were observed at minimum CP levels of 26.55% and 23.77%, respectively; and on body protein, body protein deposition, and nitrogen retention efficiency at maximum CP levels of 29.26%, 32.50%, and 27.21%, respectively. We conclude that a CP level of 31.57% is recommended for the diets of tambaqui fingerlings weighing between 0.35 and 15.11 g, which corresponds to a digestible energy:CP ratio of 9.50 kcal DE/g CP.
Keywords:Performance. Initial phase. Protein nutrition.
PROTEÍNA BRUTA EM DIETAS PARA ALEVINOS DE TAMBAQUI, COLOSSOMA MACROPOMUM (Cuvier, 1818)
RESUMO – O tambaqui é utilizado intensamente na piscicultura em virtude de suas características produtivas, porém há carência de informações sobre suas exigências nutricionais. Objetivou-se avaliar os efeitos de níveis de proteína bruta (PB) em dietas para alevinos de tambaqui. Utilizou-se 750 alevinos com peso inicial de 0,35 ± 0,09 g, em delineamento inteiramente casualizado, com seis tratamentos (rações experimentais com 20, 24, 28, 32, 36 e 40% de PB), cinco repetições e 25 peixes por unidade experimental. Avaliou-se desempenho, taxa de sobrevivência, rendimento de carcaça, composição corporal, deposição de proteína e gordura corporais e eficiência de retenção de nitrogênio, após o período de 45 dias. Os níveis de PB não influenciaram: consumo de ração, taxa de sobrevivência, umidade corporal e rendimento de carcaça. O consumo de PB aumentou e a taxa de eficiência proteica reduziu com a elevação dos níveis de PB. O ganho de peso, a conversão alimentar e a taxa de crescimento específico melhoraram até o nível de 31,57; 28,90 e 31,12% de PB, respectivamente. Observou-se efeito quadrático da elevação dos níveis de PB sobre a gordura corporal, deposição de gordura corporal, proteína corporal, deposição de proteína corporal e eficiência de retenção de nitrogênio, apresentando nível mínimo em 26,55; 23,77% de PB; e nível máximo em 29,26; 32,50; 27,21% de PB, respectivamente. Concluiu-se que o nível de PB recomendado em dietas para alevinos de tambaqui de 0,35 a 15,11 g é de 31,57%, que corresponde a uma relação energia digestível: PB de 9,50 kcal de ED/g de PB.
Palavras-chave:Desempenho. Fase Inicial. Nutrição proteica.
_________________________
*Author for correspondence
1Received for publication in 06/11/2014; accepted in 11/18/2015.
Part of the first author's Master's thesis in Animal Science.
2Center for Agricultural and Environmental Sciences, Universidade Federal do Maranhão, Chapadinha, MA, Brazil;
charlyansl@yahoo.com.br, madbomfim@yahoo.com.br, jc.siqueira@ufma.br, felipebribeiro@yahoo.com.
3Center for Agricultural Sciences, Department of Animal Science, Universidade Federal de Viçosa, Viçosa, MG, Brazil;
INTRODUCTION
Tambaqui (Colossoma macropomum, Cuvier, 1818) is a freshwater species native to the Amazon region that has been successfully introduced to the intensive fish farming industry of Brazil, owing to its characteristics of adaptation to captivity, high prolificacy, rapid growth, omnivorous feeding habits, acceptance of artificial feed, white meat color, and acceptance by the consumer market (MENDONÇA et al., 2009; GOMES; SIMÕES; ARAÚJO-LIMA, 2010; OISHI; NWANNA; PEREIRA FILHO, 2010; RODRIGUES, 2014; SILVA; FUJIMOTO, 2015).
Despite its production characteristics, there is still a significant lack of information on the nutritional requirements of tambaqui (DAIRIKI; SILVA, 2011; RODRIGUES, 2014). There is great disparity in the recommended dietary crude protein level during the nursery phase, 22% to 50% CP (VIDAL JÚNIOR et al., 1998; SILVA et al., 2006; OISHI; NWANNA; PEREIRA FILHO, 2010; SANTOS et al., 2010), owing to varying experimental conditions (diet, water quality, stock density, etc.) that can affect the results (RODRIGUES, 2014). Thus, it is essential to adapt the management of fish farming systems, to avoid any adverse effects on growth performance.
The use of protein-deficient diets, with poor composition or inadequate amino acid bioavailability can result in reduced growth rates and feed efficiency due to the mobilization of protein from some tissues to maintain vital functions. On the other hand, excess protein in the diet can be used as an energy source that can effectively reduce feed conversion, increase nitrogen excretion in the urine, and increase production costs (NRC, 2011; FRACALOSSI; CYRINO, 2013). Owing to the wide variation in recommended levels, it is necessary to conduct additional studies aimed at determining with higher precision the required dietary protein levels specifically for the nursery phase.
Thus, the present study aimed to evaluate the effects of various crude protein levels in the feed of tambaqui fingerlings.
MATERIAL AND METHODS
The study was conducted at the Sector of Fish Nutrition Studies of the Center for Agricultural and Environmental Sciences, Federal University of Maranhão (UFMA), in Chapadinha, MA, Brazil, and lasted for 45 days, between September and October 2012.
During the pre-experimental period, fish were adapted to the facilities and experimental management, during which they were fed corn- and soybean meal-based diets containing 32% crude protein and 3,000 kcal digestible energy (DE)/kg. During the experimental period, 750 tambaqui (C. macropomum) fingerlings, with initial weights of 0.35 ± 0.09 g, were selected and distributed in a completely randomized design among six treatments, with five replicates, and 25 fish per experimental unit.
The fingerlings were kept in 30 polyethylene aquariums (an experimental unit), each with a capacity of 500 L and a working volume of 300 L, equipped with individual water supply and bottom drainage systems, in a recirculation system.
The treatments comprised six isoenergetic, isocalcic, and isophosphoric experimental diets containing different levels of crude protein (CP) (20%, 24%, 28%, 32%, 36%, and 40%) (Table 1). The minimum amino acid level, calculated as a percentage of the CP content of the feed, was estimated based on the nutritional requirement suggested for Nile tilapia by Furuya et al. (2010).
The diets were analyzed at the Animal Nutrition Laboratory of the Brazilian Agricultural Research Corporation, Goats and Sheep Unit, Sobral, CE, Brazil, to determine the protein levels by the micro Kjeldahl method, according to the procedures outlined by Silva and Queiroz (2002).
Water was supplied to the aquariums from an artesian well of the Center for Agricultural and Environmental Sciences of the UFMA.
Water temperature was monitored daily, from 7:30 AM to 5:30 PM, using a mercury bulb thermometer, graduated from 0°C to 50°C. The pH, dissolved oxygen content in water, and toxic ammonia were monitored every seven days, using a pH meter (Hanna HI 8424), oximeter (Hanna HI 9146), and commercial colorimetry kit (Arcor) to measure toxic ammonia, respectively.
Fish were weighed at the onset and at the end of the study. After the experimental period, the following performance indices were evaluated: survival rate (SR) = 100[quantity of fish at the end / quantity of fish at the onset]; feed conversion (FC) = 100[(quantity of feed (g)/fish biomass (g)]; crude protein intake (CPI) = feed conversion × crude protein percentage/100; protein efficiency ratio
(PER) = weight gain (g)/ crude protein intake (g); weight gain (WG) = (mean final weight – mean initial weight); feed conversion (FC) = (final weight – initial weight)/feed consumed within the period; the following equation was adopted using logarithmic transformations to determine specific growth rate (SGR):
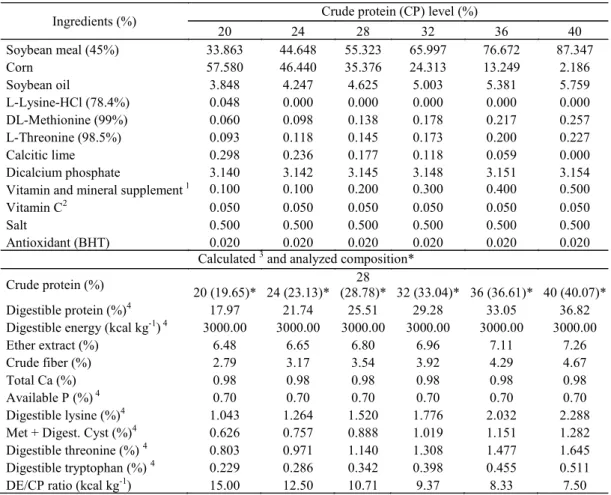
Table 1. Percentage and chemical composition of the experimental diets (natural sources)
Ingredients (%) Crude protein (CP) level (%)
20 24 28 32 36 40
Soybean meal (45%) 33.863 44.648 55.323 65.997 76.672 87.347
Corn 57.580 46.440 35.376 24.313 13.249 2.186
Soybean oil 3.848 4.247 4.625 5.003 5.381 5.759
L-Lysine-HCl (78.4%) 0.048 0.000 0.000 0.000 0.000 0.000
DL-Methionine (99%) 0.060 0.098 0.138 0.178 0.217 0.257
L-Threonine (98.5%) 0.093 0.118 0.145 0.173 0.200 0.227
Calcitic lime 0.298 0.236 0.177 0.118 0.059 0.000
Dicalcium phosphate 3.140 3.142 3.145 3.148 3.151 3.154
Vitamin and mineral supplement 1 0.100 0.100 0.200 0.300 0.400 0.500
Vitamin C2 0.050 0.050 0.050 0.050 0.050 0.050
Salt 0.500 0.500 0.500 0.500 0.500 0.500
Antioxidant (BHT) 0.020 0.020 0.020 0.020 0.020 0.020
Calculated 3 and analyzed composition*
Crude protein (%)
20 (19.65)* 24 (23.13)* 28
(28.78)* 32 (33.04)* 36 (36.61)* 40 (40.07)*
Digestible protein (%)4 17.97 21.74 25.51 29.28 33.05 36.82
Digestible energy (kcal kg-1) 4 3000.00 3000.00 3000.00 3000.00 3000.00 3000.00
Ether extract (%) 6.48 6.65 6.80 6.96 7.11 7.26
Crude fiber (%) 2.79 3.17 3.54 3.92 4.29 4.67
Total Ca (%) 0.98 0.98 0.98 0.98 0.98 0.98
Available P (%) 4 0.70 0.70 0.70 0.70 0.70 0.70
Digestible lysine (%)4 1.043 1.264 1.520 1.776 2.032 2.288
Met + Digest. Cyst (%)4 0.626 0.757 0.888 1.019 1.151 1.282
Digestible threonine (%) 4 0.803 0.971 1.140 1.308 1.477 1.645
Digestible tryptophan (%) 4 0.229 0.286 0.342 0.398 0.455 0.511
DE/CP ratio (kcal kg-1) 15.00 12.50 10.71 9.37 8.33 7.50
*Analyzed at the Animal Nutrition Laboratory of the EMBRAPA Goats and Sheep.
1Commercial vitamin and mineral supplement (5 kg/t), with assurance levels per kg of the product: Vit. A,
1,200,000 IU; Vit. D3, 200,000 IU; Vit. E, 1,200 mg; Vit. K3, 2,400 mg; Vit. B1, 4,800 mg; Vit. B2, 4,800 mg;
Vit. B6, 4,800 mg; Vit. B12, 4,800 mg; Vit. C, 48,000 mg; Folic acid, 1,200 mg; Ca pantothenate, 12,000 mg;
biotin, 48 mg; choline chloride, 108 g; niacin, 24,000 mg; Fe, 50,000 mg; Cu, 3,000 mg; Mn, 20,000 mg; Zn, 30,000 mg; I, 100 mg; Co, 10 mg; Se, 100 mg.
2Vit. C: ascorbic acid 2-monophosphate calcium salt, 42% active ingredient.
3Based on values proposed by Rostagno et al. (2011).
4Based on phosphorus availability coefficients proposed for Nile tilapia by Furuya et al. (2010); and corn, soybean meal, and soybean oil proposed by Vidal Júnior (2004).
SGR = Ln of the final weight (g) - Ln of the initial weight (g) × 100 Experimental duration (days)
For body composition analyses, both at the onset (50 g fish sample) and at the end of the study (all fish from each experimental unit), the fish were stunned, euthanized, and frozen.
Before being frozen, six fish per experimental unit, with weights corresponding to the mean weight of the respective unit, were eviscerated to determine carcass yield. Carcass yield (%) was calculated by dividing the weight of the eviscerated fish by the
weight of the whole fish (with viscera), multiplied by 100.
After freezing, the fish (carcasses and viscera) were lyophilized, ground in a ball mill, and placed in containers for further laboratory analyses. The chemical composition (moisture, protein, and fat levels) of the samples were analyzed according to the procedures outlined by Silva and Queiroz (2002).
calculated: protein deposition = [(final protein (mg) - initial protein (mg)]/experimental period (days); fat deposition = [(final fat (mg) - initial fat (mg)]/ experimental period (days); nitrogen retention efficiency (%) = [(final body nitrogen - initial body nitrogen)/total nitrogen intake] × 100
Homoscedasticity and normality of errors were tested, using the Brown-Forsythe and Cramer-Von Mises tests on the performance variables and body composition. When the relevant assumptions were met, the data were subjected to analysis of variance at a probability level of 5%.
The effects of CP levels were analyzed using first and second order polynomial regression models or discontinuous “Linear Response Plateau” (LRP) models, according to the best fit for each variable. Statistical analyses were performed using the SAS 9.0 software(2002).
RESULTS AND DISCUSSION
The following values were obtained during the experimental period: water temperature of 26.8° C ± 0.48°C and 28.6°C ± 0.65°C in the morning and afternoon, respectively; pH of 5.8 ± 0.25; dissolved oxygen of 6.7 ± 0.83 mg L-1; and total ammonia of 0.40 ± 0.12 mg L-1. These values remained within the ranges recommended for rearing this species (average temperature of 28°C; pH between 4 and 6 mg L-1; dissolved oxygen above 3 mg L-1; non-ionized ammonia concentration of 0.46 mg L-1), according to Gomes, Simões and Araújo-Lima (2010) and Mendonça et al. (2012).
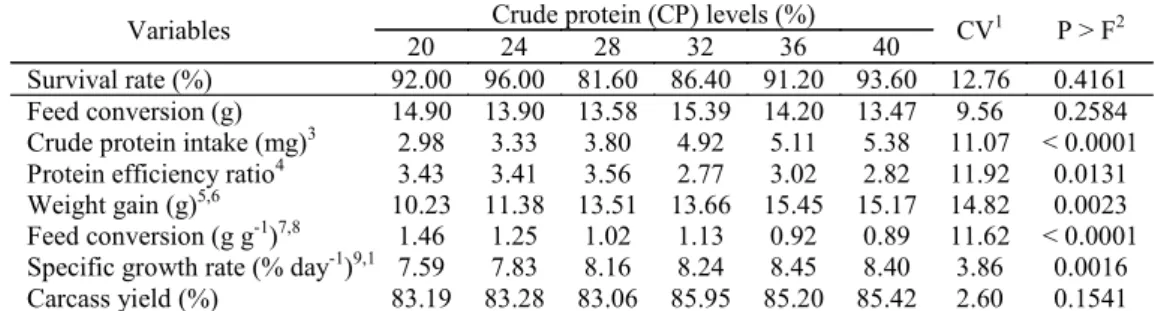
Variations in CP levels did not affect feed conversion, survival rate, and carcass yield of fish (P > 0.05). However, the other variables were affected (P < 0.05) by the various treatments (Table 2).
Table 2. Performance, feed efficiency, survival rate, and carcass yield of tambaqui fingerlings as a
function of protein level in the feed.
Variables Crude protein (CP) levels (%) CV1 P > F2
20 24 28 32 36 40
Survival rate (%) 92.00 96.00 81.60 86.40 91.20 93.60 12.76 0.4161
Feed conversion (g) 14.90 13.90 13.58 15.39 14.20 13.47 9.56 0.2584
Crude protein intake (mg)3 2.98 3.33 3.80 4.92 5.11 5.38 11.07 < 0.0001
Protein efficiency ratio4 3.43 3.41 3.56 2.77 3.02 2.82 11.92 0.0131
Weight gain (g)5,6 10.23 11.38 13.51 13.66 15.45 15.17 14.82 0.0023
Feed conversion (g g-1)7,8 1.46 1.25 1.02 1.13 0.92 0.89 11.62 < 0.0001
Specific growth rate (% day-1)9,10 7.59 7.83 8.16 8.24 8.45 8.40 3.86 0.0016
Carcass yield (%) 83.19 83.28 83.06 85.95 85.20 85.42 2.60 0.1541
1Coefficient of variation (%); 2Significance of the analysis of variance “F” test; 3Linear effect: Ŷ =
-0.069X + 0.143 (r2 = 0.92); 4Linear effect: Ŷ = 4.394X – 0.041 (r2 = 0.69); 5Linear Response Plateau
Effect: Ŷ = 14.84 – 0.410X (R2 = 0.92), plateau: Ŷ = 14.84; 6Linear effect: Ŷ = 5.332X + 0.268 (r2 =
0.92); 7Linear Response Plateau Effect: Ŷ = 0.97 - 0.055X (R2 = 0.87), plateau: Ŷ = 0.974; 8Linear effect: Ŷ = 1.914X + 0.027 (r2 = 0.84); 9Linear Response Plateau Effect: Ŷ = 8.378 - 0.072X (R2 =
0.96), plateau: Ŷ = 8.377; 10Linear effect: Ŷ = 6.821X + 0.043 (r2 = 0.90).
No variation was observed in the parameter of feed conversion and this could be attributed to the fact that the diets were isoenergetic, and the energy level of the diet can limit the feed conversion of the fish (FRACALOSSI; CYRINO, 2013; SAKOMURA et al., 2014). Vidal Júnior et al. (1998), in evaluating the protein requirements of tambaqui during the growth phase in which body weight averages between 30 and 250 g, also detected no significant differences in feed conversion even with increasing protein levels in the feed.
Since feed conversion did not vary, consequently, CP intake increased in a linear manner (P < 0.01) with increasing protein levels in the diet.
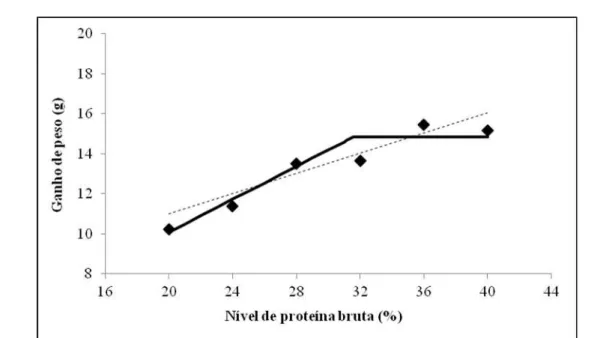
WG increased in a linear manner (P < 0.01) with increasing CP levels in the feed. However, the data was best fit to the “Linear Response Plateau” (LRP) model and a CP level of 31.57% was estimated, based on the occurrence of a plateau at 14.84 g (Table 1 and Figure 1). PER decreased in a linear manner (P < 0.05) with increasing protein levels in the feed.
The response fitted to the LRP model in the present study was consistent with that observed by Bomfim et al. (2005), who reported a linear increase in WG in "curimbatá" (Prochilodus affinis) fingerlings, and the occurrence of a plateau at one of the intermediate CP levels evaluated. In contrast, the present results differ from those obtained by Vidal Júnior et al. (1998), who found a quadratic effect on weight gain, with variations in dietary protein levels in tambaquis weighing 30–250 g.
Figure 1. Weight gain in tambaqui fingerlings as a function of protein level in the feed.
In the present study, considering that there was no variation in FC, and consequently, no variations in energy and other nutrients (isoenergetic, isocalcic, and isophosphoric diets), it can be inferred that WG was only affected by variations in CPI, which exhibited a linear effect. In contrast, although it did not significantly improve WG, the CPI provided by diets with levels above 31.57%, did not adversely affect feed conversion. In addition, protein was most likely used as an energy source (BOMFIM, 2013; FRACALOSSI; CYRINO, 2013).
PER decreased in a linear manner (P < 0.05) with increasing CP levels. However, this effect became more evident starting with use of the feed containing 28% CP, indicating reduced efficiency of protein deposition and increased proportions of protein directed toward the provision of energy, gluconeogenesis, or lipogenesis (NRC, 2011: BOMFIM, 2013; FRACALOSSI; CYRINO, 2013).
Other studies have reported similar findings, in which reduced PER has been observed with increasing protein concentrations in the diets of fish (VIDAL JÚNIOR et al., 1998; COTAN et al., 2006; COSTA; MELO; CORREIA, 2009; BICUDO; SADO; CYRINO, 2010). In contrast, Bomfim et al. (2005) reported that elevated CP levels in "curimbatá" fingerlings improved PER up to a certain level; suggesting that PER can be improved until the protein requirement is achieved and subsequently decreases with further increases in protein levels.
Similar to that observed with weight gain, the specific growth rate (SGR) increased in a linear manner (P < 0.01) with increasing CP levels. The data was best fit to the “Linear Response Plateau” (LRP) model and a CP level of 31.12% was estimated, based on the occurrence of a plateau at 8.377% day-1.
The present results are consistent with those
obtained by Souza et al. (2011), who found that SGR exhibited an increasing linear effect, with increasing protein levels in the diet of fat snook juveniles. Vásquez-Torres, Pereira Filho and Arias-Castellanos (2011) also found that red pacu (Piaractus brachypomus) juveniles exhibited the highest specific growth rate, when fed diets containing elevated CP levels (up to 32% CP).
In the case of feed conversion, despite significant linear variation (P < 0.01), the data was best fit to the “Linear Response Plateau” (LRP) model and a CP level of 28.91% was estimated, based on the occurrence of a plateau at 0.974 g g-1.
In a study conducted by Bittencourt et al. (2010) with "piavuçu" fingerlings and a study by Souza et al. (2011) with fat snook juveniles, apparent feed conversion improved in a linear manner with increasing protein concentrations in the diet.
However, Bomfim et al. (2005) reported that feed conversion in "curimbatá" improved in a quadratic manner, owing to variations in protein levels. In other studies, variations in protein levels did not affect feed conversion in Nile tilapia (BOTARO et al., 2007) and tambaqui (VIDAL JÚNIOR et al., 1998).
The more favorable values for FC observed in fish fed higher levels of CP could be attributed to their higher growth rates (BOMFIM et al., 2005) and particularly their lean muscle tissue, since FC was similar among the various protein levels evaluated. This hypothesis relates to the protein content of muscle tissue on a dry matter basis, which is comparatively lower than that of adipose tissue. Thus, fish tend to use feed more efficiently for protein deposition (Tables 2 and 3) (NRC, 2011; BOMFIM, 2013; SAKOMURA et al., 2014).
85.95%, similar to that reported by Reidel et al. (2010) (between 78% and 87%) in silver catfish and Signor et al. (2010) (between 84.69% and 85.01%) in "pacus."
Moisture content (P > 0.05) remained unaffected by variations in CP levels (Table 3). In
contrast, Bomfim et al. (2005) and Cotan et al. (2006) have shown lower moisture levels in "curimbatá" fingerlings and "lambari tambiú" fingerlings, respectively, that were fed diets comprising relatively low levels of CP, compared to those fed higher levels of CP.
Table 3. Body composition, body protein, fat deposition, and nitrogen retention efficiency of tambaqui
fingerlings fed diets containing various protein levels.
Variables Crude protein (CP) level (%) CV1 P > F2
Initial 20 24 28 32 36 40
Moisture content (%) 78.45 78.41 80.00 79.81 80.43 81.63 81.54 2.83 0.2617
Body fat (%)3 1.65 2.60 2.67 2.79 2.08 3.24 4.03 9.71 < 0.0001
Body protein (%)4 22.57 12.68 12.70 14.48 13.28 14.68 10.74 10.75 0.0029
Body fat deposition (mg day-1)5 --- 6.27 5.83 7.75 5.60 11.22 12.32 19.93 < 0.0001
Body protein deposition (mg day-1) --- 28.15 31.97 40.39 41.44 53.63 32.19 17.54 0.0002
Nitrogen retention efficiency (%)7 --- 42.31 38.09 47.60 37.81 44.04 29.55 15.63 0.0038
1Coefficient of variation (%); 2Significance of the analysis of variance “F” test; 3Quadratic effect: Ŷ = 8.57
-0.465X + 0.0087X2 (R2 = 0.78); 4Quadratic effect: Ŷ = - 5.91 + 1.374X - 0.0234X2 (R2 = 0.54); 5Quadratic effect:
Ŷ = 20.45 - 1.216X + 0.0256X2 (R2 = 0.78); 6Quadratic effect: Ŷ = - 81.44 + 7.736X + 0.1190X2 (R2 = 0.60);
7Quadratic effect: Ŷ = - 0.073 + 3.567X - 0.0691X2 (R2 = 0.46).
Body fat levels decreased in a quadratic manner (to yield a minimum value of 2.36%), until
an estimated CP level of 26.55% was achieved (Table 3). These results differ from those of Bomfim et al. (2005), who reported reduced body fat
in "curimbatá", with increasing CP levels.
With increasing CP levels, body protein content improved in a quadratic manner (to yield a maximum value of 14.26%), until an estimated CP level of 29.26% was achieved (Table 3). Bittencourt et al. (2010) found higher protein levels in the carcasses of "piavuçu" (Leporinus macrocephalus) fingerlings fed 30% CP, in comparison to those fed higher levels of CP.
With increasing CP levels, body fat deposition decreased in a quadratic manner (to yield a minimum value of 6.01%) until an estimated CP level of 23.77% was achieved (Table 3). In contrast, with increasing CP, body protein deposition increased in a quadratic manner (to yield a maximum value of 44.29%) until a CP level of 32.50% was achieved (Table 3). These results corroborate those of Oishi, Nwanna and Pereira Filho (2010) and Santos et al. (2010), who reported that protein deposition rates are closely related to protein concentration in the diet.
Improved protein content of the fish carcass with increasing protein levels in the diet should increase the availability of amino acids for protein deposition, until the estimated requirement is attained. Above this value, the reductions observed among these parameters are most likely due to the higher availability of net energy used for body fat deposition, caused by elevated fat levels in feed containing higher CP levels (BOMFIM et al., 2010; NRC, 2011; SAKOMURA et al., 2014).
With increasing CP levels, nitrogen retention efficiency – NRE increased in a quadratic manner (to
yield a maximum value of 44.79%), until an estimated CP level of 27.21% was achieved. The reduced nitrogen retention efficiency observed at lower CP levels (which were higher than the estimated maximum level) are most likely related to the increased proportion of protein used for maintenance requirements in comparison to that used for protein deposition in the first instance, and due to the consumption of additional protein for energy generation in the second instance (BOMFIM et al., 2010).
Similar responses for NRE have been reported by Bomfim et al. (2005) in curimbatás. In contrast, Cotan et al. (2006) found higher NRE values in "lambari tambiú" fingerlings fed diets with lower protein levels.
Based on the results of the present study and considering that weight gain has been the main variable used in determining nutritional requirements in fish (NRC, 2011), a CP level of 31.57% is recommended for the diets of tambaqui fingerlings weighing between 0.35 and 15.8 g. However, we suggest that further studies be conducted, aimed at determining the economic viability of producing feed at the recommended CP level.
CONCLUSIONS
The recommended CP level of 31.57% in the diets of tambaqui fingerlings weighing between 0.35 and 15.11 g, corresponds to a digestible energy:CP ratio of 9.50 kcal DE/g CP and facilitates greater weight gain.
We thank the Foundation of Support for Scientific and Technological Research and Development of Maranhão for financial support.
REFERENCES
BICUDO, A. J. A.; SADO, R. Y.; CYRINO, J. E. P. Growth performance and body composition of pacu
Piaractus mesopotamicus (Holmberg 1887) in
response to dietary protein and energy levels. Aquaculture Nutrition, Malden, v. 16, n. 2, p. 213 –222, 2010.
BITTENCOURT, F. et al. Proteína e energia em rações para alevinos de piavuçu. Revista Brasileira de Zootecnia, Viçosa, v. 39, n. 12, p. 2553-2559, 2010.
BOMFIM, M. A. D. Estratégias nutricionais para redução das excreções de nitrogênio e fósforo nos sistemas de produção de peixes no Nordeste: sustentabilidade ambiental e aumento da produtividade. Revista Científica de Produção Animal, Teresina, v. 15, n. 2, p. 122-140, 2013.
BOMFIM, M. A. D. et al. Níveis de lisina, com base no conceito de proteína ideal, em rações para alevinos de tilápia-do-nilo. Revista Brasileira de Zootecnia, Viçosa, v. 39, n. 1, p. 1-8, 2010.
BOMFIM, M. A. D. et al. Proteína bruta e energia digestível em dietas para alevinos de curimbatá
(Prochilodus affins). Revista Brasileira de
Zootecnia, Viçosa, v. 34, n. 6, p. 1795–1806, 2005.
BOTARO, D. et al. Redução da proteína da dieta com base no conceito de proteína ideal para tilápias do Nilo (Oreochromis nilotucus) criadas em tanques-rede. Revista Brasileira de Zootecnia, Viçosa, v. 36, n. 3, p. 517-525, 2007.
COTAN, J. L. V. et al. Níveis de energia digestível e proteína bruta em rações para alevinos de lambari tambiú. Revista Brasileira de Zootecnia, Viçosa, v. 35, n. 3, p. 634-640, 2006.
COSTA, M. L. S.; MELO, F. P.; CORREIA, E. S. Efeitos de diferentes níveis proteicos da ração no crescimento na tilápia do Nilo (Oreochromis niloticus Linnaeus, 1757), variedade Chitralada, criadas em tanques-rede. Boletim do Instituto de Pesca, São Paulo, v. 35, n. 2, p. 285-294, 2009.
DAIRIKI, J. K.; SILVA, T. B. A. Revisão de literatura: exigências nutricionais do tambaqui – compilação de trabalhos, formulação de ração adequada e desafios futuros. Manaus: Embrapa Amazônia Ocidental, 2011. 44 p (Embrapa Amazônia Ocidental, 91).
FRACALOSSI, D. M.; CYRINO, J. E. P. Nutriaqua: nutrição e alimentação de espécies de interesse para a aquicultura brasileira. Florianópolis, SC: Sociedade Brasileira de Aquicultura e Biologia Aquática, 2013. 375 p.
FURUYA, W. M. Tabelas brasileiras para nutrição de tilápias. Toledo, PR: GFM, 2010. 100 p.
GOMES, L. C.; SIMÕES, L. N.; ARAÚJO-LIMA, C. A. R. M. Tambaqui (Colossoma macropomum). In: BALDISSEROTTO, B.; GOMES, L.C. (Ed.). Espécies nativas para piscicultura no Brasil. 2. ed. Santa Maria: Editora UFSM, 2010. cap. 7, p. 175 -204.
MENDONÇA, P. P. et al. Efeito da suplementação de fitase na alimentação de juvenis de tambaqui
(Colossomama cropomum). Archivos de Zootecnia,
Córdoba, v. 61, n. 235, p. 437-448. 2012.
MENDONÇA, P. P. et al. Influência do fotoperíodo no desenvolvimento de juvenis de tambaqui
(Colossomama cropomum). Archivos de Zootecnia,
Córdoba, v. 58, n. 223, p. 323-331, 2009.
NATIONAL RESEARCH COUNCIL – NRC. Nutrient requirements of fish and shrimp. Washington, D.C.: National Academy Press, 2011. 376 p.
OISHI, C. A.; NWANNA, L. C.; PEREIRA FILHO, M. Optimum dietary protein requirement for Amazonian Tambaqui, Colossoma macropomum Cuvier, 1818, fed fish meal free diets. Acta Amazonica, Manaus, v. 40, n. 4, p. 757–762, 2010.
REIDEL, A. et al. Rendimento corporal e composição química de jundiás alimentados com diferentes níveis de proteína e energia na dieta, criados em tanques-rede. Revista Brasileira de Zootecnia, Viçosa, v. 39, n. 2, p. 233-240, 2010.
ROSTAGNO, R. S. et al. Tabelas brasileiras para aves e suínos – composição de alimentos e exigências nutricionais. 2. ed. Viçosa, MG: Universidade Federal de Viçosa, 2011. 252 p.
RODRIGUES, A. P. O. Nutrição e alimentação do tambaqui (Colossoma macropomum). Boletim do Instituto de Pesca, São Paulo, v. 40, n. 1, p. 135 – 145, 2014.
SAKOMURA, N. K. et al. Nutrição de Não Ruminantes. Jaboticabal, SP: Editora Funep, 2014. 676 p.
597-604, 2010.
SIGNOR, A. A. et al. Proteína e energia na alimentação de pacus criados em tanques-rede. Revista Brasileira de Zootecnia, Viçosa, v. 39, n. 11, p. 2336-2341, 2010.
SILVA, C. A.; FUJIMOTO, R. Y. Crescimento de tambaqui em resposta a densidade de estocagem em tanques-rede. Acta Amazonica, Manaus, v. 45, n. 3, p. 323-332, 2015.
SILVA, L. C. R. et al. Níveis de treonina em rações para tilápias-do-Nilo, Revista Brasileira de Zootecnia,Viçosa, v. 35, n. 4, p. 1258-1264, 2006.
SILVA, D. J.; QUEIROZ, A. C. Análise de alimentos: métodos químicos e biológicos. 3. ed. Viçosa, MG: Universidade Federal de Viçosa, 2002. 235 p.
SOUZA, J. H. et al. Desempenho zootécnico e econômico de juvenis de robalo‑peva alimentados com dietas contendo diferentes concentrações proteicas. Pesquisa Agropecuária Brasileira, Brasília, v. 46, n. 2, p. 190-195, 2011.
STATISTICAL ANALYSES SYSTEM – SAS. SAS/ INSIGHT User’sguide. Versão 9.0 – versão para Windows. Cary: SAS Institute, 2002. CD -ROM.
VÁSQUEZ-TORRES, W.; PEREIRA FILHO, M.; ARIAS-CASTELLANOS, J. A. Optimum dietary crude protein requeriment for juvenile cachama
Piaractus brachypomus. Ciência Rural, Santa
Maria, v. 41, n. 12, p. 2138-2189, 2011.
VIDAL JÚNIOR, M. V. et al. Níveis de proteína para tambaqui (Colossoma macropomum Cuvier, 1818) dos 30 aos 250 g de peso vivo. Desempenho dos Tambaquis. Revista Brasileira de Zootecnia, Viçosa, v. 27, n. 3, p. 421-426, 1998.
VIDAL JÚNIOR, M. V. et al. Determinação da digestibilidade da matéria seca e da proteína bruta do fubá de milho e do farelo de soja para tambaqui
(Colossoma macropomum), utilizando-se técnicas