///
NOVA Information Management School
Instituto
Superior
de
Estatística
e
Gestão
de
InformaçãoUniversidade Nova de Lisboa
C
ALLS
’ T
OPIC
R
ECOGNITION
by
Juan Manuel Barco
Internship report presented as a partial requirement for obtaining the Master's degree in Advanced Analytics
Advisor / Co-Advisor: Mauro Castelli
September 2018
ABSTRACT
This report describes how is used the LDA, a well-known Natural Language Processing (NLP) algorithm, by Talkdesk Data Science team for extracting topics from calls. The goal is to explain how Talkdesk is improving its product and its customer service by the usage of the LDA algorithm. After the explanation of what is a call center and how it could implement a LDA model, it will be presented the results of the LDA in the Talkdesk Support Calls, the principal insights that could be obtained from the topics, how Talkdesk is going to use this information, and what are going to be the next steps to industrialize this algorithm as a product.
Este relatório descreve como o LDA, um reconhecido algoritmo de Processamento de Linguagem Natural (PLN), é usado pela equipa de Ciência de Dados da Talkdesk para extração de tópicos de chamadas telefónicas. O objetivo é demonstrar como a Talkdesk está a melhorar o seu produto e nível de serviço ao cliente através da utilização do algoritmo LDA. Após a introdução do que é um call center e de que forma é possível nele implementar um modelo LDA, são apresentados os resultados do LDA nas Chamadas de Suporte Talkdesk, as principais conclusões que podem ser retiradas dos tópicos extraídos, como a Talkdesk usa essa informação, e quais os próximos passos no sentido de comercializar este algoritmo enquanto produto.
KEYWORDS
LDA; Topic Recognition; NLP; Call Center;
INDEX
1. Introduction ... 14
2. Literature Review - Topic Recognition ... 15
2.1. What is topic modeling? ... 15
2.1.1. Latent Semantic Analysis ... 16
2.1.2. Probabilistic Latent Semantic Analysis ... 17
2.1.3. Latent Dirichlet Allocation ... 18
3. Related work ... 19
3.1. The Case Law Analytics ... 19
3.2. Topic Modeling in Twitter ... 20
3.3. Bioinformatics and topic modeling ... 21
4. Methodology ... 22
4.1. What is Talkdesk? ... 22
4.2. What is a call center? ... 22
4.3. What are the challenges for the call centers? ... 23
4.4. How do calls work in a call center? ... 24
4.5. What are the challenges when routing a call? ... 25
4.6. Automated Implementation in Talkdesk ... 26
4.6.1. Call Data Collector ... 27
4.6.2. Recording Collector ... 27 4.6.3. Audio Processing ... 27 4.6.4. Transcription ... 27 4.6.5. Anonymization ... 28 4.6.6. Text Preprocessing ... 28 4.6.7. Topic Extraction ... 30 4.6.8. Topic Labeling... 31
4.6.9. Assigning topics to calls ... 31
4.7. Results ... 32
4.7.1. Exploratory Data Analysis (EDA) ... 32
4.7.2. LDA topics ... 34
4.7.3. Assigning topics to calls ... 39
4.7.4. Evolution of topics through time. ... 40
4.7.5. The optimal number of topics ... 41
5. Conclusions ... 42
6. Limitations and recommendations for future works ... 43
7. Bibliography ... 44
LIST OF FIGURES
Figure 1: Extract of music article with highlighted words ... 15
Figure 2: Probability graph for PLSA ... 17
Figure 3: Similarity between LSA and PLSA ... 18
Figure 4: Best topics with label ... 20
Figure 5: Process of inbound Call ... 25
Figure 6: Words with more than 200 occurrences ... 32
Figure 7: Oral speech words ... 33
Figure 8: Bigrams with more than 20 occurrences ... 33
Figure 9: Topic 1 - words probability ... 34
Figure 10: Topic 2 - words probability ... 35
Figure 11: Topic 3 - words probability ... 36
Figure 12: Topic 4 - words probability ... 36
Figure 13: Topic 5 - words probability ... 37
Figure 14: Topic 7 - words probability ... 37
Figure 15: Topic 7 - words probability ... 38
Figure 16: Topic 8 - words probability ... 38
Figure 17: Topic 9 - words probability ... 39
Figure 18: Topic 10 - words probability ... 39
Figure 19: Most important topics through days ... 40
Figure 20: Optimal number of topics comparison ... 41
Figure 21: Topic 4 vs Topic 7 main words ... 42
LIST OF TABLES
Table 1: Driver stemming and lemmatizing comparison ... 29 Table 2: Be Stemming and Lemmatizing comparison ... 29
LIST OF ABBREVIATIONS AND ACRONYMS
LDA AI LSA PLSA SVDLatent Dirichlet Allocation Artificial Intelligence Latent Semantic Analysis
Probabilistic Latent Semantic Analysis Single Value Decomposition
1. Introduction
Nowadays, knowledge continues to be digitalized and stored in the form of news, blogs, Web pages, scientific articles, books, images, sound, video, and social networks. The amount of data is so big that It becomes more difficult to find and discover what we are looking for (Blei, 2012). Furthermore, more than 80% of all potentially useful business information is unstructured data, in kind of sensor readings, console logs and so on. The large number and complexity of unstructured data opens up many new possibilities for the analyst (Das & Kumar, 2013). As an example, in the case of the telecommunication industry, the data that requiresmore space in a company is the call recording. As a result, companies are dealing to find the appropriateway to create new computational tools to help organize, search, and understand these vast amounts of information (Blei, 2012).
For the purpose of this report, the unstructured data that will be processed is Audio and Text. For this reason, the main algorithms that will be taken into account are the ones that belong to Text Analytics. Text Analytics is often considered as the next step in Big Data analysis. Text Analytics has a number of subdivisions: Information Extraction, Named Entity Recognition, Semantic Web annotated domain’s representation, and many more. Several techniques are currently used and some of them have gained a lot of attention (Moreno & Redondo, 2016).
On the other hand, companies are now investing huge amount of money in Artificial Intelligence as part of a plan to solve the issues enunciated before. As it was mentioned in an article published by Morgan Stanley, If the AI industry grows at a compound annual rate of 15.4% (the current estimate), it could reach nearly $1 trillion in revenues by 2050 (Helfstein, 2018). As an example, Talkdesk, a cloud-based contact center platform and the company where the internship of this report was done, has decided to create a specific area called “Data Science” in order to research and implement Text Analytics algorithms on the calls stored in the database’s company.
In fact, in 1972, Weizenbaum was suggesting that in the near future, intelligent machines will re-place or enhance human capabilities in many areas previously considered strictly within the human domain (Weizenbaum, 1972) like text understanding, interpretation or even categorization. That is why, currently, Talkdesk decided to create a project in order to research about how AI techniques, in specific text mining algorithms, could help to improve the knowledge of the company and the customers on the data.
As a result, this report provides information about how the area of Data Science within Talkdesk uses AI techniques to help in the daily tasks its support call center and its customers. This report pays particular attention to how Talkdesk uses the LDA model, a topic recognition algorithm, to understand the topics of the calls of its own support call center, and will highlight why it is important for the improvement of the customer service and the product itself. This report also refers to the main strengths and weaknesses of the LDA model and what should Talkdesk do in order to convert it into a product.
2. Literature Review - Topic Recognition
In order to find a way to extract the topics associated to a call that is made by the Talkdesk’s platform, it was made a research on which algorithms are being used to topic extraction and text categorization. This literature review is focused on text mining algorithms. Although the topic extraction is executed on the Talkdesk’s calls and those calls are audio format, it will be explained how the Data Science area takes the audio format of the calls and converts it into a text file in order to minimize the complexity of the project.
2.1. What is topic modeling?
Topic modeling is described as algorithms for discovering the main themes that pervade a large and unstructured collection of documents, in this case, like articles, newspapers, and books (Chang & Boyd-Graber, 2009). Topic models can also organize the collection of documents according to the discovered themes and related words (Blei, 2009, p. 2).
Most of the algorithms for topic models assume that each document is expressed as a mixture of topics. These topic proportions are drawn once per document, and the topics are shared across the corpus (Chang & Boyd-Graber, 2009). For example, consider the article in Figure 1. This article, entitled “Making Music with AI: Some examples” by Ramón LOPEZ DEMANTARAS.
It was squared different words in the article, words with the yellow square are related to music and art, and words squared with red are about Artificial Intelligence. Highlighting all the words could lead to seeing that the article contains each topic in different proportions. In addition, knowing this topic could help to situate in a collection of machine learning articles.
Figure 1: Extract of music article with highlighted words
Without diving into the math behind the model, we can understand a topic model algorithm as being guided by two principles (Blei, 2009, p. 3):
1. Every document is a mixture of topics. Each document may contain words from several topics in particular proportions. For the previous example, in a two-topic model, one could say "Document 1 is 70% topic Music and 30% topic AI"
2. Every topic is a mixture of words. For the previous example, the most common words in the music topic might be “Harmony”, “Melody”, and “Music”, while the AI topic may be made up of words such as “Machine”, “Computational”, and “Intelligence”. Importantly, words can be shared between topics; a word like “process” might appear in both equally. In the following sections it will be explained 3 different approaches to topic recognition: Latent Semantic Analysis, Probabilistic Latent Semantic Analysis and Latent Dirichlet Allocation. Some of them were taken from Chandler May and Francis Ferraro study called “Topic Identification and Discovery on Text and Speech” made in 2015 for the “Proceedings of the 2015 Conference on Empirical Methods in Natural Language Processing” (May & Ferraro 2015).
2.1.1. Latent Semantic Analysis
Latent Semantic Analysis (LSA) is one of the first topic modeling techniques that existed. LSA transformation begins with Singular Value Decomposition (SVD) of a term-document matrix (Deerwester, 1990). With the SVD, the objective is to reduce the amount of terms in semantic dimensions, at the end, the number of semantic dimensions is much lower than the number of terms and each one of these dimensions could be interpreted as a topic (Kuta & Kitowski, 2014).
The first step is to create the document-term matrix based on the corpus. Given m documents and n words in the vocabulary, it is possible to construct an m × n matrix A in which each row represents a document and each column represents a word. This is usually a very sparse matrix.
The simplest LSA count the number of times the j-th word appeared in the i-th document. However, raw counts do not account the significance of each word in the document. Thus, it is not particularly good to deal with stop words. Consequently, the paper of Nakov and Popova proposed that LSA models that typically replace raw counts in the document-term matrix with a tf-idf score. Tf-idf, or term frequency-inverse document frequency, assigns a weight for term j in document i. Basically, the more frequently the term appears in the document, the smaller its weight, and the more infrequently it appears across the corpus, the greater its weight (Nakov & Popova, 2001).
The Second step is to convert the document-term matrix A into a readable, low-dimension, no sparse matrix. This dimensionality reduction can be performed using SVD. SVD, or singular value decomposition, is a technique in linear algebra that factorizes any matrix M into the product of 3 separate matrices: M=U*S*V, where S is a diagonal matrix of the singular values of M. Critically, truncated SVD reduces dimensionality by selecting only the t largest singular values, and only keeping the first t columns of U and V. In this case, t is a hyperparameter we can select and adjust to reflect the number of topics we want to find (Forsythe, Malcolm & Moler, 1977).
Finally, after decomposing the matrix, U matrix emerges as the document-topic matrix, and V becomes the term-topic matrix. For both cases, the columns correspond to one of the t topics. In U, rows represent document vectors expressed in terms of topics; in V, rows represent term vectors expressed in terms of topics.
The disadvantage of using this method is that there is not a way to identify the topic. There is absolutely lack of interpretability because one cannot know what the topics are, and the components may be
arbitrarily positive or negative. There is also a need for really large set of documents and vocabulary to get accurate results and, finally, it is less efficient representation.
2.1.2. Probabilistic Latent Semantic Analysis
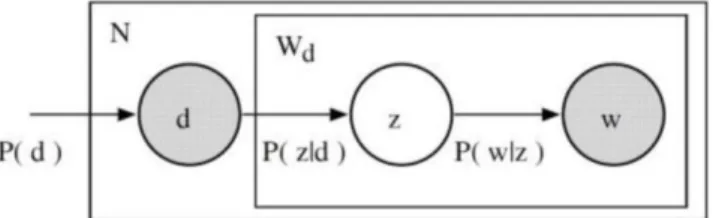
The model of PLSA is an aspect model of latent variables, whose underlying mechanism differs considerably from the purely algebraic nature of LSA. In fact, PLSA differs from LSA because PLSA uses a probabilistic method instead of SVD to extract the document-topic matrix and the topic-word matrix (Kuta & Kitowski, 2014). The final idea is to find a probabilistic model which latent topics can generate our document-term matrix. The way it works is basically:
- given a document d, topic z is present in that document with probability P(z|d) - given a topic z, word w is drawn from z with probability P(w|z)
Where the probability graph is:
Figure 2: Probability graph for PLSA
In figure 2, N is the corpus of documents, d is the document, z is the topic and w is the word from the document. PLSA is adding the probability concept to the basic assumption of topic models: each document consists of a mixture of topics, and each topic consists of a collection of words (Hofmann, 1999).
Intuitively, the graph is explaining how likely is to see some document, and then based upon the distribution of topics of that document, how likely it is to find a certain word within that document. The PLSA uses the Expectation-Maximisation (EM) algorithm to train the model which calculates P(Z|D) and P(W|Z) (Hofmann, 1999). EM is a method of finding the likeliest parameter estimates for a model which depends on unobserved, latent variables. Basically, Expectation and Maximisation steps are executed until convergence of computed values is achieved or required number of iterations is done (Dempster, Laird & Rubin,1977).
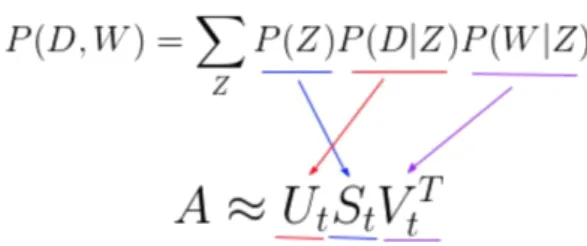
One could find a similarity between LSA and PLSA by comparing the decomposition of the corpus in both methodologies.
Figure 3: Similarity between LSA and PLSA
In the figure 3, the first formula refers to PLSA methodology of joined probabilities. In the bottom is the SVD methodology to decompose the Document-Term matrix of the LSA. Thus, the probability of our topic P(Z) corresponds to the diagonal matrix of our singular topic probabilities, the probability of our document given the topic P(D|Z) corresponds to our document-topic matrix U, and the probability of our word given the topic P(W|Z) corresponds to our term-topic matrix V.
In conclusion, although it includes probabilistic treatment and approaches the problem in a very different way, it still has some drawbacks. First, it has no parameters to model P(D), consequently, the model doesn’t know how to assign probabilities to new documents, and finally, the number of parameters for PLSA grows linearly with the number of documents, so it is prone to overfitting.
2.1.3. Latent Dirichlet Allocation
LDA is a mathematical method for estimating both of these at the same time: finding the mixture of words that are associated with each topic, while also determining the mixture of topics that describe each document. The difference between LDA and PLSA is that LDA has a probabilistic generative process based on a Dirichlet distribution. The Dirichlet distribution is a probability distribution over a set of probability distributions. It basically means that each document in the collection is associated with a multinomial distribution over T topics and each topic is associated with a multinomial distribution over words. Both θ and φ have Dirichlet prior with hyperparameters α and β respectively. (Remmits, 2017). For each word in one document d, a topic z is sampled from the multinomial distribution θ associated with the document, and a word w from the multinomial distribution φ associated with topic z is sampled consequently. This generative process is repeated Nd times where Nd is the total number of words in the document d (Hong & Davison, 2010).
More intuitively, assume that K topics are associated with a collection and that each document exhibits these topics with different proportions. This is often a natural assumption to make because documents in a corpus tend to be heterogeneous, combining a subset of main ideas or themes that permeate the collection as a whole (Blei, 2009, p. 3).
The model assumes that the topics are generated first. After that, for each document in the collection, that in the case of Talkdesk each document is a call, will be generated the words in a three-steps process (Blei, 2009, p. 4).
1. Randomly assign each word in each document to one of the K topics
2. For each word in document d
i. Assume that all topic assignments except for the current ones are correct. ii. Calculate two proportions:
1. The proportion of words in document d that are currently assigned to the topic 2. The proportion of assignments of topic t over all documents that come from this word iii. Multiply those two proportion and assign to each word a new topic based on that
probability
3. Eventually, it will reach a steady state where assignments make sense The result of the model can be divided into two different sections:
Word-Topic probabilities provide the value per-topic-per-word probabilities, called β ("beta").
Basically, it comes in a table with three columns: Topic, Word and β. Furthermore, besides estimating each topic as a mixture of words, LDA also models each document as mixture of topics. The per-document-per-topic probabilities are the output of the Document-Topic probabilities. It contains three columns: Document, Topic, and γ (gamma). Gamma is an estimated proportion of words from that document that are generated from that topic. It could be interpreted then as the proportion of the topic in that document (Blei, 2009, p. 6). Finally, LDA makes some important assumptions. It assumes that the order of the words in the document does not matter. These assumptions together are called the exchangeability assumption. The only thing that LDA assumes is whether or not a word is present in a document and with what frequency. Thus, LDA aims to capture semantics and not syntax. The last assumption of LDA is that the number of topics is known a priori (Remmits, 2017). After analyzing three different algorithms for topic modeling, the data science area decided to work with LDA since the implementation of the algorithm is very easy to do and the conclusions of the papers shown in the Related work section shows that it is used in the industry with accurate results. 3. Related work
So far, there are not studies on how call center companies do topic modeling, for this reason, the following papers expose how LDA works in different industries like law, social network and medicine. Although none of these industries is similar to the contact-center area, the conclusions of the algorithm when applied on large corpus of documents can be very similar to the Call Center area. 3.1. The Case Law Analytics
In this paper, the author refers to how the Dutch courts need to deal with large amount of information due to almost 2 million court cases handled per year. The objective of the author is to analyze the court decision documents publicly available faster and efficiently than traditional methods. Furthermore, the author to check if LDA can find accurate and useful topics and whether or not legal experts and people with a non-legal background agree in their judgments about it
The first step the author did was to get the data from the public repositories. Secondly, he did data processing which involved: apply tokenization to get the document-term matrix, apply Stemming and Lemmatization (explained in the following sections) and remove stop words. The next step was to train the LDA and check the result of the topics. So, based on the Chang et al. methodology to calculate the quality of the topics (Chang et al, 2009), the author constructed a matrix with the best and worst topics of the model. For the purpose of this document, it is only going to be shown in the figure 4 the best topics:
Figure 4: Best topics with label
The previous figure shows the top 5 topics that were labeled by a group of lawyers with its respective extracted words by the LDA. It is clear that the results are very intuitive, and the words are very helpful to label easily the topic.
For its final considerations, the author concluded, that if the goal of the project was to use these topics to label clusters or nodes in a network, the topics should firstly be summarized into a single label per topic. This is not easy for the majority of the topics found. Secondly for the labels to be useful, all or at least most relevant legal themes should be expressed in the topics. That is not the case because legal experts judged the main theme to be missing from the top three topics for the majority of documents. However, if the goal was to use the topics as a measure of semantic relatedness of pieces of case law or for corpus exploration, this might very well be possible with the found results (Remmits, 2017).
3.2. Topic Modeling in Twitter
The author talks about how social networks have become a crucial source of information. Furthermore, that studying the characteristics of content in the messages becomes important for a number of tasks, such as breaking news detection, personalized message recommendation, friends recommendation, sentiment analysis and others.
The author considered two different methods to extract the topics of the twitter messages: LDA and Author-topic model. Besides that, he created three different methods to calculate the topic mixture for “new documents” and users. Then, it was collected 50.000 of Twitter messages from 274 verified users. Those users belong to 16 different categories like Books, Business, Sports or Science. The idea to extract these exact categories was to evaluate with a cross-validation scheme the quality of the topic models.
However, in opposition to what is recommended in other NLP models, the author did not perform any stemming or stop words removal on the corpus.
In the conclusions, the author says that it was conducted extensive qualitative and quantitative experiments on three proposed schemes based on standard LDA. In the experiments they demonstrated that topic models learned from aggregated messages by the same user may lead to superior performance in classification problems and topic model features can improve performance in general, especially when the research targets are messages (Hong & Davison, 2010).
3.3. Bioinformatics and topic modeling
The classification and taxonomic identification of genomic sequences have an important role in the biomedical field. The authors focused in this paper to give a new method for DNA sequences clustering and classification. The method is based on k-mers representation and LDA.
Although topic models have been developed for text mining activities, the authors created a parallelism between text documents and gene sequences. A single DNA sequence represents a document. A dataset of sequences can then be considered as the corpus of the documents. On the other hand, a DNA sequence is composed by only one text string, defined on a fixed alphabet (A, C, G, T). For each sequence in the string, all the words, k-mers for the case of a DNA sequence, can be extracted with a sliding window of fixed length k. For the case of this paper k is 8.
Then, it will be applied LDA over the corpus and extracted the topics that categorize each sequence of DNA. Although a document is a combination of topics, the authors decided to assign to each sequence just the topic with higher probability. The most probable topics are labeled with a taxonomic rank using a majority voting scheme.
The authors decided to work with 7.856 DNA sequences belonging to the richest phylum: Actinobacteria, Bacteroidetes, Firmicutes and Proteobacteria. Thanks to that classification, they could test the results of the topic model. Thus, the pipeline of the process was: Extract the Dataset, process the data with the k-mers method, split it in training and testing, train the LDA model, label the topic with taxonomic rank, assign to each sequence the most probable topic, run the posterior on the test data, assign to each sequence of the test dataset the most probable topic, compare with the known phylum.
In order to apply a more generic test to the model, the authors decided to test not only with an entire DNA sequence but with chunks of an entire one sequence. It means that, for example, if they had a DNA sequence with a length 1200 characters, they will subset the string in 400, 200, 100, 50, 40 and 25 characters, to check if the model could still predict which class the DNA sequence was.
The results of the model are very good. With the whole string, the accuracy was higher than 90%, and the decrease was not significant when reducing the DNA sequence length. Actually, when comparing this method with different methods used in the field, it does not perform better when using all the string. However, when using ultra short sequences, it outperforms the other techniques.
Testing with short sequences is important because, noisy sequences for example are very common to obtain in case of environmental species. The study of several fragments of the same input sequence can allow the authors to understand which part of the original sequence carries the most informative content (La Rosa et al.,2015).
4. Methodology 4.1. What is Talkdesk?
Talkdesk is a cloud-based contact center software provider. A contact center is a central point from which all customer contacts are managed. One example of a Contact Center is a Call Center.
The mission of Talkdesk, extracted from its website is: "Empower companies to continuously improve customer experience. With enterprise-class performance and consumer-like experience, Talkdesk allows you to adapt your contact center to the evolving needs of your customers and teams, resulting in increased productivity, customer satisfaction, and cost savings."
As Talkdesk mission declares, improve customer experience is the main objective behind all the product development. All areas in the company are focused on improving the product in order to allow our users to increase their customer experience.
In order to understand how a Data Scientist Project can impact positively customer experience in call centers, let’s understand what a call center is.
4.2. What is a call center?
Based on Talkdesk’s definition, a call center is a centralized department to which phone calls from current and potential customers are directed. Call centers can handle inbound and/or outbound calls, and be located either within a company or outsourced to another company that specializes in handling calls.
In a Call Center, the most common roles we can have are the agent, the supervisor and the admin. The agent is the one behind the phone. When someone calls to a call center the agent is the one who answers the call and deals with the questions and claims of the callers. Into this role there are several different profiles, it all depends on the company, the industry and the purpose of the call center. Some of the roles are sales, support, claims, and retention.
A Supervisor manages all employees of their department and is responsible for the performance of those employees (e.g., service level, sales quota). Other names for Supervisors could be Operations Manager, Sales Manager, or Team Lead.
Typical job functions
● Review operational KPIs in real time to monitor the customer experience and overall performance 22
● Make decisions on positive and negative performance trends to ensure attainment of performance targets (e.g., service level)
● Identify strategies and tactics to improve overall performance, including changes in work schedules or standardization of workflows
● Make necessary staffing changes based on shifts in call volume, temporary events, and historical operational data (manual or via WFM tool)
● Track productivity and schedule adherence of agents
● Monitor calls to observe employee demeanor, technical accuracy, and conformity to policy ● Provide coaching for new agents or agents that are not meeting performance expectations
● Provide training as needed to keep agents informed on products, procedures, customer needs, etc. ● Handle calls that have been escalated due to complexity or customer dissatisfaction
● Prepare reports on operational performance to executive management
Finally, An Admin is responsible for configuring and managing products for their account. There are different type of Admins, based on what their role in the organization is:
● Account Admin: Responsible for configuring the contact center solution for the entire account, and defining account-wide settings such as data security, SSO, and integrations.
● Team Admin: Responsible for configuring the contact center solution for a specific team, aka a subset of numbers and users
● IT Admin: Like an Account Admin, however not the actual decision maker (e.g., does not define business hours for call center, but configures the appropriate business hours in the contact center solution based on input from the owner)
Typical job functions
● Evaluate new solutions and/or tools for compatibility with existing technology infrastructure and/or workflows
● Configure products and manage updates to the configuration (e.g., enable new features or redefine settings)
● Optimize product configuration to meet business objectives (e.g., communicate new features/enhancements, propose new settings definition based on feedback from business stakeholders)
● Create and manage users
4.3. What are the challenges for the call centers?
As it was explained, Supervisors need to keep track of the performance of the agents. In fact, supervisors follow some KPIs to accomplish with this objective. The most important KPIs that can be listed are Waiting Queue Time, Call Duration and CSAT score
The waiting queue time is the time that a customer has to wait when he is calling to a call center. Usually, the highest waiting time, the worst the service is. The idea is to reduce the waiting queue time to improve the customer experience. The principal factors that affect the waiting queue time are the time of the day, the average call duration of the call center and unexpected issues like service problems.
Equally important, the Call Duration affects not only the waiting queue time but also the costs of the call center. The call center at the end of the month is charged by each second using the service. Thus,
for supervisors, this KPI is critical. They need to ensure that the agents can solve efficiently the problems, and that means having a great service in the minimum time possible. On the other hand, call duration can be affected for some factors like the topic of the call or efficiency of the agent. Finally, the CSAT score is a score created by Talkdesk which final objective is to measure how satisfied was the caller with the service. With this metric, call centers can follow who are the best agents in terms of customer satisfaction.
Talkdesk mission is to empower the call centers supervisors with the required tools to improve every KPI and help them to take advantage of the large information that is stored from each call. Besides that, Talkdesk is committed to assist the most possible the agents and help them to focus on solving the problem instead of dealing with a platform.
In order to achieve that mission, it is necessary to understand the process of the call and how it impacts the mentioned KPIs.
4.4. How do calls work in a call center?
There is two type of calls in a call center: Inbound Calls and Outbound Calls. Inbound calls are the ones that are made from customers to call centers. A call that comes in from an outside source. Typically, a potential lead or a current customer is calling for a specific purpose. Perhaps they have a question about a product or service you offer, maybe someone recommended they call your company to resolve a specific problem, or they may just want to know the status of his or her project.
An outbound call is the opposite of an inbound one. The salesperson reaches out over the phone to a potential lead. It may be a cold call, or they may be following up with a lead who expressed interest on a product. Usually, there are two different call centers, each one for each type of calls. The agents of each call center need to have different capabilities. There should be a salesperson in the outbound meanwhile in the inbound there should be support people.
As the mission of Talkdesk is focused in KPIs like waiting time, CSAT score and talking time, and this KPIs are specially related with inbound calls, the process of the call that is going to be explained is the inbound call.
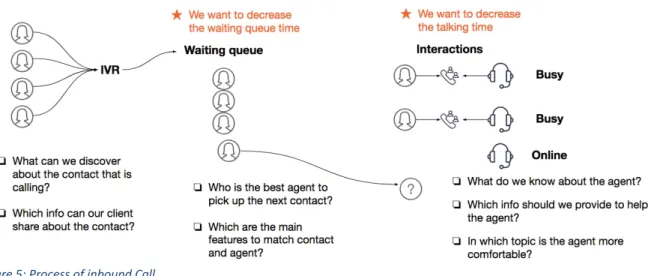
Figure 5: Process of inbound Call
When a call is made to a call center it creates a process which is called Routing. This process is basically the way we connect the caller with the right agent. For some call centers, when a call is received, it could be answered by an IVR or answered directly by an agent. The IVR is a pre-recorded message that drives the caller through some options that lead to a different group of agents. For example, a customer call to the company A to make a claim. When the IVR answer the call, it gives 3 options: dial 1 for sales, dial 2 for support and dial 3 for claims. After dialing the number that the customer wants, the call will be directed immediately to a group of agents specialized in the topic. The final objective of the IVR is to decrease the time that is wasted in transfer calls between the different group of agents.
After reaching the specific group, the call will be answered by the agent. However, if the agents that belong to the group are not available, the caller would have to hold in the line until an available agent exists. This event starts the counter for Waiting Queue Time that is having in count as a KPI. It also can happen that there is more than one person holding in the line. Then, the caller will be part of a queue where the first one that called will be the first one in the queue.
Finally, when reaching an agent, the new event will create a new counter for Talking Time. It is in this part of the process when the agent has to solve the call in the most efficient way. It means that he has to be fast, to decrease costs and decrease the waiting queue time, and he has to be very effective, to improve customer satisfaction.
Talkdesk provides a platform which helps the most possible the agent. This platform includes a very easy user interface solution and some information related to the person that is calling. This information will be available only if the caller is a customer and the number he is using is the one associated with the databases of the company.
Lastly, the call is finished and the caller has the option to answer a quality service survey which is the one that feeds the CSAT score.
4.5. What are the challenges when routing a call?
After discussing the factors involved in the call that can affect the KPIs, it can be concluded that the main challenge for routing is matching the best agent for each call. Finding a proper way to do it, could lead to decrease the Average Talking Time and with that decrease the Waiting Queue Time. There can be defined some questions that can lead the project to understand how to improve this process.
Some example of questions that can be made are: What can be discovered about the contact that is calling? Which info can the call center share about the contact? Who is the best agent to pick up the next contact?
Which are the main features to match contacts with agents? What is known about the agent?
Which info should be provided to help the agent? In which topic is the agent more comfortable?
Here is where the Data Science Team of Talkdesk starts to be creative and design possible solutions to the previous questions.
The Talking Time affects directly the Waiting Time and the CSAT score, so the solution will be focused on decreasing the Talking Time. The Talking Time can also be defined as the conversation, which is the signature of the call center. So, we can start focusing on how the conversation has been made. How did agents talk with contacts? Are the following the script and providing the best support? How did the contact describe the problem? Was the contact picked by the right agent? Was the contact answered? The previous questions are directly related to the topic of the call.
If it is clear for the call center to know what the main topics for the calls are, they could define a better IVR routing option. If it is clear for the call center to know what is the profile of the callers for specific topics, they could anticipate to the call and then route it to the best agents for this specific topic. If it is clear for the call center to know what the times of the day are when some topic-specific calls are made, they could anticipate to this hours and prepare the call center for this specific cases. The previous questions are just a couple of examples of what can be answered if the topic of the call was provided to the supervisors. Consequently, the topic recognition of the call is defined as a priority model for Talkdesk.
4.6. Automated Implementation in Talkdesk
As it was explained in the literature review section, the algorithm chosen by the Data Science area was LDA. This section explains how Talkdesk is implementing this algorithm from the collection of the audio to the labeling of the topics.
With the help of the Data Science Team in Talkdesk, it was defined as the next pipeline for the implementation of the Topic Analysis. The purpose of the pipeline is to define the topic extraction prototype, from obtaining the voice record to extract the topics associated with the voice.
As the purpose of this report is to explain how is used the LDA model in Talkdesk, the data that will be used is the Talkdesk Support Call Center Calls. Due to Privacy Policy for Data Protection, the results are not going to contain anything from Talkdesk customers.
4.6.1. Call Data Collector
The objective of this step is to collect the attributes that the team considers important to analyze the topics of the calls. Attributes related to the call, the caller and the agent can be useful in a future analysis.
The main fields needed for explorations are:
● account_id: Account of the company owner of the call center. ● interaction_id: The id of the interaction or call.
● user_id: id of the agent who answers the call.
● ring_groups: Group of the company which the agent belongs to. ● IVR: Dialed IVR by the caller in the interaction.
● CSAT: Score of satisfaction from 1 to 10
● Talkdesk phone number: phone number of Talkdesk which was dialed by the caller.
For future implementations, it is important to define a frequency for collecting the calls. For example, if the step runs daily it will collect all finished calls from the day before for the accounts in the account list.
4.6.2. Recording Collector
With the relevant call data collected, this step is responsible for getting the call recordings through recordings-API and stored the mp3 file in the database with a retention policy of 10 days. The reason for the policy is that the recordings are a sensitive data for GDPR and the prototype cannot keep these data forever, only to give time to obtain the transcription with some time to solve problems if needed.
4.6.3. Audio Processing
In order to extract the topics from the call, we need to transcript the audio with Google Speech API. However, this API only deals with mono audio files, so there is a need to have an audio processing step to prepare the recording file to be submitted to the transcript API. The processed file will be stored in the same bucket of the recordings to be under the same retention policy.
Other audio pre-processing methods can be evaluated to reduce noise and improve audio quality to consequently improve the transcription.
4.6.4. Transcription
Until now it was used the Google Speech API to obtain calls transcriptions. However, Google API charges a number of dollars for each audio that was transcripted, so, with the purpose of keeping the exercise
as a test, it was transcripted just a sample of the database. Firstly, it was used the inbound calls of October 2017. Then, it was extracted 412 from 6500 calls (6,2%) and transcripted through Google API. For the future implementation of this step, it should be agnostic to the API where the input should be a recording file and the output be the conversation text, so if it's decided to change the API, the pipeline doesn't need to be changed. One idea is merging the Audio Processing step into this one, so the needs for pre-processing will be closer to the API used. At the same time having the conversation text as output will allow this step to build the conversation depending on the API response (the raw API output can be stored to be reprocessed if needed).
A problem to be solved in this step is to parallelize the process since each transcription takes at least the call duration time to be processed. So, sequentially transcript the calls take a long time and will delay the whole pipeline.
4.6.5. Anonymization
As the transcript is as sensitive as the recording itself, this data will be processed by an anonymization step to enable long-term storage. The main idea is to replace sensitive data like e-mails or names with tags indicating the nature of the data like #EMAIL or #NAME. Or hide part of the information with some marker like phone numbers where the last 4 digits can be replaced with an asterisk.
Part of Talkdesk mission is to keep on doing the good practices and new laws that can affect the process of the business. That’s why, after the General Data Protection Regulation (GDPR) was emitted by the European Union, the practices and process done by Talkdesk were adjusted to follow the new requirements of the law. Consequently, every data Talkdesk possess and every process is done with this data, is shared with the customers and approved by them.
4.6.6. Text Preprocessing
After anonymizing, each transcription should be preprocessed before extracting the topics. This preprocessing can be listed as a step by step process consisting of the following tasks: lowercasing, stemming, lemmatization, stopwords, numbers filtering, tokenizing and document-term matrix. Lowercasing: Basically, in a document, one can have different cases for the letters. If it is not specified, an algorithm will say that "Hello" and "hello" are different. Thus, in order to let the machine know that both are the same, it is necessary to lowercase the text. After applying lowercase, the "Hello" word would become "hello" and then the algorithm will be able to deal with that word as it is expected in this algorithm.
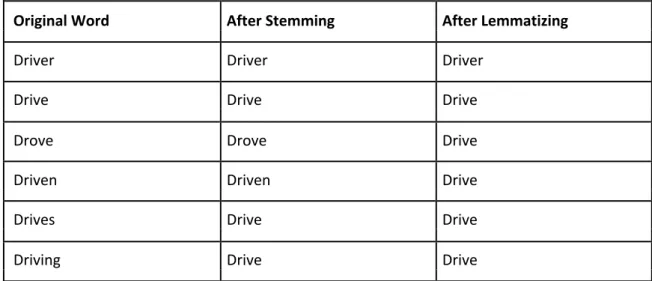
Stemming and lemmatization: English grammar allows the vocabulary to be very broad. In the same conversation, despite the meaning, it is used different forms of a word, such as play, played, plays, and playing. Additionally, there are families of derivationally related words with similar meanings, such as democracy, democratic, and democratization. The goal of both stemming and lemmatization is to reduce inflectional forms and sometimes derivationally related forms of a word to a common base form
Nonetheless, both words differ in the method. Stemming usually refers to a crude heuristic process that chops off the ends of words in the hope of achieving this goal correctly most of the time, and often includes the removal of derivational affixes. Lemmatization usually refers to doing things properly with
the use of a vocabulary and morphological analysis of words, normally aiming to remove inflectional endings only and to return the base or dictionary form of a word, which is known as the lemma (Schofield and Mimno, 2016, p.287).
An example of what could be the result for the case of “Drive”
Original Word After Stemming After Lemmatizing
Driver Driver Driver
Drive Drive Drive
Drove Drove Drive
Driven Driven Drive
Drives Drive Drive
Driving Drive Drive
Table 1: Driver stemming and lemmatizing comparison For the case of “Be”
Original Word After Stemming After Lemmatizing
are ar be
am am be
being be be
been been be
be be be
Table 2: Be Stemming and Lemmatizing comparison
Although this step is important and wide used for some natural language processing models, there is some important consideration one should keep in mind when applying it for LDA.
Schofield and Mimno did a work on comparing the results of some LDA models with Stemming. Their main conclusion was that "despite its abiding popularity, stemming does not improve coherence after controlling for the size of vocabulary, and may actually reduce the predictive likelihood and increase sensitivity to random initializations". LDA was already grouping together words with a common root. On the other hand, strong stemmer work worst than lighter stemmers. Krovetz method does a good job particularly for well-proofread corpora, however, the change is that small that even without stemming, an LDA model is capturing this target. (Schofield and Mimno, 2016, p. 294)
In conclusion, the team decided not to go with stemming or lemmatizing because it was not going to improve in a significant level the results of the model.
Stopwords: Some common words which appear to be of little value in helping to identify topics, select documents matching user need or express sentiments, are known as stop words. An example of a set of stop words could be: a, an, and, is, it, the, that, and in. The assumption behind stopword removal is that, with stopwords present, the model will not be able to learn as high-quality a language model. LDA may sometimes partially accommodate separating out stopwords without explicitly removing them. Schofield, Magnusson, and Mimno, in a different paper, managed to compare different models by applying stopwords removal. Their conclusions say that removing the very frequent stopwords has a benefit in LDA training. However, creating a stoplist based on some frequent terms of the corpus does not a substantial effect on model likelihood, topic coherence or classification accuracy. For the purpose of this report, the stopwords that will be removed are the ones that make part of the very frequent stopwords terms list (Schofield, A., Magnusson, M., & Mimno, D., 2017).
Numbers filtering: Part of the calls that the support team in Talkdesk has to solve are related to settings and features of the accounts. In those calls, some settings imply talking about a number of accounts, phone numbers or number of occurrences. The purpose of this work is not to evaluate topics containing numbers, thus, the team decided to apply numbers removal.
Tokenizing: Usually, in NLP methods, it is very common to use tokenization to the documents in order to have a structured form of the data and being able to analyze it. So, given a character sequence and a defined document unit, tokenization is the task of chopping it up into pieces, called tokens, perhaps at the same time throwing away certain characters, such as punctuation. There are some easy methods in R to do it (Cambridge University Press, 2008).
In tokenization, one important parameter that will affect directly the results of the LDA is the n-gram size. The n-gram size basically refers to how many words are going to be tokenized per line. As an example, let's suppose one document contains: "Hello, How are you?". In the case of a unigram tokenization, the result list would be: (‘hello','how','are','you'). On the other hand, in a bigram tokenization, the result would be (‘hello how','how are','are you'). The bigram approach is very useful because in some cases it can understand concepts that usually come in two words. For example, "credit card" can be understood as a concept that comes in two words. For the case of the unigram, it would be very difficult to get this concept from. In the results section, it is going to be shown a comparison between the unigram and bigram model.
Document Term Matrix: In order to implement the LDA model from R, it is necessary to create a DocumentTermMatrix, a special kind of matrix where the rows correspond to documents (calls in this case) and columns correspond to terms (i.e., words); it is a sparse matrix and the values are word counts. This structure of data is not only used for LDA models, but it is also very useful for other well-known NLP algorithms. Having the data of the documents structured in this matrix, it is easier to identify topics or improve the search results from a Latent Semantic Analysis (LSA)
4.6.7. Topic Extraction
To implement the previous model, Talkdesk decided to use the package for R called tidytext. The authors of the package (Silge, Julia, and David Robinson, 2017) were moved because they worked with
many methods for data wrangling and visualization, but couldn’t easily apply these same methods to text. Then, they found that by using tidy data principles many text mining tasks could get easier, more effective, and consistent with tools already in wide use.
As it was previously explained, there are three main parameters when talking about Topic Extraction: a number of documents (transcriptions), the number of topics (K) and n-gram size (set in the tokenization step).
The set of calls can be found by setting a time window in the calls historical, for example, use all calls from the last 7 days, for the case of this report, as it was already explained, it is going to be used a sample of the calls from October 2017.
The number of topics is a parameter that can involve different approaches. It can be defined from a business perspective. If the purpose of the Topic Modeling is to show the customers the main topics of the calls, it would not be efficient to show too many topics. On the other hand, having a model with a few topics can impact the importance of some words in the topics and consequently, important topics can be missed. Alternatively, other option to define the number of topics is doing it automatically with the package of LDAtuning for R. This package provides a way to calculate four different metrics that give the most preferable number of topics. The package can also plot the metrics where, by visualevaluation, the most suitable number of topics can be chosen. As the project has not been finished yet in the area, it is not clear how the automatic method is going to complement the business perspective approach. However, in order to make a comparison between the models with a pure business perspective against the automatic method, both models will be run in this report.
4.6.8. Topic Labeling
There are two approaches to label the topics: manually or automatically. The manual approach requires user intervention and in the future, the system could learn from the given labels and recommend them. The automatic has the approach to provide some label to the topics based on the word within and some external data source. So far, the area has just explored the manual approach. It is clear that this approach is not generalizable and that in the near future a must to have is an automatic way to define the names of the topics. However, another approach studied by the area is to give to the users the topics with the most important words and let them label the topic based on their business knowledge. In the examples of the results section of this report, it is going to be shown why it is necessary to have a well business understanding to label the topics.
4.6.9. Assigning topics to calls
The LDA process defines that each document is a set of topics in different proportions. Each topic is extracted from a corpus of documents, so at the end, all calls have a little proportion of all documents. So, for the case of a call, each call is a conversation with a set of all topics extracted from the corpus. It cannot be said that a call directed to sales is related to the support topic, though. Thus, it is necessary to define a threshold of the minimum percentage value that a related topic should have for a call. Furthermore, in the case a call has more than two important topics, it could be defined a new category of calls as the multi-topic call.
4.7. Results
The objective of this chapter is to show the results of the implementation from the Topic extraction section of the previous pipeline to the Assign Topics to calls.
4.7.1. Exploratory Data Analysis (EDA)
Before applying the LDA model on the transcriptions, let's take a look at the dataset and apply some basic stats on the transcription. The main EDA made on unstructured data as documents are words count. With the word count analysis, it is easy to see what are the most used words in the calls of Talkdesk's support call center.
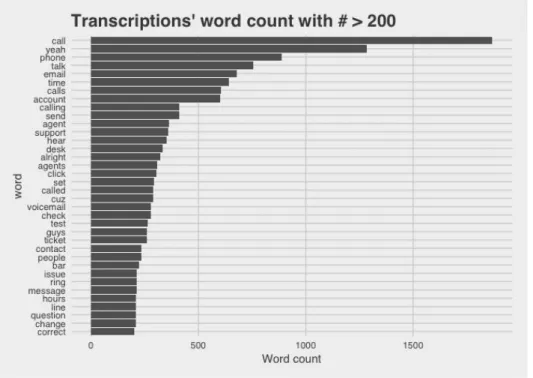
Figure 6: Words with more than 200 occurrences
The previous word count figure is already giving us very useful information. The most common words spoken in the calls of Talkdesk Support Call Center are highly related with the functions of the agents. For example phone, email, account are words related to the configurations and settings of the accounts of the users. Hear test, and issue, are words related to the common problems that Talkdesk's customers experience.
Another important information we can extract from this word count is that there are still some words that should not be taken into account to extract topics. After removing the stopwords mentioned in the text preprocessing section, the figure 4 shows that the transcriptions contain a lot of oral speech words like "yeah" and "cuz". Thus, in the stopwords step it will be added the next words to remove:
Figure 7: Oral speech words
As it was explained in the pipeline section, topic modeling considers one important parameter that is called n-gram. Before considering doing the LDA, one could do the same word count exercise but with a bigram tokenization. Let's apply the word count to the bigrams of the transcription and analyze if there is some useful information that can be extracted from that data.
Figure 8: Bigrams with more than 20 occurrences
The first insight that the area got from this bigram count is that the transcription service should be configured to receive some important business words that should be considered as unigram and no bigrams. For example, callbar is a product from the company, it should be considered a unigram, however, it is the first bigram in the frequency figure. Another interesting example is Talkdesk. As the transcription service that is used is not created by the company, some business words are not trained in the transcription model, so, when someone says Talkdesk, the algorithm just understand "talk desk".
in the worst cases, "talk test", "talk text", "top desk". From this insight, the area concluded that those words should be omitted and for future improvements, the transcription API should include a dictionary option.
On the other hand, the figure gives very useful information about the most talked issues in the call center's calls. For example, although it was supposed to be a unigram, "Call Bar" is a very important product of Talkdesk that customers are not very used to configure. That is why the first bigram is talked in the calls. Furthermore, "Business Hours" is another very important concept in Talkdesk. Some call centers that use Talkdesk's solution do not work the entire day, so they configured business hours to send specific messages or voicemails options to their customers. Based on this figure, customers are calling often to talk about business hours. It is maybe not clear how to set the configuration of this parameter. Finally, "Waiting Time" is one of the most important metrics for call centers. It indicates the amount of time a contact has to wait before his call is answered by an agent. On the Talkdesk's platform customers can see a dashboard with this metric. The fact that this bigram is in the top 10 most spoken bigrams means that customers are very interested in this metric.
4.7.2. LDA topics
After analyzing the results of the previous explorations, the area concluded that for the sake of this first experiment, the first LDA experiment will be executed with the following parameters: n-grams = 1 and number of topics = 10. For the next experiment, the number of topics will be changed for the optimal number of topics.
It is important to clarify that the number of the topic is related to how frequent the topic is. So, the topic 1 would be the most frequent and the topic 2 the least. The analysis will include the labeling of the topics
4.7.2.1. Topic 1 - Billing questions (adding licenses)
Figure 9: Topic 1 - words probability
The first topic is composed of words related to one specific issue of the company: billing questions (adding licenses) for Salesforce users. This is an important case for Talkdesk because nowadays when a customer wants to connect Talkdesk's Platform with their own CRM platform, for the cases of Salesforce users, they cannot create users by themselves, so they call to Talkdesk to solve this problem.
It is important to notice as well that one of the top 10 words is “building”, it is clearly a mistake from the transcription API when trying to transcribe “billing”.
4.7.2.2. Topic 2 - Integration
Figure 10: Topic 2 - words probability
This topic reflects another important process that customers need to do when they buy Talkdesk's services. The integration between their CRM and Talkdesk's platform is the core for the customer experience. Sometimes, depending on the CRM tool that the customer has, the integration could be difficult and very likely to fail.
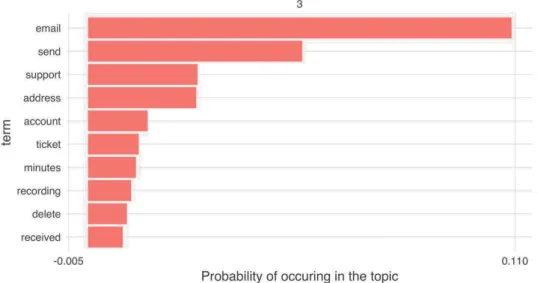
4.7.2.3. Topic 3 - Update on some ticket
Figure 11: Topic 3 - words probability
Another important issue that happens to Talkdesk's customers is related with the creation of the tickets in different CRMs. Talkdesk is integrated with the CRM, thus, each ticket is related with one or more interactions. For the agents is very important to keep track of the tickets to know if any of the cases were solved or not.
4.7.2.4. Topic 4 - the Generic question "What happened in this call/these calls?"
Figure 12: Topic 4 - words probability
This topic tends to be more generic for open questions. “What happened in this call/these calls?”. However, it is not completely clear if this topic is talking about other general questions.
4.7.2.5. Topic 5 - Callbar issues
Figure 13: Topic 5 - words probability
As it was previously explained, the Callbar is one of the main products in Talkdesk’s platform. It requires to have Google Chrome installed and in order to activate it, one should click in the top of the screen where the extension should be placed. This topic is clearly identified in the first 10 words. 4.7.2.6. Topic 6 - Setting IVR messages
Figure 14: Topic 7 - words probability
This topic is focused on the IVR messages. Customers use an important feature in Call centers configuration called IVR. It enables them to route smartly the calls to specific agents or group of agents. It is important to set a message in the IVR that let the contacts decide what group of agents they want to be contacted too. For example, sales, support or billing.
4.7.2.7. Topic 7 - Transfer support to sales and vice versa
Figure 15: Topic 7 - words probability
As it was explained in the previous topic, contacts call sometimes to specific agents like sales or support. This topic shows that sometimes, agents need to transfer the call to support or to sales and customers need to hold in line.
4.7.2.8. Topic 8 - Business hours
Figure 16: Topic 8 - words probability
The majority of the call centers have business hours to attend calls. It is very important to configure this business hour very fine, otherwise, if a contact calls to the call center, he would be waiting for someone to answer the call causing low customer experiences rates. Talkdesk's supervisors need to set this configuration very accurately and that is why this is another important topic.
4.7.2.9. Topic 9 - Hearing issues (testing it by checking headsets, network problems)
Figure 17: Topic 9 - words probability
Topic 9 contains words related to issues in the calls like hearing, microphone or network issues. This topic is important for the Support Call Center because it is much related to the performance of the service and some of the problems related here could be happening for more than one account. 4.7.2.10. Topic 10 - Phone numbers and agents related
Figure 18: Topic 10 - words probability
The last topic is one the model could be associated with phone numbers, agents and something and other important feature of Talkdesk's settings like "voicemail". As the number of topics chosen for this analysis was only 10, it could be that this topic is containing more subtopics that could be clearer if the number of topics was higher. In the following analysis, we are going to analyze what would happen if we change the number of topics for the optimal number of topics and what are the pros and cons of having it.
4.7.3. Assigning topics to calls
After labeling each topic, the next step is to find what the topic for each call is. As it was previously explained, LDA model has two different outputs: Word-Topic probabilities and Document-Topic
probabilities. The first one was used to find the label of each topic by analyzing the probability of each word to belong to each topic. On the other hand, the Document-topic probabilities show the probability of each topic to belong to each document. In this case, each document is a call.
It is theoretically defined that each document is composed of a set of topics in different percentages. Based on the previous sentence, each call has more than one topic associated. Some of them could have just on topic with high probability or many topics with similar probabilities. The intention of the Topic Recognition feature created by Talkdesk is to be very user-friendly. In that way, the objective of having calls with more than one topic could make difficult the task of grouping calls by topic or even tracking the most important topics by time. Consequently, for the first experiments, the topic assigned to each call would be the one with more probability in the Document-Topic probabilities matrix.
4.7.4. Evolution of topics through time.
One of the experiments that can be done after assigning a topic for each call, is to see how these topics behave through the time. It could give insights about seasonality for topics or anomalies in the service.
As the data that is being used is from the last year, there are some issues that happened at that time that are already known by the Talkdesk’s Support Call Center.
Figure 19: Most important topics through days
The previous image contains the main topic for each day from October 16 to October 27. One of the main insights that can be extracted from this image is that on October 18 there were problems with the service in Talkdesk's customers. There is a high peak of complaining about hearing issues.
Thanks to this type of analysis, adding a real-time component, not only Talkdesk's Support Call Center could manage to make more efficient decisions in the right moment, but also Talkdesk's Customer's
Call Centers. Having the dimension of Topic per Call can give an advantage to a Call Center supervisor on defining immediate action plans to mitigate or reverse bad situations.
Another kind of analysis that can be done is for example:
1. What are the days of the week with more calls related to a specific topic? It can be found for example that the call center should be prepared always on Thursdays because is the most probable day to happen a specific topic.
2. Who is the best agent for specific topics? The routing system could be configured to route calls to agents that are experts in those topics and, consequently, that could improve the performance metrics of the Call Center.
3. What are the topics that cause more dissatisfaction? Complementing this model with a sentiment analysis, some interesting insights could be extracted.
4.7.5. The optimal number of topics
Using the "ldatuning" package it's possible to run a grid search for the different number of topics and calculate four different metrics. The package can also plot the metrics where, by visual evaluation, the most suitable number of topics can be chosen. The "Griffiths2004" and "Deveaud2014" are maximization metrics, and "CaoJuan2009" and "Arun2010" are minimization. For the purpose of this report, it is only going to be analyzed the results of those metrics and how to interpret these results. The theoretical detail of each metric will not be explained.
Figure 20: Optimal number of topics comparison
The image shows the graphical results of the four different metrics. CaoJuan2009 and Arun2010 should be minimized, and Deveaud2014 and Griffiths2004 should be maximized. Graphically, the optimal number of topics should be 32.