Faculdade de Medicina de Ribeirão Preto Campus
Ribeirão Preto
Institutional Sponsors
The Brazilian Journal of Medical and Biological Research is partially financed by
Braz J Med Biol Res, December 2009, Volume 42(12) 1210-1217
Normal range values for thromboelastography in healthy adult
volunteers
S. Scarpelini, S.G. Rhind, B. Nascimento, H. Tien, P.N. Shek, H.T. Peng, H. Huang, R. Pinto,
V. Speers, M. Reis and S.B. Rizoli
ISSN 0100-879X
BIOMEDICAL SCIENCES
AND
CLINICAL INVESTIGATION
www.bjournal.com.br
www.bjournal.com.br
Normal range values for thromboelastography
in healthy adult volunteers
S. Scarpelini
1,3, S.G. Rhind
2, B. Nascimento
1, H. Tien
1,4,
P.N. Shek
2,
H.T. Peng
2, H. Huang
2, R. Pinto
1, V. Speers
1, M. Reis
1and S.B. Rizoli
11Sunnybrook Health Sciences Centre, University of Toronto, Toronto, Canada 2Defence Research and Development Canada, Toronto, Canada 3Departamento de Cirurgia, Faculdade de Medicina de Ribeirão Preto,
Universidade de São Paulo, Ribeirão Preto, SP, Brasil
4Canadian Forces Health Services, Canada
Abstract
Thromboelastography (TEG®) provides a functional evaluation of coagulation. It has characteristics of an ideal coagulation test
for trauma, but is not frequently used, partially due to lack of both standardized techniques and normal values. We determined normal values for our population, compared them to those of the manufacturer and evaluated the effect of gender, age, blood type, and ethnicity. The technique was standardized using citrated blood, kaolin and was performed on a Haemoscope 5000 device. Volunteers were interviewed and excluded if pregnant, on anticoagulants or having a bleeding disorder. The TEG®
parameters analyzed were R, K, α, MA, LY30, and coagulation index. All volunteers outside the manufacturer’s normal range
underwent extensive coagulation investigations. Reference ranges for 95% for 118 healthy volunteers were R: 3.8-9.8 min,
K: 0.7-3.4 min, α: 47.8-77.7 degrees, MA: 49.7-72.7 mm, LY30: -2.3-5.77%, coagulation index: -5.1-3.6. Most values were significantly different from those of the manufacturer, which would have diagnosed coagulopathy in 10 volunteers, for whom additional investigation revealed no disease (81% specificity). Healthy women were significantly more hypercoagulable than men. Aging was not associated with hypercoagulability and East Asian ethnicity was not associated with hypocoagulability. In our population, the manufacturer’s normal values for citrated blood-kaolin had a specificity of 81% and would incorrectly identify 8.5% of the healthy volunteers as coagulopathic. This study supports the manufacturer’s recommendation that each institution
should determine its own normal values before adopting TEG®, a procedure which may be impractical. Consideration should
be given to a multi-institutional study to establish wide standard values for TEG®.
Key words: Coagulation; Thromboelastography; Normal values
Introduction
Correspondence: S.B. Rizoli, Sunnybrook Health Sciences Centre, 2075 Bayview Avenue H1-71, Toronto, Ontario, M4N 3M5, Canada. Fax: +1-416-480-5499. E-mail: [email protected]
Received May 15, 2009. Accepted October 8, 2009. Available online November 3, 2009. Published December 4, 2009.
Thromboelastography (TEG®; Haemoscope, USA) is a
point-of-care global hemostasis system used by anesthetists largely to monitor perioperative changes in coagulation in surgical patients (1,2). By measuring the viscoelastic changes that occur during the hemostatic process, TEG®
provides a real-time functional evaluation of the coagula-tion cascade, beginning with initial platelet-fibrin interac-tion, through platelet aggregainterac-tion, clot strengthening and fibrin cross-linkage and eventually clot lysis (3). TEG® was
first described over 50 years ago but has been proven clinically useful for only the last 20 (1,4-9). TEG® has a
well-established role in cardiopulmonary bypass and liver surgery (10) and there is growing interest in expanding its clinical use outside the operating room, particularly for the management of trauma-induced coagulopathy (11,12). In
cardiac surgery and liver transplantation, TEG®-based
transfusion guidelines reduce the use of blood and blood products transfused by up to 50% and minimize inappropri-ate blood product use and overall costs (5,13).
In theory, TEG® has many of the properties of an ideal
Normal TEG® values in healthy volunteers 1211
www.bjournal.com.br Braz J Med Biol Res 42(12) 2009
There are several reasons why TEG® has not been ad-opted in mainstream clinical practice (14-16). One reason is its excessive dependence on manual procedures compared to other standard coagulation testing devices, a source of criticism by laboratory societies (8,17-23). The remarkable versatility of TEG® allows the same instrument to analyze fresh whole blood, citrated blood, platelet-poor plasma, or even platelet-rich plasma, using different initiators such as contact proteins or tissue factor. However, such versatility results in TEG® being done in many different ways, making
it difficult to establish standards and reference values for each different technique.
The manufacturer’s manual provides normal reference values for most but not all different techniques (9,17). For some techniques, the values in the accompanying software differ from the owners’ manual (24). The manual does not contain relevant information such as reproducibility, vari-ability and the effects of age, gender, and ethnic background (24,25). Scrutiny of the supporting evidence in the owner’s manual reveals that studies with small numbers of volun-teers or hospitalized patients were used to establish some of the normal values. In addressing the reference normal values, the manufacturer suggests that each new user test 20 healthy volunteers and generate his own normal values prior to clinical use (24). The consequence is that TEG®
currently lacks universal recognition as a reliable routine laboratory test (10,26).
Nevertheless, TEG® has become part of clinical practice
in cardiac and liver transplant where normal standard values are less relevant and the patient’s own baseline preoperative test result is the standard (10). Such a model, however, is not feasible for many other uses, particularly in trauma.
Therefore, in preparation for clinical studies on the role of TEG® in trauma, we deemed it necessary to establish normal
range values for our population. Considering the Clinical Laboratory Improvement Amendment (CLIA) requirement of a minimum of 30-40 subjects for special coagulation tests when determining in-house normal values (27), we decided to exceed this minimum by at least 3-fold. We planned to compare our results to those of the manufacturer and to evaluate the impact of gender, age, blood type, and ethnic background.
Material and Methods
The study was conducted at the Sunnybrook Health Sci-ences Centre and at Defence Research and Development Canada. The Research Ethics Board of both institutions approved the study. Informed writtenconsent was obtained from all participants that consisted of employees, residents and medical students from both institutions. A focused medi-cal history was taken from each volunteer, with emphasis on potential bleeding disorders, medical status and medications. We excluded pregnant women and subjects having any bleeding disorder, using anticoagulants or recovering from
any recent illness including common cold.
Four TEG® 5000 Hemostasis Analyzers (Haemoscope
Inc., USA) with 8 independent channels were used and connected to computers with the TEG® Analytical Software,
version 4.1.54. Maintenance and quality controls were performed daily in strict accordance with manufacturer recommendations.
Briefly, blood samples were collected by venipuncture using 20-gauge needles, into 1.8-mL Vacutainer® tubes
(Becton Dickinson, USA) with 3.2% sodium citrate (0.109 M trisodium citrate), and gently inverted six times. In accor-dance with manufacturer recommendation, samples were kept at room temperature for 40 min and gently inverted five times and 1 mL was transferred to a vial containing buffered stabilizers and Kaolin® (phospholipids). Kaolin® was chosen
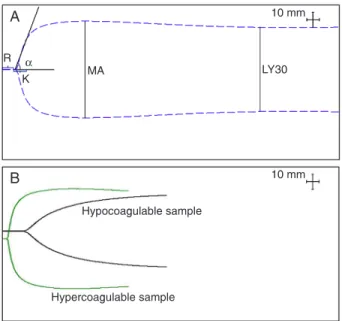
due to unavailability of tissue factor alone, which would more closely mimic in vivo coagulation. The sample was mixed by inversion five times, 340 μL was transferred to a 37°C pre-warmed disposable cup containing 20 μL calcium chloride and measurements were made for no less than 40 min. TEG® was performed by two operators (SS and HH). Normal values were determined using six parameters: R (time to initial fibrin formation), K (time to clot formation), α (alpha angle, rate of clot formation), MA (maximum amplitude, absolute clot strength), LY30 (fibrinolysis at 30 min after MA), and coagulation index, linear combination of 4 parameters: R, K, α, and MA (Figure 1) (10,28,29).
The reference normal value obtained for our healthy population was initially compared to that of the
manufac-Figure 1. Thromboelastography tracings. A, Normal TEG®; B,
ex-amples of hyper- and hypocoagulable tracings. R = time to initial
turer by checking how many of our subjects fell outside the manufacturer values. To attempt to estimate the clinical impact of using the manufacturer reference values in our population, the volunteers were categorized according to Kaufmann’s classification (4). Briefly, a hypercoagulable disorder was present if 2 or more of the following param-eters were observed: short R, short K, increased α and/or MA. A hypocoagulable disorder was diagnosed if 2 or more of the following parameters were observed: prolonged R, prolonged K, decreased α and/or MA. For those with 2 or more abnormal but mixed results, hyper- or hypocoagula-tion was determined by the predominant or most abnormal result. All others were classified as having a single or no abnormal parameter, and thus having no disease. The specificity of TEG® was also determined.
All those diagnosed as hyper- or hypocoagulable or with a single R or MA parameter abnormality according to the manufacturer’s values underwent additional coagulation tests done on the remaining blood samples. Tests included: prothrombin time - International Normalized Ratio (INR), normal range 0.9-1.1; activated partial thromboplastin time (aPTT), normal range 24-34 s or ≤1.5 times the daily standard and clotting factor activity assay. We decided to include 100 to 120 volunteers.
Statistical analysis
For normal ranges we used tolerance intervals and limits within which we expected a stated proportion of the
population to lie. The tolerance interval is characterized by two parameters: p%, the proportion of population that is desired to be within the limits, as well as γ%, the confidence that p% of the population is within these limits. Tolerance intervals were determined assuming normal distribution. Distribution-free alternative constructed tolerance intervals were based on the minimum and maximum in the sample, where the range of the data was used as reference range. Confidence level, γ%, for a fraction p% and a sample size
n is independent of the distribution of the data: γ = (1 - pn- n(1 -p)pn-1) x 100%. For n = 118 and p = 95%, γ = 98.3%.
We also used a one-tailed chi-square test to determine if the proportion of volunteers within the range specified by the TEG® software was <5%.
The association between gender, blood type, ethnicity, age, body mass, and TEG® values was evaluated using the t-test or analysis of variance (ANOVA) for normally dis -tributed values and the Mann-Whitney U-test for data with non-normal distribution. For continuous predictors, linear regression was used to determine the association with outcomes. All tests were two-tailed unless specified and the level of significance was set at P < 0.05 in all analyses.
Results
The characteristics of the 118 healthy volunteers are presented in Table 1 while the TEG® reference ranges for
this population (tolerance interval: p = 95% and γ= 95%) are
Table 1. Demographic data of the 118 healthy volunteers.
All volunteers Men Women
N = 118 N = 40 (33.9%) N = 78 (66.1%)
Age (years) 36.8 ± 11.2 35.8 ± 10.2 38.4 ± 12.8
Weight (kg) 70.3 ± 16.2 78.7 ± 10.5 65.9 ± 17.0 Ethnic background
Caucasian 58 (49.2%) 18 (45.0%) 40 (51.3%) Chinese 28 (23.7%) 8 (20.0%) 20 (25.6%)
Other* 32 (27.1%) 14 (35.0%) 18 (23.1%)
Blood type
O 42 (35.6%) 17 (42.5%) 25 (32.1%)
A 35 (29.7%) 12 (30.0%) 23 (29.5%)
B 26 (22.0%) 5 (12.5%) 21 (26.9%)
AB 7 (5.9%) 2 (5.0%) 5 (6.4%)
Unknown 8 (6.8%) 4 (10.0%) 4 (5.1%) Medication
Aspirin 6 (5.1%) 3 (7.5%) 3 (3.8%)
Other non-steroidal anti-inflammatory 3 (2.5%) - 3 (3.8%) Hormonal contraceptive 15 (12.7%) - 15 (19.2%) None 94 (79.7%) 37 (92.5%) 57 (73.1%)
The values for age and weight are reported as means ± SD. Values in parentheses indicate per
-centage of the total number of subjects in each category (N). *African-American, Latin, Japanese,
Normal TEG® values in healthy volunteers 1213
www.bjournal.com.br Braz J Med Biol Res 42(12) 2009
given in Table 2, including the 95% tolerance interval. Using a one-tailed chi-square test, the parameters for our population were found to be outside the manufacturer’s normal ranges in more than 5% of the volunteers for all parameters except K and LY30 (Table 3). The TEG® parameters for the 118 healthy
volunteers were analyzed using the manufacturer’s reference values, and were abnormal in up to 16.9% of subjects (Table 3). The broadest differences involved R (16.9% of the times), α and MA (12.7% of the times). Overall, 22 (18.6%) of all healthy volunteers had at least one abnormal parameter according to the manufacturer’s reference values.
To explore the clinical impact of having TEG® parameters
outside the reference values, volunteers were classified as having or not clinical coagulopathy according to Kaufmann et al. (4) (Table 4). Nine volunteers were hypocoagulable (4 with 4 abnormal parameters and 5 with 2) and 1 was hypercoagulable. Twelve volunteers had a single abnormal parameter and no disease according to Kaufmann’s classification (4). No one had mixed results. If we assume that no volunteer had a coagulation disorder, the specificity of TEG® was 81%.
Volunteers with abnormal results underwent additional testing for undetected diseases (Table 4), except 2 patients due to loss of their blood samples. There was no difference in any characteristics between this group and the remaining cohort. All volunteers tested had normal INR, while 13 (65%)
had abnormal PTT (Table 4). No volunteer had abnormal coagulation factor assays. Two hematologists reviewed the history and test results and concluded that no volunteer had a clinically relevant bleeding disorder.
The role of gender was explored and, except for R and LY30, all other parameters were significantly different, with women having a more hypercoagulable profile than men (Table 5). The gender differences remained when males were compared to females taking or not hormonal contraceptives, in fact either taking any medication at all or not. There were no significant differences in TEG® results when ethnicity, blood type and body mass were analyzed.
Discussion
TEG® is a laboratory coagulation test that appears to have many advantages over the tests commonly available during resuscitation and management of trauma patients. In contrast to INR, aPTT, platelet count, and even fibrinogen level, TEG®
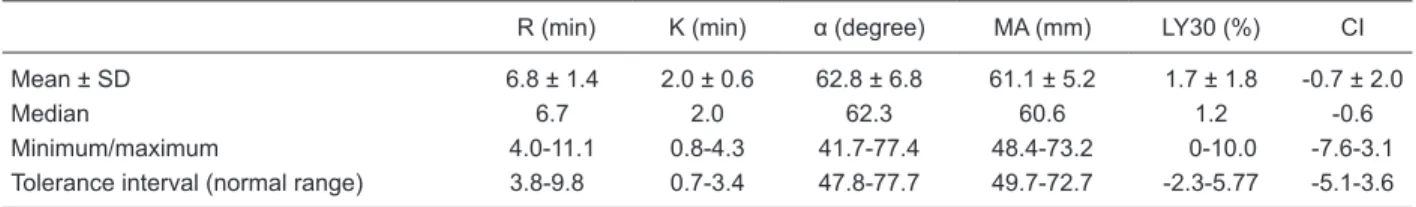
offers a broad and global view of coagulation, the interaction of the diverse elements, their activity, particularly if performed at the patient’s temperature and without additional buffers. It also offers information on portions of the clotting process that the conventional tests cannot, such as fibrinolysis and hyper-coagulability, and has the potential to direct the transfusion of Table 2. Reference values for thromboelastography using the data obtained for 118 healthy volunteers.
R (min) K (min) α (degree) MA (mm) LY30 (%) CI
Mean ± SD 6.8 ± 1.4 2.0 ± 0.6 62.8 ± 6.8 61.1 ± 5.2 1.7 ± 1.8 -0.7 ± 2.0
Median 6.7 2.0 62.3 60.6 1.2 -0.6
Minimum/maximum 4.0-11.1 0.8-4.3 41.7-77.4 48.4-73.2 0-10.0 -7.6-3.1
Tolerance interval (normal range) 3.8-9.8 0.7-3.4 47.8-77.7 49.7-72.7 -2.3-5.77 -5.1-3.6
R = time to initial fibrin formation; K = time to clot formation; α = alpha angle, rate of clot formation; MA = maximum amplitude, absolute clot strength; LY30 = fibrinolysis at 30 min after MA; CI = coagulation index. See section Statistical analysis for explanation of tolerance
interval.
Table 3. Number of test results outside the reference normal range proposed by the manufacturer.
R (min) K (min) α (degree) MA (mm) LY30 (%) CI
Present study reference values 3.8-9.8 0.7-3.4 47.8-77.7 49.7-72.7 -2.3-5.77 -5.1-3.6
Manufacturer’s reference values 3-8 1-3 55-78 51-69 0-8 -3-3
Number of tests below normal 0 1 15 2 0 11
Number of tests above normal 20 6 0 13 1 1
Total number of tests outside the manufacturer’s range 20 (16.9%) 7 (5.9%) 15 (12.7%) 15 (12.7%) 1 (0.8%) 12 (10.2%)
P 0.0001 0.4 0.0001 0.0001 0.9 0.009
R = time to initial fibrin formation; K = time to clot formation; α = alpha angle, rate of clot formation; MA = maximum amplitude, abso
-lute clot strength; LY30 = fibrinolysis at 30 min after MA; CI = coagulation index. The present reference values were compared to the manufacturer’s using the chi-square test to determine if the proportion of volunteers with values outside the manufacturer’s normal
blood and blood products. Yet, TEG® is rarely used in trauma,
and is not recognized as a conventional hemostasis test (8). Technologically TEG® has progressed significantly. In the
past it was criticized for being too dependent on manual proce-dures and for its results being excessively operator dependent (8,17-20,22,23,30,31). However, the recent development of computerized interfaces has addressed some of these limita-tions and has led to a renewed interest in TEG®, particularly
to guide blood transfusion practices (7,22,31). Our original goal, however, was not to evaluate the reliability of TEG® as
a laboratory test per se, but rather its potential clinical applica-tion in trauma care.
TEG® is remarkably versatile. It can be carried out using
fresh or anticoagulated whole blood or plasma. Different activa-tors such as kaolin, tissue factor/kaolin and celite provide the opportunity to investigate the role of contact proteins or tissue factors in initiating the clotting process. However, such
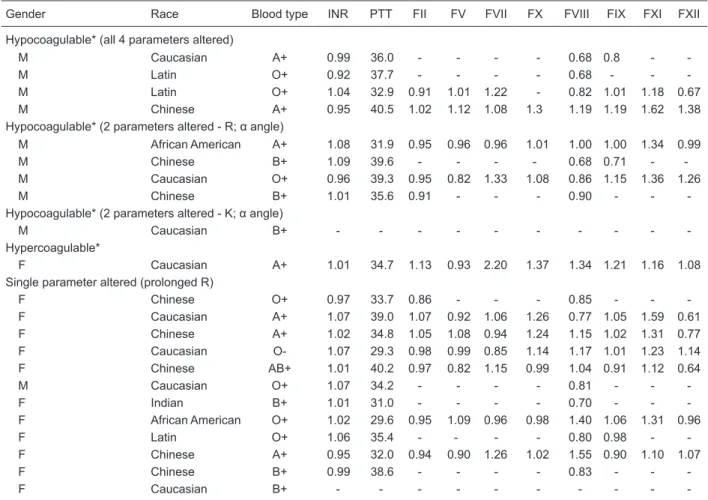
versatil-ity leads to difficulty in establishing standards and reference values, which may account for the current lack of application of this test in situations where the person being tested cannot Table 4. Additional coagulation tests performed on the volunteers with TEG® results outside the reference normal range proposed by
the manufacturer.
Gender Race Blood type INR PTT FII FV FVII FX FVIII FIX FXI FXII
Hypocoagulable* (all 4 parameters altered)
M Caucasian A+ 0.99 36.0 - - - - 0.68 0.8 -
-M Latin O+ 0.92 37.7 - - - - 0.68 - -
-M Latin O+ 1.04 32.9 0.91 1.01 1.22 - 0.82 1.01 1.18 0.67
M Chinese A+ 0.95 40.5 1.02 1.12 1.08 1.3 1.19 1.19 1.62 1.38
Hypocoagulable* (2 parameters altered - R; α angle)
M African American A+ 1.08 31.9 0.95 0.96 0.96 1.01 1.00 1.00 1.34 0.99
M Chinese B+ 1.09 39.6 - - - - 0.68 0.71 -
-M Caucasian O+ 0.96 39.3 0.95 0.82 1.33 1.08 0.86 1.15 1.36 1.26
M Chinese B+ 1.01 35.6 0.91 - - - 0.90 - -
-Hypocoagulable* (2 parameters altered - K; α angle)
M Caucasian B+ - - -
-Hypercoagulable*
F Caucasian A+ 1.01 34.7 1.13 0.93 2.20 1.37 1.34 1.21 1.16 1.08 Single parameter altered (prolonged R)
F Chinese O+ 0.97 33.7 0.86 - - - 0.85 - -
-F Caucasian A+ 1.07 39.0 1.07 0.92 1.06 1.26 0.77 1.05 1.59 0.61 F Chinese A+ 1.02 34.8 1.05 1.08 0.94 1.24 1.15 1.02 1.31 0.77 F Caucasian O- 1.07 29.3 0.98 0.99 0.85 1.14 1.17 1.01 1.23 1.14 F Chinese AB+ 1.01 40.2 0.97 0.82 1.15 0.99 1.04 0.91 1.12 0.64
M Caucasian O+ 1.07 34.2 - - - - 0.81 - -
-F Indian B+ 1.01 31.0 - - - - 0.70 - -
-F African American O+ 1.02 29.6 0.95 1.09 0.96 0.98 1.40 1.06 1.31 0.96
F Latin O+ 1.06 35.4 - - - - 0.80 0.98 -
-F Chinese A+ 0.95 32.0 0.94 0.90 1.26 1.02 1.55 0.90 1.10 1.07
F Chinese B+ 0.99 38.6 - - - - 0.83 - -
-F Caucasian B+ - - -
-M = male; F = female; *as defined by Kaufmann et al. (4); INR = International Normalized Ratio; PTT = partial thromboplastin (s); Fac -tor activity (%).
Table 5. Analysis of the TEG® parameters according to gender.
Male (N = 40) Females (N = 78) R (min) 7.1 ± 1.7 6.6 ± 1.2 K (min) 2.5 ± 0.6 1.8 ± 0.4*
α (angle) 57.6 ± 6.9 65.5 ± 5.0*
MA (mm) 58.0 ± 4.9 62.8 ± 4.6*
LY30 (%) 1.7 ± 2.0 1.8 ± 1.8
CI -1.9 ± 2.2 -0.1 ± 1.5*
Data are reported as means ± SD. R = time to initial fibrin formation; K = time to clot formation; α = alpha angle, rate of clot formation; MA = maximum amplitude, absolute clot strength; LY30 = fibrinolysis at 30 min after MA; CI = coagulation index. P
Normal TEG® values in healthy volunteers 1215
www.bjournal.com.br Braz J Med Biol Res 42(12) 2009
However, we found that even healthy and non-traumatized women are more hypercoagulable than men based on their TEG® profile (Table 4). Furthermore, medications such as
hormonal contraceptives and non-steroidal anti-inflammatory drugs had no measurable effect on the results of TEG®.
Thus, determining different normal range values for males and females warrants further investigation.
Concerning the potential effect of age on TEG® values,
our results do not support the findings of Ng (15), which showed that elderly patients (with femur fracture) have a more hypercoagulable TEG® profile. Similar to females, elderly individuals also have higher levels of clotting factors (15,38). In children, Chan et al. (34) found no significant age-specific differences between children 1 month to 16 years of age and adult healthy volunteers of unspecified age. The correlation between hypercoagulability and advanced age deserves further studies because of these contradictory results.
Finally, our data were not able to demonstrate any differ-ence in TEG® profile when ethnic background, body mass
and blood type were considered. The relationship between ethnicity and coagulation also deserves further study since some evidence suggests that it may affect coagulation profile, levels of fibrinogen and clotting factors (40).
The normal TEG® values proposed by the manufacturer
using citrated blood and Kaolin® activation may not be
ap-propriate for different populations. Even though this study did not explore the clinical implications, our results indicate that many otherwise healthy people in our population would be incorrectly identified as coagulopathic by the manufacturer’s reference values. We recommend that any institution using TEG® for clinical or research purposes should perform ap-propriate sized studies to determine normal values for its target population. The manufacturer’s recommendation of determining normal values in 20 healthy volunteers is prob-ably overly modest; a larger sample is required and screening for previously undiagnosed coagulation problems should be part of any such protocol.
However, determination of normal values at each institu-tion prior to adopting TEG® may be impractical; therefore,
consideration should be given to performing a large multi-center trial of TEG® in healthy volunteers to establish wide standard values for TEG®. In this way, any future institution
could adopt TEG® without the need of conducting a separate
“healthy volunteers” study.
Acknowledgments
The excellent technical support of Doug Saunders, Heather Wright, Cyndy Rogers, and Andrea Phillips is ac-knowledged. Research supported by Defense Research and Development Canada (DRDC), Toronto, Canada (#W7711-027801). S. Scarpelini is the recipient of a post-doctoral scholarship from CNPq, Brazil.
be his/her own control such as in trauma.
The evidence supporting the manufacturer’s normal values for TEG® is limited (15,18). In one study, the normal values
were determined in hospitalized surgical patients rather than in healthy volunteers, while in another, the results come from a small sample of 12 healthy volunteers (32). We found two additional studies using the same methodology we used and reporting on reference normal values. Ellis et al. (33), inves-tigating clot propagation, reported on 33 normal individuals ranging in age from 18 to 65 years and using both plasma and whole blood. Another study by Chan et al. (34) reported normal values in a pediatric population of 100 children under-going surgery. The reference normal values reported by these investigators are similar to those found in our population, but not identical. These studies suggest the existence of regional variations and strengthen our contention that each institution should generate its own values according to the norms dictated by CLIA (27,34). The number of healthy volunteers needed to establish reference normal values is debatable. The CLIA, which regulates all laboratory tests in the United States, de-mands a minimum of 30-40 subjects for special coagulation tests (27). We decided to include 100 to 120 volunteers and thus exceed the CLIA minimum by at least 3-fold.
The values obtained here for 118 volunteers from two differ-ent institutions for citrated blood activated with Kaolin® differed
from those proposed by the manufacturer. Overall, 18.6% of the volunteers had at least one abnormal parameter while 10 (8.5%) would have been considered coagulopathic had the manufacturer’s values been used, resulting in a test specific-ity of 81%. This figure contrasts with the usual expectation of reference values being correct for 95% of the population tested. However, the clinical implications of these findings remain to be proven. There is no solid evidence supporting that a single abnormal parameter reliably diagnoses coagulopathy while the specificity of 81% is higher than that of commonly used coagulation tests such as INR and PTT (35,36).
Thromboelastometry or ROTEM is a test very similar to TEG® and commonly used in Europe for comparable
indications. Lang et al. (16) studied the normal values for ROTEM in a 500-patient (including healthy volunteers and hospitalized patients) multicenter trial with different activators. Unfortunately, another recent study comparing TEG® and
ROTEM concluded that the significant differences between the two methodologies do not permit their results to be used interchangeably (37).
Besides determining the normal values using a Kaolin® -activated citrated blood technique, we also investigated the possible effects of gender, age, ethnicity, blood type, and body mass on TEG® results, since these factors have the
potential of affecting coagulation (15,38,39). Females are known to have higher levels of clotting factors (38), and one of the few TEG® studies in trauma concluded that after
References
1. Spiess BD, Gillies BS, Chandler W, Verrier E. Changes in transfusion therapy and reexploration rate after institution of a blood management program in cardiac surgical patients. J Cardiothorac Vasc Anesth 1995; 9: 168-173.
2. Pfanner G, Koscielny J, Pernerstorfer T, Gutl M, Perger P, Fries D, et al. [Preoperative evaluation of the bleeding history. Recommendations of the working group on
periop-erative coagulation of the Austrian Society for Anaesthesia,
Resuscitation and Intensive Care]. Anaesthesist 2007; 56:
604-611.
3. Mallett SV, Cox DJ. Thrombelastography. Br J Anaesth 1992;
69: 307-313.
4. Kaufmann CR, Dwyer KM, Crews JD, Dols SJ, Trask AL.
Usefulness of thrombelastography in assessment of trauma patient coagulation. J Trauma 1997; 42: 716-720.
5. Shore-Lesserson L, Manspeizer HE, DePerio M, Francis S, Vela-Cantos F, Ergin MA. Thromboelastography-guided
transfusion algorithm reduces transfusions in complex car-diac surgery. Anesth Analg 1999; 88: 312-319.
6. Mahla E, Lang T, Vicenzi MN, Werkgartner G, Maier R,
Probst C, et al. Thromboelastography for monitoring pro-Thromboelastography for monitoring pro-longed hypercoagulability after major abdominal surgery.
Anesth Analg 2001; 92: 572-577.
7. Srinivasa V, Gilbertson LI, Bhavani-Shankar K. Throm -boelastography: where is it and where is it heading? Int Anesthesiol Clin 2001; 39: 35-49.
8. Samama CM, Ozier Y. Near-patient testing of haemostasis
in the operating theatre: an approach to appropriate use of blood in surgery. Vox Sang 2003; 84: 251-255.
9. McCrath DJ, Cerboni E, Frumento RJ, Hirsh AL,
Bennett-Guerrero E. Thromboelastography maximum amplitude predicts postoperative thrombotic complications including myocardial infarction. Anesth Analg 2005; 100: 1576-1583.
10. Hobson AR, Agarwala RA, Swallow RA, Dawkins KD, Curzen
NP. Thrombelastography: current clinical applications and its potential role in interventional cardiology. Platelets 2006; 17: 509-518.
11. Rugeri L, Levrat A, David JS, Delecroix E, Floccard B, Gros A, et al. Diagnosis of early coagulation abnormalities in
trauma patients by rotation thrombelastography. J Thromb Haemost 2007; 5: 289-295.
12. Tien H, Nascimento B Jr, Callum J, Rizoli S. An approach to
transfusion and hemorrhage in trauma: current perspectives on restrictive transfusion strategies. Can J Surg 2007; 50: 202-209.
13. Gillies BS. Thromboelastography and liver transplantation.
Semin Thromb Hemost 1995; 21 (Suppl 4): 45-49. 14. Miller BE, Bailey JM, Mancuso TJ, Weinstein MS, Holbrook
GW, Silvey EM, et al. Functional maturity of the coagulation system in children: an evaluation using thrombelastography.
Anesth Analg 1997; 84: 745-748.
15. Ng KF. Changes in thrombelastograph variables associated with aging. Anesth Analg 2004; 99: 449-454.
16. Lang T, Bauters A, Braun SL, Potzsch B, von Pape KW, Kol -de HJ, et al. Multi-centre investigation on reference ranges
for ROTEM thromboelastometry. Blood Coagul Fibrinolysis 2005; 16: 301-310.
17. Camenzind V, Bombeli T, Seifert B, Jamnicki M, Popovic D, Pasch T, et al. Citrate storage affects thrombelastograph
analysis. Anesthesiology 2000; 92: 1242-1249.
18. Pivalizza EG, Pivalizza PJ, Gottschalk LI, Kee S, Szmuk P, Abramson DC. Celite-activated thrombelastography in
children. J Clin Anesth 2001; 13: 20-23.
19. Avidan MS, Da Fonseca J, Parmar K, Alcock E, Ponte J,
Hunt BJ. The effects of aprotinin on thromboelastography with three different activators. Anesthesiology 2001; 95:
1169-1174.
20. Pivalizza EG, Warters RD. Kaolin-activated thromboelastog-raphy. Anesthesiology 2002; 97: 758.
21. Roche AM, James MF, Grocott MP, Mythen MG. Citrated blood does not reliably reflect fresh whole blood coagulabil -ity in trials of in vitro hemodilution. Anesth Analg 2003; 96:
58-61, table.
22. Sorensen B, Johansen P, Christiansen K, Woelke M, In-gerslev J. Whole blood coagulation thrombelastographic
profiles employing minimal tissue factor activation. J Thromb Haemost 2003; 1: 551-558.
23. Zambruni A, Thalheimer U, Leandro G, Perry D, Burroughs AK. Thromboelastography with citrated blood: comparabil -ity with native blood, stabil-ity of citrate storage and effect of repeated sampling. Blood Coagul Fibrinolysis 2004; 15: 103-107.
24. Anonymous. TEG hemostasis analizer - User manual. Niles: Haemoscope Corporation; 2004.
25. Rajwal S, Richards M, O’Meara M. The use of recalcified cit -rated whole blood - a pragmatic approach for thromboelas-tography in children. Paediatr Anaesth 2004; 14: 656-660.
26. Vig S, Chitolie A, Bevan DH, Halliday A, Dormandy J. Throm -boelastography: a reliable test? Blood Coagul Fibrinolysis 2001; 12: 555-561.
27. Centers for Disease Control and Prevention. Considering
the clinical laboratory improvement amendment. http:// wwwn.cdc.gov/clia/regs/toc.aspx.
28. Samama CM. Thromboelastography: the next step. Anesth Analg 2001; 92: 563-564.
29. Waters JH, Anthony DG, Gottlieb A, Sprung J. Bleeding in
a patient receiving platelet aggregation inhibitors. Anesth Analg 2001; 93: 878-882, table.
30. Kawasaki J, Tanaka KA, Sato N, Saitoh T, Shimizu M, Kawa -zoe T. Blood component therapy guided by celite-activated thromboelastography for perioperative coagulopathy. J Anesth 2002; 16: 79-83.
31. Hvitfeldt Poulsen L, Christiansen K, Sorensen B, Ingerslev J. Whole blood thrombelastographic coagulation profiles using
minimal tissue factor activation can display hypercoagula-tion in thrombosis-prone patients. Scand J Clin Lab Invest 2006; 66: 329-336.
32. Katori N, Szlam F, Levy JH, Tanaka KA. A novel method to assess platelet inhibition by eptifibatide with thrombelasto -graph. Anesth Analg 2004; 99: 1794-1799, table.
33. Ellis TC, Nielsen VG, Marques MB, Kirklin JK. Thrombelas- Thrombelas-tographic measures of clot propagation: a comparison of alpha with the maximum rate of thrombus generation. Blood Coagul Fibrinolysis 2007; 18: 45-48.
34. Chan KL, Summerhayes RG, Ignjatovic V, Horton SB,
Monagle PT. Reference values for kaolin-activated throm-boelastography in healthy children. Anesth Analg 2007; 105:
Normal TEG® values in healthy volunteers 1217
www.bjournal.com.br Braz J Med Biol Res 42(12) 2009
35. Asaf T, Reuveni H, Yermiahu T, Leiberman A, Gurman G, Porat A, et al. The need for routine pre-operative coagulation
screening tests (prothrombin time PT/partial thromboplastin
time PTT) for healthy children undergoing elective
tonsillec-tomy and/or adenoidectonsillec-tomy. Int J Pediatr Otorhinolaryngol 2001; 61: 217-222.
36. Martini WZ, Cortez DS, Dubick MA, Park MS, Holcomb JB.
Thrombelastography is better than PT, aPTT, and activated clotting time in detecting clinically relevant clotting abnormal-ities after hypothermia, hemorrhagic shock and resuscitation in pigs. J Trauma 2008; 65: 535-543.
37. Nielsen VG. A comparison of the thrombelastograph and the ROTEM. Blood Coagul Fibrinolysis 2007; 18: 247-252.
38. Lowe GD, Rumley A, Woodward M, Morrison CE, Philippou H, Lane DA, et al. Epidemiology of coagulation factors, in
-hibitors and activation markers: the Third Glasgow MONICA
Survey. I. Illustrative reference ranges by age, sex and hormone use. Br J Haematol 1997; 97: 775-784.
39. Schreiber MA, Differding J, Thorborg P, Mayberry JC, Mullins
RJ. Hypercoagulability is most prevalent early after injury and in female patients. J Trauma 2005; 58: 475-480.
40. Lutsey PL, Cushman M, Steffen LM, Green D, Barr RG, Her -rington D, et al. Plasma hemostatic factors and endothelial