103
Brazilian Journal of Poultry Science Revista Brasileira de Ciência Avícola
ISSN 1516-635X Jan - Mar 2017
Special Issue Nutrition / 103-116
http://dx.doi.org/10.1590/1806-9061-2016-0174
Effects of Dietary Inclusion of Oil Sources With or
Without Vitamin E on Body Composition and Meat
Oxidation Level in Broilers*
Author(s)
Taşdelen EÖI
Ceylan NI
I Department of Animal Science, Faculty of
Agriculture, Ankara University, Turkey
* This paper was prepared from PhD thesis of E. Öztürk Taşdelen
Mail Address
Corresponding author e-mail address Necmettin Ceylan
Ankara University, Faculty of Agriculture, Animal Science, Dışkapı, Ankara-Turkey 06110
Tel: +90-312-5961753 Email: [email protected]
Keywords
Rapeseed oil, vitamin E, performance and meat quality, oxidative stability, omega-3 fatty acids.
Submitted: November/2015 Approved: July/2016
ABSTRACT
The objective of this study was to investigate the effects of rapeseed oil substitution and vitamin E supplemantation on performance and meat quality. 4 replacement levels of rapeseed oil with sunflower oil ( 0, 33.3 , 66.7 and 100%) and 2 levels of vitamin E (0 (50 I.U. from vitamin premix) 300 mg/kg) in a 2 x 3 factorial arrangement for a total of 8 treatments with 4 replicates each, containing 10 day-old male Ross 308 broilers, were examined in the experiment. Dietary treatments had no significant effect on carcass parameters, feed conversion (FCR) and mortality (p>0.05). However, a significant interaction was observed between oil replacement and vitamin E: the negative effect of 100% sunflower oil on BWG (p<0.01) was alleviated by the addition of vitamin E. On the other hand, inclusion of rapeseed oil improved BWG (p<0.01). Rapeseed oil substitution significantly increased amount of total n-3 PUFA and decreased n-6:n-3 ratio in thigh and breast meat (p<0.01). Vitamin E supplemantation contributed to deposition of n-3 PUFA (p<0.01). Replacement of rapeseed oil without vitamin E tended to increase (p<0.01) malonaldehyde production. However, the dietary supplementation of vitamin E markedly (p<0.01) decreased the susceptibility of meat to peroxidation. Inclusion of rapeseed oil did not cause any negative perception on olfactory, texture, and taste of broiler meat. So, it can be concluded that rapeseed oil substitution significantly increased n-3 PUFA deposition without altering performance and sensory properties of broiler meat and, vitamin E had strong potential to prevent the meat lipids from oxidation.
INTRODUCTION
Ancestral human nutrition studies revealed that, compared to today’s diets, the amount of fat in a balanced diet did not exceed 20-30% of total energy intake, in which 5-6 g/d of omega-3 poly unsaturated fatty acids (n-3 PUFA) with rich eicosapentanoic acid (EPA, C20:5n-3) + docosahexaenoic acid (DHA, 22:6n-3) and the ratio of n-6:n-3 averaged 1:1 or 1:2 with low saturated and trans fatty accids (FAs). Nowadays, this ratio has changed to 15:1 to 20:1, which points out the significantly reduced amount of n-3 PUFA in the diets (Simopoulos, 2000; Simopoulos, 2008; Molendi-Coste et al., 2011) but the approved
ratio for human health is actually between 4:1 to 10:1 (Mazalli et al., 2004).
Broiler chickens generally have a high capacity for lipid biosynthesis which has the propensity to become excessively fat. This fat accumulation has significant health implications, as carcass fat of birds is an important source of dietary fat for man (Newman et al., 2002). Therefore, the FA
docosapentaenoic acid (DPA, 22:5n-3), and DHA are some of the most important FA groups (Rahimi et al., 2011).
Fish (especially oily fish such as mackerel, herring, sardine, salmon, trout, and tuna), in spite of containing natural sources of EPA and DHA, has been rarely or never consumed by some people because of its olfactory problems, while demand for other meat productions such as chicken has been increasing (Molendi-Coste
et al., 2011; Nyquist et al., 2013). It has been shown
that FA composition of broiler meat can be altered by inclusion of different vegetable and fish oil sources in chicken’s diet (Lopez-Ferrer et al., 2001a). Therefore, in
order to supply human consumer´s diet with n-3 PUFAs and antioxidants such as vitamin E, methods must be utilized to enrich chicken´s diet with EPA and DHA or their precursor linoleic acid (LA; 18:2n-6). During the last four decades many studies have been conducted to manipulate FA profile of broiler muscle tissues in order to increase n-3 PUFA content and decrease n-6 : n-3 ratio (Miller & Robisch, 1969; Zduńczyk et al., 2011; Haug et al., 2011; Rahimi et al., 2011; Nyquist
et al., 2013).
The following order shows the oxidative capacity of different meat types: fish > turkey > chicken > pork > beef > lamb. This ranking depends on the content of the PUFA in muscle tissues (Janssens et al., 1999). Negative effect of enriching meat with “good for health” PUFA results from these compond´s sensitivity to oxidaiton that produces “bad for health” pro-oxidant free radicals which may enhance the development of sensory problems. Oxidative damage increases during storage and cooking process based on the time and temperature (Cortinas et al., 2004;
Barroeta, 2007; Roux et al., 2011). Inclusion of the
vitamin E in broiler diet leads to increased vitamin E in the meat which improves membrane stability. This may boost meat and meat production´s resistance to peroxidation (Coetzee & Hoffman, 2001). That is why the addition of vitamin E has been suggested as a convenient method in improving oxidative stability and increasing the shelf life of meat (Coetzee & Hoffman, 2001; Barroeta, 2007). Diet manipulation or changes in feed processing stages, utilizing methods to decrease feed cost, and quality control of final products during development of new food products often demand sensory evaluation techniques to determine the products acceptability (Srinivassane, 2011). The sensory properties of n-3 FA enriched meat products should be assessed for consumer´s acceptance before introduction into the market. Sensory analysis provides
a better understanding of consumer perception of food products (Srinivassane, 2011).
The objective of the current study was to determine the effects of dietary replacing levels of sunflower and rapeseed oils and supplemented or unsupplemented with α-tocopheryl acetate (as a commercial source of vitamin E) on the FA profile and thiobarbituric acid reactive substances (TBARS) level of thigh and breast chicken meat. The other aim of the present study was the determination of the acceptability of n-3 PUFA enriched chicken meat by sensory evaluation.
MATERIALS AND METHODS
All protocols for the experiment were reviewed and approved by the Local Animal Care and Use Committee of Ankara University.
Diet Preparation
Before preparation of the experimental diets, crude protein, crude ash, crude fat and dry matter of corn and soybean were determined (AOAC, 2000). The corn and soybean meal were ground in a mill with a three millimeter sieve for starter (0-3 weeks) periods. Vitamin and mineral premix, vitamin E, lysine, methionine and salt were mixed by a 3 kg capacity laboratory Lödige®
mixer at the department of Feed and Animal Nutrition of University of Ankara. During ration preparation at the Ankara University feed factory, the mixture of micro ingredients were mixed with a fine grined soybean meal. Then, this mixture was added to the corn and soybean meal blending in the mixer. Finally, the experimental oil was slowly poured into the mixer. After a 3-minute mixing period, the diet was packed in 40 kg sacks and stored at a dry place at room temperature (20-22°C) during the trial. The same procedure was followed in preparing the diet for grower-finisher (4-6 weeks) periods with only one difference in which the corn and soybean meal were ground in a mill with a five-millimeter sieve. Experimental diet and the composition of starter and grower-finisher diets are shown in Table 1 and 2 respectively. The composition of the diets were adjusted according to the NRC (National Research Council, 1994) and met or exceeded the nutritional recommendations of Ross 308 breeders company catalog for broilers.
105
Taşdelen EÖ, Ceylan N Effects of Dietary Inclusion of Oil Sources With or
Without Vitamin E on Body Composition and Meat Oxidation Level in Broilers
50 I.U. comes from vitamin premix) and 300 mg/kg) was also added to each diets. Thus the experiment was conducted as a randomized block design with a factorial arrangement of 4×2. The diets were also analysed for dry matter, protein and crude fat, crude fiber, starch and sugar according to AOAC (2000). The ME content of the diets was then calculated according to the following WPSA Formula (1984); ME [kcal/kg]=[3.69x% crude protein{CP}+8.18×% ether extractable fat{EE}+3.99×% starch+3.11x% sugar]).
Birds and housing
Three hundred and twenty commercial Ross × Ross 308 newly hatched broiler chickens were randomly allocated to eight isocaloric and isonitrogenous dietary treatments with four replicates. Ten chicks were randomly assigned to each of 32 battery wire cages with eight groups of four pens each.
Ambient temperature was gradually decreased from 33 °C at first day to 21-22°C after 3 weeks of age thereafter by thermostatically controlled heater
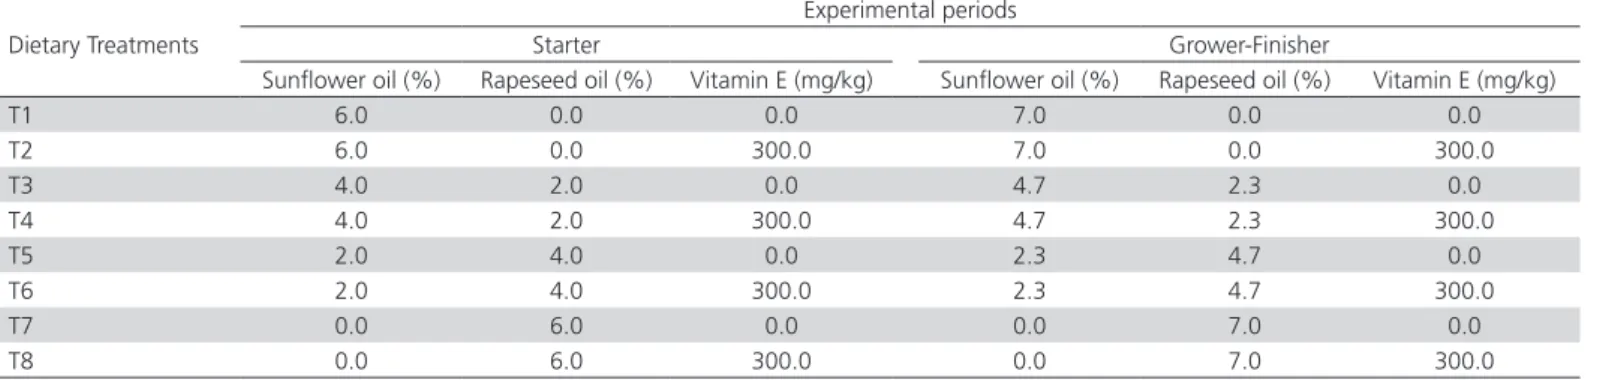
Table 1 – Experimental design
Dietary Treatments
Experimental periods
Starter Grower-Finisher
Sunflower oil (%) Rapeseed oil (%) Vitamin E (mg/kg) Sunflower oil (%) Rapeseed oil (%) Vitamin E (mg/kg)
T1 6.0 0.0 0.0 7.0 0.0 0.0
T2 6.0 0.0 300.0 7.0 0.0 300.0
T3 4.0 2.0 0.0 4.7 2.3 0.0
T4 4.0 2.0 300.0 4.7 2.3 300.0
T5 2.0 4.0 0.0 2.3 4.7 0.0
T6 2.0 4.0 300.0 2.3 4.7 300.0
T7 0.0 6.0 0.0 0.0 7.0 0.0
T8 0.0 6.0 300.0 0.0 7.0 300.0
Table 2 – Composition of starter and grower-finisher diets, g/kg air-dry diets
Ingredients
Dietary treatments1
Starter period (0-3 weeks) grower-finisher period (4-6 weeks)
T1 T2 T3 T4 T1 T2 T3 T4
Maize 509.99 509.99 509.99 509.99 545.83 545.83 545.83 545.83
Soyabean meal (46 %CP) 374.80 374.80 374.80 374.80 347.49 347.49 347.49 347.49
Fish meal (70 %CP) 15 15 15 15 - - -
-Sunflower oil 60 40 20 0.0 70 46.69 23.31 0.0
Rapeseed oil 0.0 20 40 60 0.0 23.31 46.69 70
Limestone 11.15 11.15 11.15 11.15 12.3 12.3 12.3 12.3
Dicalcium phosphate 15.89 15.89 15.89 15.89 13.90 13.90 13.90 13.90
DL-methionine 3.17 3.17 3.17 3.17 2.06 2.06 2.06 2.06
L-lysine 2.80 2.80 2.80 2.80 1.42 1.42 1.42 1.42
Vitamin premix2 2.5 2.5 2.5 2.5 2.5 2.5 2.5 2.5
Mineral premix3 1 1 1 1 1 1 1 1
NaCl 3.5 3.5 3.5 3.5 3.5 3.5 3.5 3.5
Anticoccidial 0.2 0.2 0.2 0.2
Total 1000 1000 1000 1000 1000 1000 1000 1000
Analysed composition
ME, kcal/kg 3104.56 3097.23 3104.64 3109.45 3193.07 3190.09 3195.39 3211.38
Crude protein,% 22.97 23.06 23.19 23.02 19.94 20.25 20.05 20.06
Crude fat,% 8.71 8.74 8.54 8.719 10.20 10.22 10.13 10.27
Crude fiber, % 3.48 3.47 3.48 3.50 3.17 3.09 3.13 3.13
Crude ash,% 6.50 6.49 6.30 6.60 6.54 6.49 6.30 6.60
Dry matter, % 90.36 90.33 90.44 90.35 90.33 90.66 90.41 90.59
Ca, %, calculated 1.00 1.00 1.00 1.00 0.90 0.90 0.90 0.90
P(avialable),%, calculated 0.45 0.45 0.450 0.450 0.37 0.37 0.37 0.37
1 see Table 1
2 Vitamin premix: each 2.5 kg contain: 12 000 000 I.U. Vit. A, 1 500 000 I.U. Vit. D
3,50 I.U. dl-alpha-tocopherol acetate, 5 000 mg Vit. K3, 3 000 mg Vit. B1, 6 000 mg Vit. B2, 25 000
mg niasin, 12 000 mg calcium-D- pantothenate, 5 000 mg Vit. B6, 30 mg Vit. B12, 1 000 mg folic acid, 5 mg D-Biotin, 2 500 mg apocarotenoid acid ester, 400 000 mg choline chloride
fan. Relative humidity was maintained at 50±5%. Initial mean and range of body weight were similar (Table 5) for all pens. Experimental place was artificially ventilated and incandescent light was provided for 24 hours for the first three days and followed by thirty nine days with 23 hours light. Each cage was equipped with two inside nipple drinkers and an outside galvanized
feed trough. The birds had ad libitum access to feed (mash form) and water during the experiment. Health status and mortality of birds was controlled daily during the entire experimental period.
Data collection
Performance data, average weekly feed intake (FI) and body weight gain (BWG) were recorded. FCR was calculated from feed consumed per unit of BWG. These data are presented in Table 5 on a periodic basis (1-21, 22-42 and 1-42 day). Mortalities were recorded daily. On day 42 after a 10-hour feed withdrawal, 128 birds (4 birds per replicate) were slaughtered manually and allowed to bleed for 3 minutes. Having soaked in +60°C water for approximatly 50 seconds the carcasses were defeathered mechanically. Carcasses were manually eviscerated and refrigerated to reach +4°C. Then, carcass and carcass parts yield data were collected from 128 broilers (4 birds per replicate) which included carcass yield, thigh, breast, and abdominal fat pad weight.
Carcasses were evaluated as follows: the complete deboned skinless right thigh and breast (pectoralis major + pectoralis minor) meat were removed from the chilled carcasses (4 °C) and frozen at -26°C for 7 days before sensory analyses (olfactory, tenderness and juiciness, taste). Organoleptic characteristics of
Table 4 – FA profile of experimental diets, sunflower oil and rapeseed oil (% of total FAs)
Dietary treatments1
Starter period grower-finisher period
Fatty acids2 T1 T2 T3 T4 T1 T2 T3 T4
Miristic C14:0 0.17 0.14 0.11 0.13 0.17 0.18 0.14 0.12
Miristoleic C14:1 0.14 0.20 0.12 0.12 0.15 0.14 0.14 0.08
Palmitic C16:0 21.12 19.71 17.08 15.07 20.46 18.07 16.95 13.97
Palmitoleic C16:1 0.35 0.23 0.25 0.25 0.25 0.25 0.24 0.33
Heptadecanoic C17:0 0.14 0.14 0.15 0.18 0.11 0.12 0.14 0.10
Stearic C18:0 8.79 7.50 5.89 4.42 8.24 6.93 5.76 3.72
Oleic C18:1 46.84 52.05 57.30 61.21 49.45 54.44 57.61 60.83
Linoleic C18:2n-6 10.62 7.29 6.59 5.58 9.79 9.30 6.66 6.91
Linolenic C18:3n-3 - 0.17 0.31 0.40 0.16 0.19 0.25 1.51
Arachidic C20:0 0.39 0.57 0.48 0.57 0.34 0.44 0.45 0.48
Eicosapentaenoic C20:5n-3 5.18 6.61 6.70 7.02 5.45 5.03 6.66 6.68
Behenic C22:0 3.89 3.76 3.32 3.86 3.75 2.75 3.18 2.80
Docosapentaenoic C22:5n-3 0.54 0.61 0.42 0.43 0.53 0.55 0.50 0.37
Docosahexaenoic C22:6n-3 1.82 1.02 1.27 0.77 1.13 1.60 1.32 2.11
ΣSFA 34.5 31.82 27.03 24.23 33.07 28.49 26.62 21.19
ΣMUFA 47.33 52.48 57.67 61.58 49.85 54.83 57.99 61.24
ΣPUFA 18.16 15.7 15.29 14.2 17.06 16.67 15.39 17.58
ΣPUFA n-6 10.62 7.29 6.59 5.58 9.79 9.30 6.66 6.91
ΣPUFA n-3 7.54 8.41 8.7 8.62 7.27 7.37 8.73 10.67
n-6:n-3 1.41 0.86 0.76 0.65 1.34 1.26 0.79 0.65
1see Table 1
2ΣSFA=total saturated fatty acids; ΣMUFA=total monounsaturated fatty acids; ΣPUFA=total polyunsaturated fatty acids.
Table 3 – FA profile of dietary sunflower and rapeseed oil (% of total FAs)
Parameters Sunflower oil Rapeseed oil
Miristic C14:0 0.06 0.04
Palmitic C16:0 5.87 4.50
Palmitoleic C16:1 0.09 0.24
Heptadecanoic C17:0 0.03 0.05
Stearic C18:0 3.89 1.67
Oleic C18:1 28.81 61.22
Linoleic C18:2n-6 60.40 20.82
Linolenic C18:3n-3 0.09 9.04
Arachidic C20:0 0.08 1.22
Eicosaenoic C20:1 - 0.57
Behenic C22:0 0.68 0.32
Erusic C22:1 - 0.28
ΣSFA 10.61 7.8
ΣMUFA 28.9 62.31
ΣPUFA 60.49 29.86
ΣPUFA n-6 60.40 20.82
ΣPUFA n-3 0.09 9.04
107
Ta
ş
delen EÖ, Ceylan N
Ef
fects of Dietary Inclusion of Oil Sources With or
Without Vitamin E on Body Composition and Meat
Oxidation Level in Broilers
Table 5 – Effects of dietary sunflower and rapeseed oil with or without vitamin E on performance of broilers2
Treatments1
BWG, g/day FI, g/period FCR, kg feed /kg BWG
Initial weight g/bird
0-3 4-6 0-6 0-3 4-6 0-6 0-3 4-6 0-6
T1 45.33±0.48 638.40±20.7 1168.0±76.8c 1806.4±94.4c 811.4±20.6 2118.3±35.2b 2929.7±45.4b 1.27±0.01 1.83±0.09 1.63±0.06
T2 45.20±0.41 681.80±13.4 1275.1±45.9ab 1956.9±57.8ab 838.4±13.1 2267.8±26.1a 3106.2±42.7a 1.23±0.02 1.78±0.04 1.59±0.03
T3 45.35±0.43 708.90±7.83 1251.0±56ab 1959.9±60.4ab 885.5±7.59 2290.8±16.7a 3176.2±30.0a 1.24±0.01 1.84±0.07 1.62±0.04
T4 45.12±0.39 717.13±7.56 1264.5±66.5ab 1981.6±69.7ab 859.6±7.33 2310.7±18.7a 3170.4±23.0a 1.19±0.01 1.84±0.09 1.60±0.05
T5 45.20±0.40 677.00±24.8 1323.0±67.2a 2000.3±82.2a 838.1±24.6 2337.4±65.7a 3175.5±81.9a 1.23±0.02 1.77±0.06 1.59±0.04
T6 45.25±0.35 679.00±11.6 1210.1±77.5bc 1889.1±71.1ab 835.1±11.8 2228.6±76.2ab 3063.7±73.8a 1.23±0.01 1.85±0.06 1.62±0.02
T7 45.25±0.35 683.30±10.5 1277.1±24.8ab 1960.3±17.2ab 842.4±10.7 2331.6±36.2a 3174.0±46.7a 1.23±0.01 1.82±0.05 1.61±0.03
T8 45.32±0.34 675.20±13.1 1248.2±65.3ab 1923.4±69.3ab 836.0±13.1 2310.3±40.4a 3146.3±40.7a 1.23±0.01 1.86±0.07 1.64±0.04
p value ns ns 0.001 0.001 ns 0.05 0.04 ns ns ns
Main effects
Oil replacement level
0% 45.26±0.29 660.10±14b 1221.6±46.1 1881.7±58.6 824.9±12.3b 2193.0±34.8 b 3017.9±44.1b 1.25±0.01 1.80±0.05 1.61±0.03
33.3% 45.23±0.27 713.01± 5.27a 1257.8±40.3 1970.8±42.9 872.5±9.28a 2300.8±12.2a 3173.3±17.5a 1.22±0.01 1.84±0.05 1.61±0.03
66.7% 45.22±0.24 678.00±12.7b 1266.7±52.1 1944.7±55.2 836.6±12.8a 2283.0±50.9a 3119.6±55.2a 1.23±0.01 1.81±0.04 1.60±0.02
100% 45.28±0.22 679.23± 7.9b 1262.6±32.8 1941.9±33.8 839.2±13.0a 2321.0±25.4a 3160.2±29.1a 1.23±0.02 1.84±0.04 1.63±0.02
P value ns 0.01 ns 0.059 0.05 0.01 0.01 ns ns ns
Vitamin E
0 mg/kg 45.28±0.18 676.90±10.1 1254.8±30.3 1931.7±36.9 844.4±10.2 2269.5±29.8 3113.8±36.7 1.24±0.009 1.81±0.03 1.61±0.02
300 mg/kg 45.22±0.17 688.28±6.7 1249.5±29.7 1937.7±31.4 842.3±8.4 2279.4±22.4 3121.6±24.1 1.22±0.007 1.83±0.03 1.61±0.01
p value ns ns ns ns ns ns ns ns ns ns
Intractions ns ns 0.002 0.003 ns 0.02 0.03 ns ns ns
1 see Table 1
2 BWG - body weight gain, FI - feed intake and FCR - feed conversion ratio
thigh and breast meat were performed with untrained panelists, consisting of 16 bachelor students. Meat samples were prepared according to the method based on Hugo et al. (2009). Before cooking, samples
were thawed overnight at 4°C. Meat samples were lightly-salted and steamed (200°C) in an oven, until a constant internal temperature of nearly 90°C was reached. The cooked thighs and breasts were cut into smaller cubes of 2.5 × 2.5 × 2.5 cm and then served to the panelists. Each sample was served in a plate, covered with a square of aluminium foil (which are available at local markets for cooking). Tasting was performed at room temperature (20 – 22°C) under white fluorescent lighting. Hedonic scale (1 to 9) was used for acceptability analysis. Numbers 1 to 9 were respectively assigned for dislike extremely, dislike very much, dislike moderately, dislike slightly, neither like nor dislike, like slightly, like moderately, like very much, and like extremely. Three series of questionnaires were prepared based on hedonic scale for the odour, tenderness and juiciness, and taste. Tepid water was used by panellists for palate cleaning between samples.
The complete deboned skinless left thighs and breasts (pectoralis major + pectoralis minor) were also collected and two tissue samples were taken from each. The first set of samples were frozen at -26°C for crude protein, crude fat, and FA profile analysis. The second set of samples of left thigh and breast muscle were stored at +4°C for 1, 3, 6 and/or 9 days until TBARS value determination.
Chemical analysis
All 128 left thigh and breast samples from all treatments were used for FA analysis. The FA profile of the experimental oils and diets were also determined. The total fat of oils, diets, thigh and breast muscles were extracted according to the method described by Blight et al. (1959).
The FA profile was determined by means of gas chromatography (Hewlett-Packard Company, Wilmington, DE, A.B.D.) equipped with a BPX70 capillary column (SGE capillary column; length, 25 m; I.D., 0.25 mm, 0.25mm film) and a flame ionization detector. The operating conditions of the gas chromatograph were as follows: the initial temperature was 190 °C for 5 min, increasing by 3 °C/min to 220 °C remained stable at final temperature for 25 min, the injection temperature was 250 °C and the detector temperature was 260 °C. The FA percentage was integrated and then calculated by means of direct normalization of the peak areas. Each FA was identified in the form of a methyl ester by comparing the retention times with the
Supelco 37 Component FAME Mix standard acquired at Sigma Interlab A.S. (Interlab S.A. Istanbul, Turkey).
The extent of lipid peroxides in thigh and breast meat samples (1, 3, 6 and/or 9 days of storage at +4°C temperature) was assessed by measuring TBARS according to the method described by Tarladgis et al.
(1960).
Statistical Analysis
Statistical analyses of data was conducted as a randomized block design, with a factorial arrangement of 4×2, taking into consideration main effects of inclusion of replacement levels of sunflower oil by rapeseed oil (% 0, % 33.3 , % 66.7 ve % 100) and vitamin E levels (0 and 300 mg/kg) with an equal number of 4 replicates for each treatment. The SAS programme (2001) was used for data analysing. When necessary mean separation was accomplished by using Duncan’s multiple-range test a probability value of less than 0.05 was considered significant, unless otherwise noted. All percentage data were subjected to arcsine square root transformation (Steel & Torrie, 1960).
RESULTS AND DISCUSSION
The FA compositions of experimental oils are shown in table (Table 3). The ratio between n-6 and n-3 FA were 671.11 and 2.30 in the sunflower and rapeseed oil, respectively. Rapeseed oil in comparison with sunflower oil contains higher level of MUFA of oleic acid type (61.22 vs 28.81 respectively) and lower level of n-6 PUFA (LA; 18:2n-6) (20.82 vs 60.40 repectively). FA profile of diets (Table 4) clearly reflected the origin of the added oils. As expected, the sunflower oil diet contained a greater proportion of LA (18:2n-6) which was the major FA (60.40%) compared to rapeseed oil diet (20.82%) the only one of the n-6 series.
Body weight gain (BWG), feed intake (FI), and feed conversion ratio (FCR) of chicks fed the different experimental diets are shown in Table 5. Dietary oil level had significant effect on BWG during the starter period of trail so that, birds fed on diet containing 33.3 % replacing level had the highest BWG (p=0.01); the effect of vitamin E and its interaction with dietary oil was not significant for starter period. The interaction of vitamin E and oil was significant in grower-finisher phase (p=0.002) and over the whole period (p=0.003) (Table 5).
109
Taşdelen EÖ, Ceylan N Effects of Dietary Inclusion of Oil Sources With or
Without Vitamin E on Body Composition and Meat Oxidation Level in Broilers
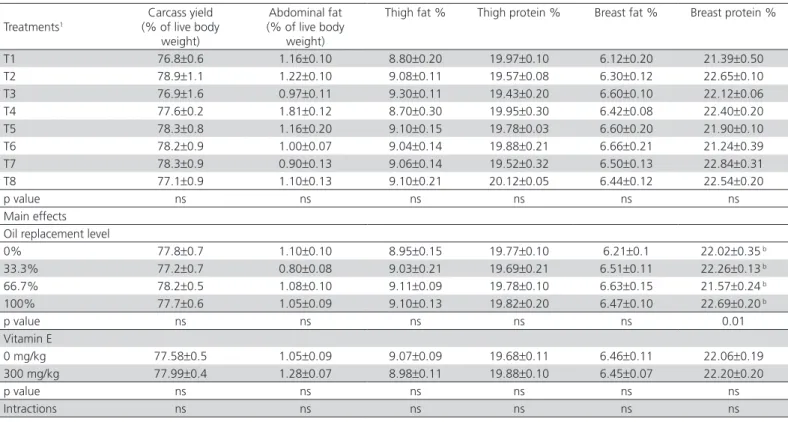
Table 6 – Effects of dietary sunflower and rapeseed oil with or without vitamin E on some carcass parameters of broiler
Treatments1
Carcass yield (% of live body
weight)
Abdominal fat (% of live body
weight)
Thigh fat % Thigh protein % Breast fat % Breast protein %
T1 76.8±0.6 1.16±0.10 8.80±0.20 19.97±0.10 6.12±0.20 21.39±0.50
T2 78.9±1.1 1.22±0.10 9.08±0.11 19.57±0.08 6.30±0.12 22.65±0.10
T3 76.9±1.6 0.97±0.11 9.30±0.11 19.43±0.20 6.60±0.10 22.12±0.06
T4 77.6±0.2 1.81±0.12 8.70±0.30 19.95±0.30 6.42±0.08 22.40±0.20
T5 78.3±0.8 1.16±0.20 9.10±0.15 19.78±0.03 6.60±0.20 21.90±0.10
T6 78.2±0.9 1.00±0.07 9.04±0.14 19.88±0.21 6.66±0.21 21.24±0.39
T7 78.3±0.9 0.90±0.13 9.06±0.14 19.52±0.32 6.50±0.13 22.84±0.31
T8 77.1±0.9 1.10±0.13 9.10±0.21 20.12±0.05 6.44±0.12 22.54±0.20
p value ns ns ns ns ns ns
Main effects Oil replacement level
0% 77.8±0.7 1.10±0.10 8.95±0.15 19.77±0.10 6.21±0.1 22.02±0.35 b
33.3% 77.2±0.7 0.80±0.08 9.03±0.21 19.69±0.21 6.51±0.11 22.26±0.13 b
66.7% 78.2±0.5 1.08±0.10 9.11±0.09 19.78±0.10 6.63±0.15 21.57±0.24 b
100% 77.7±0.6 1.05±0.09 9.10±0.13 19.82±0.20 6.47±0.10 22.69±0.20 b
p value ns ns ns ns ns 0.01
Vitamin E
0 mg/kg 77.58±0.5 1.05±0.09 9.07±0.09 19.68±0.11 6.46±0.11 22.06±0.19 300 mg/kg 77.99±0.4 1.28±0.07 8.98±0.11 19.88±0.10 6.45±0.07 22.20±0.20
p value ns ns ns ns ns ns
Intractions ns ns ns ns ns ns
1 see Table 1
and vitamin E interaction was significant for grower-finisher (p=0.02) and whole period (p=0.03).
FCR in the different treatment groups showed no significant differences (Table 5). The vitamin E effect on performance (BWG, FI, and FCR) was also not significant.
Advantages of dietary oil in broiler are: a) increasing the absorption and digestion of lipoproteins, b) lower heat increment of fat toward other energy sources such as carbohydrates or proteins, and c) also they assist vitamin A, vitamin E and Ca absorption (Leeson & Atteh, 1995). Rahimi et al. (2011) fed the day old Coob 500 broilers with different levels of full fat canola seed and / or flaxseed for 42 days. They showed that the use of full fat seed in the broiler diet has the lowering (p<0.01) effect on FI. This might be due to, in one hand, the higher fat content diet which reduces the digestion, absorption, and FA synthesis. On the other hand it increases rate of lipid catabolism (Sanz
et al., 2000). The results related to FCR in the current
study are similar to the findings of Viveros et al. (2009) and Burlikowska et al. (2010) indicating that dietary fat sources had no significant effect on performance parameters (BWG, FI, and FCR). However, Atteh & Leeson (1983) reported that saturation degree of a dietary fat can influence FI, BWG and FCR which results from better availability of energy from PUFA.
Oils with PUFA produce higher energy and upgrade the performance, because compared to oils that contain saturated fatty acids they are absorbed easier consequently, as explained by Dvorin et al. (1998), birds
fed on diet containing high levels of PUFA have better BWG. Moreover, digestion and absorption of dietary fat depend also on the age of the birds (Burlikowska et al.,
2010). The lack of the vitamin E effect on performance in the current study is similar to the findings of Coetzee & Hoffman (2001) and Hsieh et al. ( 2002). As in the current study all dietary treatments were isocaloric and isonitrogenous it seems that dietary vitamin E had no increasing effect on protein or energy utilization in the different treatments. It has been suggested that under commercial conditions, the inclusion of high level of dietary vitamin E is the most beneficial and significantly improved performance will occur more frequently where there is a challenge to the host’s defence system (McIlroy et al., 1993). The currrent study was performed in an experimental facility whith high level of hygienic principles. Total mortality during the whole experiment was below 2.5% for all treatments (p>0.05).
Some studies have shown that total fat content in tissues are reduced by increasing the dietary PUFA level (Cortinas et al., 2004; Shen et al., 2005). High rate of lipid metabolism and low FA synthesis are the reasons of low fat deposition (Sanz et al., 2000). These observations are inconsistent with the current results. There is also evidence that dietary PUFA level had no effect on the intramuscular lipid content of breast meat (Scaife et al., 1994; Crespo & Esteve-Garcia, 2002).
Fat deposition in the tissues is the result of absorption, de novo synthesis, and oxidation of fatty acids. Studies showed that dietary PUFA decreases hepatic lipogenesis and increases the metabolic rhythm, specifically causing a higher β-oxidation rate and inhibits de novo fatty acid synthesis (Shimomura et al., 1990; Sanz et al., 2000; Barroeta, 2007).
In the addition of vitamin E to the diet and the reduction of lipid oxidation, the following must be taken into consideration: vitamin E reduces linolenic acid (LNA; 18:3n-3) oxidation which leads to the reduction of lipogenesis and β-oxidation of FA in liver, which approximately reduces the total lipid deposition in tissues such as thigh and breast. But, in the present study there was no significant difference in the thigh and breast lipid level among experimental groups. Increases in the level of LNA in the body stimulates n-6 PUFA metabolism which affects n-6: n-3 ratio (Zanini
et al., 2003). Our findings showed that increases in
dietary rapeseed oil level decreased the n-6: n-3 ratio. FA composition of chicken tissues is a combination
of in vivo synthesis of FAs, from carbohydrate and
protein precursors, and direct deposition from the diet. SFA and MUFA have this double origin, whereas PUFA deposition depends almost exclusively on dietary supplementation when no essential FA deficiency exists. The main FAs resulting from hepatic lipogenesis are 16:0, 18:0, 18:1n-9 and 16:1n-7 (Villaverde et al., 2006). In the current study the FAs found in thigh
and breast meat (Table 7 and 8 respectively) reflected the dietary FA profile so that, increasing dietary PUFA inclusion led to higher deposition of PUFA, while it had the opposite effect on the deposition of SFA and MUFA which as described in literature, is due to an inverse relation between PUFA, SFA and MUFA deposition. Liver is where MUFA is synthesized. The presence of PUFAs in the diet leads to lower conversion of SFA into MUFA due to inhibitary effects of PUFAs on the activity of the enzyme Δ9-desaturase in the liver (Ajuyah et al., 1991; Lopez-Ferrer et al., 2001a,b; Villaverde et al.,
2006; Smink et al., 2010). The high concentration of
LA (18:2n-6) in the diet with only sunflower oil was
reflected in its significantly greater incorporation into thigh and breast muscle compared with the 100% rapeseed oil dietary group (p=0.001). Thigh meat in birds fed on diet containing the 100 % of replacement had the highest level of the LNA (p=0.001) and EPA (p=0.001). The breast meat level of the LNA (p=0.001), EPA (p=0.008), and DHA (p=0.001) were the most highest for the 100 % replacement in comparison to other groups. As it´s shown in Table 4, the relative proportions of thigh and breast incorporation of the mentioned FAs were almost similar to the dietary proportion of LNA, EPA, and DHA. The amount of the
ΣSFA was the highest both in thigh and breast meat of birds fed on diets containing only sunflower oil (0% replacing) and as it´s shown in Table 7 and 8 the ΣSFA amount was decreased by increasing the replacement rate of sunflower oil but the effect of vitamin E and it´s interaction with dietary oil were not significant for
ΣSFA. In contrast, thigh and breast muscle from birds that recieved only rapeseed oil, had a significantly higher (p=0.001) proportion of ΣPUFA n-3 compared to the group that recieved only sunflower oil. The n-6:n-3 ratio for thigh and breast muscle of 66.7 and 100 % replacing group was the lowest (p= 0.001) compared to other groups. Our findings are in agreement with other studies (Rahimi et al., 2011; Gallardo et al.,
2012). More recently Gallardo et al. (2012) fed the
broiler chickens with four diets containing 15% oil with different percentages of canola oil (0, 5, 10, 15%), for 31 days. They concluded that canola oil increased the content of n-9 and n-3 FAs and decreased the content of n-6 FAs in meat, fat and plasma.
Our findings also showed that the effect of dietary oil level, vitamin E and their interaction were significant for LNA level in both thigh (p= 0.001, 0.002, 0.002) and breast (p= 0.001, 0.001, 0.02). The effect of vitamin E and the vitamin E × oil interaction were also significant for n-6:n-3 ratio (Table 7 and 8). The effect of vitamin E on tissue FA profile is rather contradictory. Some authors reported a higher level of some n-3 PUFA in thighs (Ahn et al., 1995; Surai & Sparks,
2000) and breasts (Ajuyah et al., 1993; Zanini et al., 2003). Some researchers believe that vitamin E not only protects unsaturated FAs from oxidation, but also stimulates FA synthesis since α-tocopherol quinone, as a product of tocopherol metabolism, is an essential cofactor of the FA desaturases (Infante, 1999). More recently it has been shown that supplementation of vitamin E protected PUFA well, increasing DHA deposition in abdominal tissue (Lu et al., 2014). On
111
Ta
ş
delen EÖ, Ceylan N
Ef
fects of Dietary Inclusion of Oil Sources With or
Without Vitamin E on Body Composition and Meat
Oxidation Level in Broilers
Table 7 – Effects of dietary sunflower and rapeseed oil with or without vitamin E on FA profile of thigh meat (% of total FAs)1
Treatments2
Fatty acids2
C16:0 C18:0 C18:1 C18:2n-6 C18:3n-3 C20:5n-3 C22:5n-3 C22:6n-3 ∑SFA ΣMUFA ΣPUFA ΣPUFA n-6 ΣPUFA n-3 n-6:n-3
T1 15.39
±0.65 ±0.164.70 34.77±0.61 40.28±1.45 ±0.020.81e
0.007
±0.007 ±0.0100.01 ±0.010.01 20.93±0.80 37.93±0.68 41.13±1.48 40.28±1.45 ±0.030.85
47.22 ±1.29a
T2 14.04
±0.22 ±0.295.06 42.82±0.31 40.55±1.77 ±0.061.37d
0.02
±0.007 ±0.0060.03 ±0.0020.03 20.06±0.35 45.11±0.63 42.01±1.84 40.55±1.77 ±0.061.46
27.73 ±0.32b
T3 13.55
±0.81 ±0.144.62 35.66±0.47 37.50±0.88 ±0.061.92c
0.01
±0.009 ±0.0070.04 ±0.010.02 19.27±0.89 37.94±0.69 39.50±0.94 37.50±0.88 ±0.062.00
18.72 ±0.28c
T4 12.13
±0.26 ±0.103.81 42.65±0.33 39.56±0.88 ±0.062.14c
0.02
±0.01 ±0.0150.06 ±0.160.20 17.18±0.39 44.65±0.36 42.00±1.09 39.56±0.88 ±0.242.43
16.60 ±1.18c
T5 14.12
±0.92 ±0.405.00 38.16±0.62 32.00±1.23 ±0.153.46b
0.04
±0.01 ±0.0130.07 ±0.010.02 19.90±1.34 40.43±0.92 35.60±1.39 32.00±1.23 ±0.183.60
8.9 ±0.22d
T6 12.64
±0.49 ±0.0064.45 48.38±0.24 33.98±0.47 ±0.103.36b
0.04
±0.01 ±0.0130.10 ±0.0080.07 18.05±0.47 50.80±0.32 37.57±0.37 33.98±0.47 ±0.113.59 ±0.549.50de
T7 12.26
±0.16 ±0.154.37 38.01±0.24 26.97±0.18 ±0.054.81a
0.07
±0.012 ±0.0200.09 ±0.010.06 17.79±0.30 40.10±0.50 32.01±0.27 26.97±0.18 ±0.095.04
5.35 ±0.06e
T8 12.18
±0.34 ±0.214.05 48.29±0.20 26.91±0.30 ±0.114.94a
0.06
±0.01 ±0.0110.08 ±0.010.06 17.48±0.52 50.41±0.31 32.08±0.23 26.91±0.30 ±0.135.16
5.23 ±0.17e
p-value ns ns ns ns 0.07 ns ns ns ns ns ns ns ns ns
Main effects Oil replacement level
0% 14.75 ±0.57a 4.85 ±0.21a 35.22 ±0.39d 40.41 ±1.06a 1.09 ±0.11d 0.01 ±0.005b 0.02
±0.006 ±0.0060.02 ±0.7520.41a
37.941 ±0.45d 41.57 ±1.10a 40.41 ±1.06a 1.15 ±0.12d 37.48 ±3.73a 33.3% 13.3 4±0.36ab 4.75 ±0.18a 38.09 ±0.30c 38.52 ±0.70a 2.03 ±0.06c 0.02 ±0.009b 0.05
±0.009 ±0.080.11 ±0.4619.05ab
40.270 ±0.49c 40.74 ±0.81a 38.53 ±0.70a 2.22 ±0.14c 17.65 ±0.68b 66.7% 12.90 ±0.45b 4.50 ±0.10ab 42.73 ±0.21b 33.00 ±0.71b 3.41 ±0.08b 0.04 ±0.008ab 0.09
±0.01 ±0.010.04 ±0.5118.53ab
44.886 ±0.35b 36.59 ±0.76b 32.99 ±0.71b 3.59 ±0.10b 9.20 ±0.26c 100% 12.16 ±0.20b 3.93 ±0.11b 48.34 ±0.14a 26.94 ±0.16c 4.87 ±0.06a 0.06 ±0.008a 0.09
±0.01 ±0.0080.06 ±0.317.3b
50.609 ±0.22a 32.04 ±0.16c 26.94 ±0.16c 5.10 ±0.08a 5.29 ±0.09d
p-value 0.002 0.003 0.001 0.001 0.001 0.001 ns ns 0.006 0.001 0.001 0.001 0.001 0.001
Vitamin E
0 mg/kg 13.77
±0.38a
4.55
±0.14 41.04±1.34 34.18±1.40 ±0.392.75 ±0.0080.03 ±0.0090.05 ±0.0070.03 19.36±0.46 43.57±1.30 37.06±1.04 34.18±1.40
2.87 ±0.41a
20.05 ±4.25
300 mg/kg 12.80
±0.32b
4.47
±0.14 41.16±1.26 35.25±1.47 ±0.352.95 ±0.0070.04 ±0.0080.07 ±0.040.09 18.30±0.42 43.28±1.25 38.42±1.16 ±1.47035.25
3.16 ±0.36b
14.77 ±2.22
p-value 0.03 ns ns ns 0.002 ns ns ns ns ns ns ns 0.005 0.001
Intractions ns ns ns ns 0.002 ns ns ns ns ns ns ns ns 0.001
1 see Table 1
2ΣSFA=total saturated fatty acids; ΣMUFA=total monounsaturated fatty acids; ΣPUFA=total polyunsaturated fatty acids.
112
Ef
fects of Dietary Inclusion of Oil Sources With or
Without Vitamin E on Body Composition and Meat
Oxidation Level in Broilers
Table 8 – Effects of dietary sunflower and rapeseed oil with or without vitamin E on FA profile of breast meat (% of total FAs)
Treatments1
Fatty acids2
C16:0 C18:0 C18:1 C18:2n-6 C18:3n-3 C20:5n-3 C22:5n-3 C22:6n-3 ∑SFA ΣMUFA ΣPUFA ΣPUFA n-6 ΣPUFA n-3 n-6:n-3
T1 15.50 ±0.61 4.82 ±0.14 34.74 ±0.61 40.07 ±1.36 0.83 ±0.03e 0.00 ±0.00 0.02 ±0.009 0.02 ±0.009 21.21 ±0.68 37.83 ±0.71 40.96 ±1.40 40.07 ±1.36 0.88 ±0.04 45.32 ±1.04a T2 14.33 ±0.82 5.03 ±0.33 35.97 ±0.20 39.97 ±1.33 1.42 ±0.10d 0.007 ±0.007 0.04 ±0.002 0.03 ±0.004 20.25 ±1.13 38.28 ±0.41 41.48 ±1.43 39.97 ±1.33 1.51 ±0.09 26.55 ±0.93b T3 14.15 ±0.15 5.12 ±0.26 38.15 ±0.71 37.23 ±0.88 1.96 ±0.06c 0.02 ±0.008 0.04 ±0.002 0.03 ±0.01 20.26 ±0.27 40.43 ±1.01 39.30 ±0.929 37.23 ±0.88 2.07 ±0.07 17.99 ±0.56c T4 12.60 ±0.20 4.63 ±0.12 37.91 ±0.26 39.66 ±0.48 2.17 ±0.04f 0.08 ±0.06 0.04 ±0.01 0.03 ±0.01 18.22 ±0.33 39.78 ±0.25 41.99 ±0.51 39.66 ±0.48 2.33 ±0.05 17.04 ±0.34c T5 13.53 ±0.61 4.68 ±0.11 42.35 ±0.13 32.54 ±0.57 3.39 ±0.17b 0.05 ±0.01 0.07 ±0.01 0.05 ±0.02 19.30 ±0.67 44.57 ±0.20 36.12 ±0.72 32.54 ±0.57 3.57 ±0.21 9.19 ±0.50d T6 12.34 ±0.14 4.41 ±0.11 42.90 ±0.07 33.50 ±0.25 3.41 ±0.03b 0.06 ±0.01 0.09 ±0.007 0.08 ±0.01 17.87 ±0.16 44.96 ±0.10 37.15 ±0.23 33.50 ±0.25 3.65 ±0.02 9.16 ±0.11d T7 12.42 ±0.22 3.84 ±0.07 48.24 ±0.34 26.85 ±0.39 4.62 ±0.03a 0.13 ±0.05 0.17 ±0.07 0.04 ±0.01 17.54 ±0.20 50.87 ±0.42 31.83 ±0.35 26.85 ±0.39 4.98 ±0.12 5.40 ±0.18e T8 12.75 ±0.16 4.11 ±0.22 48.29 ±0.22 26.22 ±0.29 4.84 ±0.10a 0.08 ±0.01 0.10 ±0.007 0.06 ±0.004 18.09 ±0.37 50.57 ±0.45 31.32 ±0.23 26.22 ±0.29 5.09 ±0.12 5.15 ±0.16e
p-value ns ns ns ns 0.001 ns ns ns ns ns ns ns ns 0.989
Main effects Oil replacement level
0% 14.91 ±0.52a 4.92 ±0.17a 35.36 ±0.37d 40.02 ±0.88a 1.13 ±0.12d 0.03 ±0.003b 0.03 ±0.005b 0.03 ±0.005b 20.73 ±0.39a 38.06 ±0.39d 41.22 ±0.93a 40.02 ±0.88a 1.20 ±0.12d 35.94 ±3.60a 33.3% 13.38 ±0.31b 4.88 ±0.16a 38.03 ±0.35c 38.44 ±0.65a 2.07 ±0.05c 0.05 ±0.03b 0.04 ±0.008b 0.03 ±0.007b 19.24 ±0.49ab 40.10 ±0.49c 40.65 ±0.70a 38.44 ±0.65a 2.20 ±0.065c 17.52 ±0.35a 66.7% 12.9 3±0.36b 4.55 ±0.08a 42.63 ±0.12b 33.02 ±0.34b 3.40 ±0.08b 0.06 ±0.008b 0.08 ±0.009ab 0.06 ±0.01a 18.58 ±0.12b 44.76 ±0.12b 36.64 ±0.40b 33.02 ±0.34b 3.61 ±0.10b 9.18 ±0.24c 100% 12.58 ±0.14b 3.97 ±0.12b 48.27 ±0.19a 26.53 ±0.25c 4.73 ±0.06 a
0.11 ±0.02a 0.13 ±0.03a 0.05 ±0.008a 17.82 ±0.29b 50.72 ±0.29a 31.57 ±0.21c 26.53 ±0.25c 5.03 ±0.08a 5.28 ±0.12d
p-value 0.001 0.001 0.001 0.001 0.001 0.008 0.008 0.001 0.001 0.001 0.001 0.001 0.001 0.001
Vitamin E
0 mg/kg 13.90
±0.35 4.62±0.14 40.88 ±1.32 34.18 ±1.35 2.70 ±0.37 0.05 ±0.01 0.08 ±0.022 0.04 ±0.007a 19.58 ±0.41a 43.43 ±1.31 37.05 ±0.99 34.18 ±1.35 2.87 ±0.40b 19.48 ±4.040
300 mg/kg 13.00
±0.28 4.54±0.13 41.27 ±1.24 34.84 ±1.48 2.96 ±0.33 0.06 ±0.01 0.07 ±0.008 0.05 ±0.006b 18.60 ±0.37b 43.40 ±1.26 37.99 ±1.16 34.84 ±1.48 3.14 ±0.35a 14.48 ±2.12
p-value ns ns ns ns 0.001 ns ns 0.034 0.034 ns ns ns 0.001 0.001
Intractions ns ns ns ns 0.02 ns ns ns ns ns ns ns ns 0.001
1 see Table 1
2ΣSFA=total saturated fatty acids; ΣMUFA=total monounsaturated fatty acids; ΣPUFA=total polyunsaturated fatty acids.
113
Taşdelen EÖ, Ceylan N Effects of Dietary Inclusion of Oil Sources With or
Without Vitamin E on Body Composition and Meat Oxidation Level in Broilers
FA composition of chicken thighs when broiler diets were supplemented with vitamin E (Hsieh et al., 2002; Cortinas et al., 2004). For exmaple Hsieh et al. (2002)
fed the chicks with MUFA / SFA ratio of 1.2 or 4.8 and supplemented with 0, 10 or 20 mg vitamin E kg−1 for 3
weeks. The ∑SFA, ∑MUFA, and ∑PUFA contents in heart, liver, and breast muscle were not affected by dietary vitamin E level. In most studies, results are expressed as percentages (area normalization), which makes comparison of the results difficult. It is necessary to mention that in the current study FAs were quantified based on internal standard to avoid the inaccuracy associated with area normalization (Cortinas et al.,
2004). Dietary polyunsaturation level can affect the fat deposit of the body, there is a difference in lipid digestion between non-ruminant and ruminant animals which has an important effect on transference of fats from the diet into the tissue. Broilers fed by diet containing polyunsaturated fats have lower fat deposition in contrast to the diet containing saturated fats. The reason has been explained to be due to higher rate of lipid catabolism and lower FA synthesis (Sanz et al., 2000; Woods & Fearon, 2009). Similar
results have been obtained in a study on rats as they
showed significantly lower metabolic oxidation of lipids which resulted in lower thermogenesis in tissues of rats fed on saturated fats (Shimomura et al., 1990).
In intramuscular fat FA is one of the main components of cellular membrane. As for cells, to ensure the fluidity and permeability of different compounds, they have to maintain their physical chacterictics of the cell membrain. As a result, modification of FA composition of intramuscular fat has been reported to be limited (Lopez-Bote et al., 1997).
The TBARS level (mg malonaldehyde/100g tissue) was detected in the thigh and breast meat throughout the 1, 3, 6, and 9 days of storage (Table 9). Thigh and breast muscle from birds fed without vitamin E displayed an increased susceptibility to lipid peroxidation in vitro,
as expected, 100 % rapeseed oil supplementation without vitamin E has the greatest impact (p<0.01) on elevating malonaldehyde production. However, the dietary combination of oil and vitamin E at 300 mg/kg markedly (p=0.001) decreased the susceptibility. These findings indicate that dietary inclusion of vitamin E can be an effective way to increase stability of n-3 PUFA enriched broilers meat across the oxidative damage. Surai & Sparks (2000; in different tissues of cockerels
Table 9 – Effects of dietary sunflower and rapeseed oil with or without vitamin E on TBARS level of the thigh and breast
meat (mg malonaldehyde/100g tissue)1
Treatments2
Thigh muscle TBRS level Breast muscle TBRS level
day 1 day 3 day 6 day 9 day 1 day 3 day 6 day 9
T1 1.05±0.02 1.13±0.02d 2.16±0.03 3.54±0.02 0.95±0.01 1.03±0.019d 1.87±0.14 3.41±0.03b
T2 0.89±0.02 0.99±0.01e 2.36±0.46 3.08±0.05 0.83±0.01 0.89±0.03e 1.79±0.03 3.04±0.04d
T3 1.03±0.01 1.26±0.037bc 2.08±0.073 3.58±0.03 0.97±0.02 1.15±0.01bc 2.10±0.03 3.52±0.01ab
T4 0.93±0.00 1.13±0.02d 1.87±0.04 2.96±0.03 0.83±0.01 1.05±0.03cd 1.79±0.03 2.90±0.07d
T5 1.07±0.01 1.38±0.01a 2.20±0.04 3.68±0.04 0.93±0.03 1.44±0.02a 2.12±0.03 3.58±0.04a
T6 0.99±0.01 1.22±0.01c 1.85±0.03 3.00±0.05 0.87±0.08 1.18±0.01b 1.81±0.03 2.90±0.03d
T7 1.15±0.07 1.32±0.03ab 2.51±0.05 3.47±0.10 1.15±0.01 1.22±0.01b 2.16±0.15 3.21±0.01c
T8 1.03±0.09 1.34±0.03ab 2.06±0.09 3.04±0.05 1.01±0.01 1.34±0.01a 2.14±0.03 2.98±0.03d
p-value ns 0.001 ns ns ns 0.001 ns 0.01
Main effects Oil replacement level
0% 0.97±0.03b 1.06±0.02 c 2.26±0.21 3.31±0.09 0.89±0.02b 0.96±0.03c 1.83±0.06b 3.22±0.07ab
33.3% 0.98±0.020b 1.19±0.03 b 1.97±0.05 3.27±0.12 0.90±0.02b 1.10±0.02b 1.95±0.06ab 3.21±0.12ab
66.7% 1.03±0.019ab 1.30±0.03 ab 2.02±0.07 3.34±0.13 0.90±0.02b 1.31±0.04a 1.96±0.06ab 3.24±0.13a
100% 1.09±0.059a 1.33±0.02 a 2.29±0.09 3.25±0.09 1.08±0.04a 1.28±0.02a 2.15±0.07a 3.10±0.04b
p-value 0.04 0.001 ns ns 0.001 0.001 0.002 0.002
Vitamin E
0 mg/kg 1.07±0.021a 1.27±0.02a 2.24±0.04 3.57±0.03a 1.00±0.02a 1.21±0.03a 2.06±0.05a 3.43±0.03a
300 mg/kg 0.96±0.025b 1.17±0.03b 2.03±0.11 3.02±0.02b 0.89±0.02b 1.12±0.04b 1.88±0.04b 2.95±0.02b
p-value 0.001 0.001 ns 0.001 0.001 0.001 0.001 0.001
Intractions ns 0.01 ns ns ns 0.001 ns 0.001
1 Approximate scales forInterpretation of TBRS values in meat: ≤ 0.2 Good quality ; 0.2 – 0.5 Limited and tolerable ; 0.5 – 1.5 Somewhat oxidized ; 1.5 – 5 Oxidized ; ≥ 5 Rancid
(Frigg, 1992)
2 see Table 1
fed on diet containing PUFA) and Golzar Adabi et al. (2013; in stored egg yolk of different avian species) showed that concentration of tissues α-tocopherol was decreased markedly by PUFA inclusion and storage respectively. The currrent findings corroborate with previous reports (Cortinas et al., 2005; Rahimi et al., 2011). Such effect is a consequence of the higher PUFA content in meat from unsaturated diets because of the TBARS production is mainly increased with the peroxidation of FA with more than two double bonds (Cortinas et al., 2004, 2005, Rahimi et al., 2011).
The results of oxidative stability of thigh and breast muscle show that oxidation of these tissues increased by increasing the length of storage time, which is in agreement with other findings (Zanini et al., 2006; Rahimi et al., 2011).
The sensory evaluation for the thigh and breast meat showed no significant differences among the treatments when it came to olfactory, texture, and taste (data not shown). In contrast to our data, some studies showed that dietary inclusion of fish oil or other n-3 PUFAs sources such as linseed have adverse effect on sensory quality (Gonzalez-Esquerra & Leeson, 2000 a,b). One reason of showing contradictory results is related to the perception of fishy off-flavors or odour changes from one country to another for example Lopez-Ferrer et al. (2001a) did not find significant differences up to 4% fish oil supplementation.
It can be concluded that the pattern of FA deposition in muscle tissues can be manipulated by changing the FA composition in the diet; because composition and concentration of carcass lipid is significantly affected by lipid type and origin in the diet. In general, the rate and extent of lipid oxidation in muscle can be influenced by the dietary fat type and level, FAs profile of dietary oil, and level of dietary antioxidant. On the other hand, n-3 PUFA increases meat oxidation susceptibility. By adding vitamin E (300 mg/kg/day dry matter) to the diet, lipid oxidation can be significantly reduced.
CONFLICT OF INTEREST
Authors have no conflicts of interest to declare whatsoever.
REFERENCES
Ahn DU, Wolfe FH, Sim JS. Dietary α-linolenic acid and mixed tocopherols, and packaging influences on lipid stability in broiler chicken breast and leg muscle. Journal of Food Science 1995;60:1013-1018.
Ajuyah AO, Hardin RT, Sim JS. Dietary antioxidant and storage affect chemical characteristics of ω-3 fatty acid enriched broiler chicken meats. Journal of Food Science 1993;58:43-46.
Ajuyah AO, Lee KH, Hardın RT, Sim JS. Changes in the yield and in the fatty acid composition of whole carcass and selected meat portions of broiler chickens fed full-fat oil seeds. Poultry Science 1991;70:2304–2314.
AOAC. Official method of analysis. 17th ed. Washington: Association of Official Analytical Chemists; 2000.
Atteh JO, Leeson S. Effects of dietary fatty acids and calcium levels on performance and mineral metabolism of broiler chickens. Poultry Science 1983;62:2412-2419.
Barroeta AC. Nutritive value of poultry meat:relationship between vitamin E and PUFA. Worlds Poultry Science Journal 2007;63:277-284.
Blight EG, Dyer WJ. A rapid method for total lipid exraction and purification. Canadian Journal of Biochemitry and Physiology 1959;37:902-911.
Burlikowska K, Piotrowska A, Szymeczko R. Effect of dietary fat type on performance, biochemical indices and fatty acids profile in the blood serum of broiler chickens. Journal of Animal and Feed Sciences 2010;19:440–451.
Coetzee GJM, Hoffman LC. Effect of dietary vitamin E on the performance of broilers and quality of broiler meat during refrigerated and frozen storage. South African Journal of Animal Science 2001;31(3):158-173.
Cortinas L, Villaverde C, Galobart J, Baucells MD, Codony R, Barroeta AC. Fatty acid content in chicken thigh and breast as affected by dietary polyunsaturation level. Poultry Science 2004;83(7):1155–1164.
Cortinas L, Barroeta A, Villaverde C, Galobart J, Guardiola F, Baucells MD. Influence of the dietary polyunsaturation level on chicken meat quality:lipid oxidation. Poultry Science 2005;84(1):48–55.
Crespo N, Esteve-Garcia E. Nutrient and fatty acid deposition in broilers fed different dietary fatty acid profiles. Poultry Science 2002;81(10):1533– 1542.
Dvorin A, Zoref Z, Mokady S, Nitsan Z. Nutritional aspects of hidrogenated and regular soybean oil added to diets of broiler chicks. Poultry Science 1998;77(6):820-825.
Gallardo MA, Pérez DD, Leighton FM. Modification of fatty acid composition in broiler chickens fed canola oil. Biological Research 2012;45(2):149-161.
Golzar Adabi SH, Ahbab M, Fani AR, Hajbabaei A, Ceylan N, Cooper RG. Egg yolk fatty acid profile of avian species-influence on human nutrition. Journal of Animal Physiology and Animal Nutrition 2013;97(1):27–38.
Gonzalez-Esquerra R, Leeson S. Alternatives for enrichment of eggs and chicken meat with omega-3 fatty acids. Canadian Journal Animal Science 2000a;81:295-305.
Gonzalez-Esquerra R, Leeson S. Affects of menhaden oil and flaxseed in broiler diets on sensory quality and lipid composition of poultry meat. British Poultry Science 2000b;41:481-488.
Haug A, Christophersen OA, Sogn T. Chicken meat rich in selenium and omega-3 fatty acids, and human health. Open Agricultural Journal 2011;5:30–36.
Hsieh HF, Chiang SH, Lu MY. Effect of dietary monounsaturated/saturated fatty acid ratio on fatty acid composition and oxidative stability of tissues in broilers. Animal Feed Science and Technology 2002;95(3– 4):189–204.
Hugo A, Els SPC, Bothma FH, Witt DE, van der Merwe HJ, Fair MD. Influence of dietary lipid sources on sensory characteristics of broiler meat. South African Journal of Animal Science 2009;39:11-14.
115
Taşdelen EÖ, Ceylan N Effects of Dietary Inclusion of Oil Sources With or
Without Vitamin E on Body Composition and Meat Oxidation Level in Broilers
Janssens G, Cheetham V, Fitt T, Taylor A. Effect of dietary vitamin E on consumer acceptance of fresh poultry meat. Proceedings of the 14th European Symposium on the Quality of Poultry Meat; 1999 Sept 19-23; Bologna. Italy;1999.
Leeson S, Atteh JO. Utilization of fats and fatty acids by turkey poults. Poultry Science 1995;74:2003-2010.
Lopez-Bote CJ, Rey AI, Sanz M, Gray JI, Buckley DJ. Dietary vegetable oils and α-tocopherol reduce lipid oxidation in rabbit muscle. Journal of Nutrition 1997;127:1176–1182.
Lopez-Ferrer M, Baucells MD, Barroeta AC, Grashornt MA. N-3 enrichment of chicken meat. 1. Use of very long-chain fatty acids in chicken diets and their influence on meat quality:Fish oil. Poultry Science 2001a;80(6):741-752.
Lopez-Ferrer S, Baucells MD, Barroeta AC, Galobart J, Grashorn MA. n-3 enrichment of chicken meat. 2. Use of precursors of long-chain polyunsaturated fatty acids:linseed oil. Poultry Science 2001b;80:753– 761.
Mazalli MR, Faria DE, Salvador D, Ito DT. A comparison of the feeding value of different sources of fat for laying hens:2. lipid, cholesterol, and vitamin E profiles of egg yolk. Journal of Applied Poultry Research. 2004;13(2):280-290.
McIlroy SG, Goodall EA, Rice DA, McNultyMS, Kennedy DG. Improved performance in commercial flocks with subclinical infectious bursal disease when fed diets containing increased concentrations of vitamin E. Avian Pathology 1993;22(1):81-94.
Miller D, Robisch P. Comparative effect of herring menheden and safflower oils on broiler tissues fatty acid composition and flavor. Poultry Science 1969;48(6):2146-2157.
Molendi-Coste O, Legry V, Leclercq IA. Why and how meet n-3 PUFA dietary recommendations? Gastroenterology Research & Practice; 2011. doi:10.1155/2011/364040.
Newman RE, Bryden WL, Fleck E, Ashes JR, Buttemer WA, Storlien LH. Dietary n-3 and n-6 fatty acids alter avian metabolism:metabolism and abdominal fat deposition. British Journal Nutrition 2002;88(1):11-18
NRC. Nutrient requirements of poultry. 9th revised ed. Washington: National
Academy Press; 1994.
Nyquist NF, Rødbotten R, Thomassen M, Haug A. Chicken meat nutritional value when feeding red palm oil, palm oil or rendered animal fat in combinations with linseed oil, rapeseed oil and two levels of selenium. Lipids in Health and Disease 2013;12:69-82.
Rahimi S, Kamran Azad S, Karimi Torshizi MA. Omega-3 enrichment of broiler meat by using two oil seeds. Journal of agricultural science and technology2011;13:353-365.
Roux S, Petit M, Baeza E, Bastianelli D, Tillard E, Arnaud E. Effect of a flax seeds diet on lipid oxidation of raw and cooked chicken meat. Proceeding of the 20th European Symposium on the Quality of Poultry Meat; 2011 Sept 4-8; Leipzig. Germany; 2011. C-067.
Sanz M, Lopez-Bote CJ, Menoyo D, Bautista JM. Abdominal fat deposition and fatty acid synthesis are lower and β-oxidation is higher in broiler chickens fed diets containing unsaturated rather than saturated fat. Journal of Nutrition 2000;130:3034–3037.
SAS Institute. SAS user’s uuide: statistics. Release 9.2. Cary: SAS Institute;2001.
Scaife JR, Moyo J, Galbraith H, Michie W, Campbell V. Effect of different dietary supplemental fats and oils on the tissue fatty acid composition
and growth of female broilers. British Poultry Science 1994;35:107– 118.
Shen Y, Feng D, Fan MZ, Chavez ER. Performance, carcass cut-up and fatty acids deposition in broilers fed different levels of pellet-processed flaxseed. Journal of the Science of Food and Agriculture 2005;85:2005– 2014.
Shimomura Y, Tamura T, Suzuki M. Less body fat accumulation in rats fed a safflower oil diet than in rats fed a beef tallow diet. Journal of Nutrition 1990;120:1291–1296.
Simopoulos AP. Human requirement for n-3 polyunsaturated fatty acids. Poultry Science 2000;79:961–70.
Simopoulos AP. The importance of the omega-6/omega-3 fatty acid ratio in cardiovascular disease and other chronic diseases. Experimental Biology and Medicine 2008;233:674-688.
Smink W, Gerrits WJJ, Hovenier R, Geelen MJH, Verstegen MWA, Beynen AC. Effect of dietary fat sources on fatty acid deposition and lipid metabolism in broiler chickens. Poultry Science 2010;89(11):2432– 2440.
Steel RGD, Torrie JH. Principles and procedures of statistics. New York: McGraw-Hill; 1960.
Srinivassane S. Development and evaluation of omega-3 fatty acids enriched chicken frankfurters [thesis]. Halifax: Dalhousie University; 2011. p.113.
Surai PF, Sparks NHC. Tissue-specific fatty acid and α-tocopherol profiles in male chickens depending on dietary tuna oil and vitamin E provision. Poultry Science 2000;79:1132–1142.
Tarladgis BG, Watts BM, Younathan MT, Dugan Jr. A distilattion method for quantitative determination of malonaldehyde in rancid foods. Journal of American Oil Chemist’s Society 1960;37:44-48.
Villaverde C, Baucells MD, Cortinas L, Barroeta AC. Effect of dietary concentration and degree of polyunsaturation of dietary fat on endogenous synthesis and deposition of fatty acids in chickens. British Poultry Science 2006;47(2):173–179.
Viveros A, Ortiz LT, Rodríguez ML, Rebolé A, Alzueta C, Arija I, et al.
Interaction of dietary high-oleic-acid sunflower hulls and different fat sources in broiler chickens. Poultry Science 2009;88:141-151.
Woods VB, Fearon AM. Dietary sources of unsaturated fatty acids for animals and their transfer into meat, milk and eggs: a review. Livestock Science 2009;126:1-20.
WPSA - World Poultry Science Association. The prediction of apparent metabolizable energy values for poultry in compound feeds. World Poultry Science Journal 1984;40:181–182.
Zanini SF, Torres CAA, Bragagnolo N, Turatti JM, Silva MG, Zanini MS. Lipid composition and vitamin E concentration in cockerel meat. Lebensm.-Wiss. Technology Journal 2003;36:697–702.
Zanini SF, Colnago GL, Bastos MR, Pessotti BMS, Casagrande FP, Lima VR. Oxidative stability and total lipids on thigh and breast meat of broilers fed diets with two fat sources and supplemented with conjugated linoleic acid. LWT- Food Science and Technology 2006;39:717-723.