ABSTRACT
RESUMO
Crescimento, produção e tamanho de grãos de café decorrentes de doses de N e K
em solução nutritiva
O suprimento adequado de nutrientes ao cafeeiro é essencial para obtenção de alta produtividade. O objetivo deste trabalho foi avaliar o efeito do nitrogênio, do potássio e da relação N:K no crescimento vegetativo e reprodutivo do cafeeiro. Para isto, plantas de café receberam solução nutritiva, contendo K nas concentrações de 1,08; 2,15; 3,23 e 5,38 mmol L-1, combinadas com a dose de 6 mmol L-1 de N, obtendo-se as relações N:K (p/p):1,0:0,5; 1,0:1,0; 1,0:1,5; 1,0:2,5. O tratamento controle continha as doses de 3 e 1,61 mmol L-1 de N e K, respectivamente, resultando na relação N:K (p/ p) de 1,0:1,5. Avaliaram-se a altura, o diâmetro do caule, número de nós do oitavo ramo plagiotrópico (ramo índice), o número de pares de ramos plagiotrópicos e o número de nós do ramo ortotrópico a cada três semanas após o início do experimento. Realizaram-se também análises da composição química dos grãos beneficiados e folhas, no período entre a floração e expansão rápida dos frutos, produção de café cereja por planta e classificação dos grãos quanto ao tamanho. O N influenciou principalmente as características de crescimento vegetativo e o K influenciou principalmente as características de crescimento reprodutivo, avaliadas pela produção. A menor produção resultou em percentagens mais elevadas de grãos retidos nas peneiras com crivos maiores que 16/64 polegadas, enquanto a maior produção promoveu aumento na percentagem de grãos retidos nas peneiras com crivos menores que 16/64 polegadas.
Palavras-chave: crescimento, produção, Coffea.
Received: 29/12/2011; Accepted: 08/02/2013.
1 Agronomist Engineer, Master of Science. Departamento de Fitotecnia, Universidade Federal de Viçosa, Campus de Viçosa, Avenida Peter Henry Rolfs, s/n, 36570-000, Viçosa,
Minas Gerais, Brasil. [email protected] (corresponding author).
2 Agronomist Engineer, Doctor of Science. Departamento de Fitotecnia, Universidade Federal de Viçosa, Campus de Viçosa, Avenida Peter Henry Rolfs, s/n, 36570-000, Viçosa,
Minas Gerais, Brasil. [email protected]
3 Agronomist Engineers. Departamento de Fitotecnia, Universidade Federal de Viçosa, Campus de Viçosa, Avenida Peter Henry Rolfs, s/n, 36570-000, Viçosa, Minas Gerais, Brasil.
[email protected]; [email protected]
Junia Maria Clemente1, Herminia Emilia Prieto Martinez2, Leonardo Corrêa Alves3, Marcelo César Rosa Lara3
Effect of N and K doses in nutritive solution on growth, production
and coffee bean size
An adequate supply of nutrients is essential for obtaining high yields of coffee. The objective of this study was to evaluate the effect of N, K and the N:K ratio on vegetative and reproductive growth of coffee. For this purpose, coffee plants were grown in nutrient solution containing K in the concentrations of 1.08; 2.15; 3.23 and 5.38 mmol L-1 combined with a dose of 6 mmol L-1 N, resulting in the N:K ratios (w/w): 1:0.5; 1:1; 1:1.5 and 1:2.5. The control treatment consisted of the doses 3 and 1.61 mmol L-1 of N and K respectively, resulting in the N:K ratio (w/w) 1.0:1.5. The following variables were evaluated: height, stem diameter, number of nodes of the eighth plagiotrofic branch (index branch), pairs of plagiotrofic branches and number of nodes in the orthotropic branch every three weeks from the beginning of the experiment. Additionally, it was evaluated the chemical composition of processed beans and leaves between the flowering and the rapid expansion stage of the cherry beans, production of cherry beans per plant and classification of beans according to the size. N influenced mainly the characteristics of vegetative growth and K influenced mainly the reproductive growth evaluated by the production. The lowest production resulted in the highest percentages of beans retained on sieves with holes larger than 16/64", while the highest production promoted an increase in the percentage of beans retained on sieves with holes smaller than 16/64".
INTRODUCTION
Nitrogen fertilization is essential in view of the low productivity of the Brazilian coffee plantations and, moreover, N is the most required nutrient for vegetative growth and the second most exported to beans (Catani & Moraes, 1958). It is often considered that the requirements of K are equivalent to those of N, although the highest proportion of K is found in the beans, particularly in the pulp, unlike for N (Carneiro, 1995).
An adequate nitrogen supply provides increased branching of plagiotropic branches, greater leaf area, higher production of starch and other carbohydrates essential for the formation and growth of beans (Guima-rães & Mendes, 1997), while K plays an important role in the formation of beans, acting in photoassimilate transport in the phloem (Marschner, 2012). The deposition of biomass in the bean is necessarily accompanied by the accumulation of K. Furthermore, K is a required nutrient in the activation of several enzymes essential for synthesis of organic compounds, including starch (Marschner, 2012). In this sense, the importance of balance between these nutrients has been highlighted by Rosolem (2005), who reports that when the potassium fertilization is neglected, in general, crops respond to N rates with much smaller increases in productivity.
Neves et al. (2006) studied the effect of two levels of
NPK fertilization on the productivity and accumulation of N and K in leaves of different varieties of coffee conducted in the dense production system and found N: K ratios (w/ w-weight/weight) of 2.36 and 1.51 at 31 and 55 months of cultivation, indicating that the requirements of N are greater than those of K. The excess N causes changes in the ratios N:P and N:K of the leaves and decreased production, stimulating preferably vegetative growth (Malavolta, 1986). Also, according to Malavolta (1993), the adequate N:P ratio in leaves is in the range 16-18; N:K in the range 1.3-1.4 and N:S in the range 16-18.
The nitrogen and potassium nutrition can influence the production of large or small coffee beans, which is also influenced by varietal characteristics, climatic and sanitary conditions. The severe deficiency of K can cause branch die-back, formation of small or withered beans and pinhead drop (Malavolta, 1993).
The bean size uniformity ensures a more evenly roast, avoiding the formation of over-roasted or carbonized beans (Severino et al. 2001). Regarding management
practices, it is expected that the levels of N, K and the N:K ratio are important for proper vegetative development of the plant as well as for the size and yield of coffee beans. This study aimed to evaluate the effect of N, K and N:K ratios on vegetative growth, initial production and physical characteristics of the processed coffee beans.
MATERIAL AND METHODS
The experiment was conducted in a sub-irrigation hydroponic system installed in a greenhouse at Universi-dade Federal de Viçosa, from September 2006 to July 2009. The treatments consisted of four N:K ratios in the nutrient solution with a single concentration of N and different concentrations of K, plus a control treatment with a lower concentration of N.
Coffee seedlings of the variety Catuaí Vermelho IAC 99 germinated in conventional substrate and with a pair of true leaves were grown in corrugated roofing sheets, 3.75 m long and 0.85 m wide at the top, 0,60 m wide at the base and 0.20 m in height, the ends closed, sealed and filled with expanded clay of 8 to 13 mm in diameter to a height of 0.17 m from the base. The expe-rimental plot consisted of eight plants spaced 0.4 m apart, and the six central plants were considered as the useful plot.
The concentrations 1.08, 2.15, 3.23 and 5.38 mmol L-1 of K were combined with a dose of 6 mmol L-1 of N to yield the N:K ratios (w/w) of 1.0:0.5; 1.0:1.0; 1.0:1.5; and 1.0:2.5. The control treatment was according to Moura et al. (2007): 3
mmol L-1 N and 1.61 mmol L-1 K, resulting in the ratio N: K (w/w) of 1.0:1.5. The sources of N and K were calcium nitrate, potassium nitrate and potassium dihydrogen phosphate, respectively.
The other nutrients were supplied by a half-strength Steiner nutrient solution (Steiner, 1984) that contained: 0.5 mmol L-1 P, 2.25 mmol L-1 Ca, 1 mmol L-1 Mg, 1.75 mmol L-1 S, 23 µmol L-1 B, 0.3 µmol L-1 Cu, 12 µmol L-1 Mn, 0.3 µmol L-1 Mo, 1 µmol L-1 Zn and 40 µmol L-1 Fe. The experiment was arranged in a complete randomized design with three replications, with the treatments randomly assigned to the different corrugated roofing sheets. In this system, plants were watered with nutrient solution for 30 minutes every three hours during the day and every six hours at night.
The nutrient solution was kept in five 1,000 L tanks, according to the treatments. During cultivation, the volu-me of the tanks was supplevolu-mented daily with well water up to its initial volume. The pH was monitored daily and maintained between 5.5 to 6.5 using HCl and NaOH (3 mol L-1). The electrical conductivity (EC) of the nutrient solution was monitored daily and adjusted using a conductivity meter when it showed depletions of 30% compared with initial values.
The experiment was conducted in nutrient solution under controlled conditions in order to vary the doses of N and K and the N:K ratios, excluding the effect of the accompanying ion, usually present in field conditions or in soil-containing pots. Although optimal doses are not extrapolated to growing conditions, the technique allows more safely to isolate the effects of N and K in the vegetative and reproductive growth of coffee. Additionally, the leaf contents obtained in plants grown in nutrient solution and associated with better growth responses can be used for diagnosis and prognosis of nutritional status of crops.
Assessments of the following variables were performed every three weeks: stem diameter (SD); height (H); number of nodes of the eighth plagiotropic branch from the base (Index Branch – NIB); number of pairs of plagiotropic branches (PPB), number of nodes of the orthotropic branch (NNO) and production of coffee cherries per plant (PROD).
The harvest of coffee cherries was carried out at 780 days after the beginning of the experiment, when about 90% of beans were at the cherry stage. The coffee beans of the useful plot were manually harvested and weighed. For the leaf analysis, leaves were collected from the third or fourth node counted from the apex to the base of the plagiotropic branches of the middle third of the plants between the flowering and the rapid expansion stage. For the cherry bean analysis, samples of about 100 g of processed beans were taken per treatment. The sampled material was washed, dried in a forced-air oven, ground in a Wiley mill with a 20-mesh sieve and subjected to the nitric-perchloric digestion.
The total N content was determined by the Kjeldahl method (Bremner, 1965). The K content was determined by flame photometry absorption. Ca and Mg were determined by atomic absorption spectrophotometry (AOAC, 1975).
For sorting by size, the beans were separated by a set of sieves and classified to size and shape according to Brasil (2003).
Data were subjected to analysis of variance (ANAVA). The Dunnett test was used for the mean comparisons between the control and the other treatments. The treatments with doses of K and the same dose of N (6 mmol L-1) were subjected to regression analysis. Statistical analyzes were performed using the software SAEG (UFV, 2007).
RESULTS AND DISCUSSION
Growth and yield
Growth variables were not statistically different when using the same N:K ratio, although the doses of these nutrients were different (comparison between the treatment of N:K = 1:1.5 and the control). However, when
there was reduction in plant growth with increase in N and K kept constant, as shown by the difference in height and stem diameter between the treatments with the N:K ratios 0.5:1 and 1:0.5 and the control; the number of pairs of plagiotropic branches and the number of nodes of the plagiotropic index branch between treatments 1:1.0 and the control. This response highlights the importance of the N:K for plant growth (Table 1).
The number of nodes in the orthotropic branch did not change with the treatments (Table 1), being more dependent on the plant ontogeny than on their nutritional status.
The production of coffee cherries in treatments of the same N:K and different doses of these nutrients (6 and 3.23 mmol L-1 x 3 and 1.61 mmol L-1) showed significant difference, indicating, therefore, that the N:K ratio was not important for defining the cherry bean production and that there was effect of N and/or K on this variable. The different doses of N tested with similar doses of K resulted in no significant difference, suggesting that the higher dose of N has not positively affected the production of coffee cherries (Table 1).
The increase in N, from 3 to 6 mmol L-1, resulted in lower production, which may be caused by the increased vegetative growth and, hence, increased self-shading, which consequently reduces the photosynthetic rate and the production of photoassimilates used for coffee bean production. According to Sanzonowicz et al. (2003),
nitrogen fertilization can increase coffee production by 30% in traditional spacings; however, in adult plants grown in a high density planting system, the nitrogen can reduce production when there is a high degree of self-shading and excess N in the leaves. Moreover, according to Gallo et al.
(1999), in dense coffee systems, already with self-shading problems, the N fertilization can reduce production.
In a similar study, Oliveira (2005) used increasing percentages of N, P and K fertilization and found that increasing doses did not correspond to increases in height, stem diameter and number of pairs of plagiotropic branches. Even with low doses of N and K, the content of these nutrients in the tissues was sufficient for ensuring good plant growth.
According to Nakashgir (1992), the production and efficiency of N utilization in maize plants are considerably higher when doses proportional to K are applied as organic fertilizer, but when the doses of N and K are excessive, there is no significant increase in production and N use efficiency.
and magnesium absorption by the roots, which affects coffee bean production.
Silva (1999) found opposite results testing the doses 0, 100, 200 and 400 kg/ha and the sources potassium chloride, potassium sulfate and potassium magnesium sulfate and reported no significant effect of the doses on the production of coffee plants, in two consecutive harvests. However, the existing K levels in the soil, although low, were adequate to yield good production of coffee plants.
Chemical composition of leaves and beans The leaf nitrogen contents of plants from the treatments with 6 mmol L-1 N were higher than those from the control treatment, regardless of the K dose or the N:K ratio, indicating the effect of N and K applied in nutrient solution (Table 2). The leaf contents in these treatments were within or above the nutrient sufficiency range proposed by Martinez et al. (2003) for the region of
Viço-sa, whereas the leaf contents of the control treatment were below the range considered adequate for this region.
The leaf content of K was higher in the treatments with 6 mmol L-1N compared with the control (Table 2). In the treatment with N:K 1:0.5, where the concentration of K is lower than the control, this behavior is justified by the lower growth and consequent concentration effect.
The N supplied in the nitrate form may explain the positive interaction among the nutrients observed between the treatments. K deficiency may increase the absorption of ammonia N, but can suppress the uptake, translocation and assimilation of nitrate and simultaneously decrease the nitrate reductase activity in leaves. Because they are monovalent cations and possess similar ionic radius, it is suggested that there is competition between K and ammonia N for the absorption sites via the transport system (Jarvis et al. 1987; Guo et al. 2007).
The leaf contents of Ca and Mg of the treatments with different N:K ratios were not different from those of the control treatment only when the ratio N:K 1:2.5 was used. At this ratio, the K concentration was 5.38 mmol L-1, while the concentration in the control was 1.61 mmol L-1 (Table 2). This result is probably due to competition between the
ions for the absorption sites at the highest K dose applied to the nutrient solution. The higher concentrations of Ca and Mg in the treatments with N:K 1:1.5 and N:K 1:1, in which the K concentrations were higher than those of the control treatment and thus capable of promoting antagonism with such cations, suggest a synergistic effect of the higher N dose of these treatments on the absortion of Ca and Mg. No difference was found between the treatment with N:K 1:1.5 and the control regarding the concentration of K in the coffee beans. However, the content in the beans for the ratio N:K 1:0.5 was significantly different from the content of the control treatment, indicating the effect of the N:K ratio and N doses on this nutrient. No significant difference was found for Ca as a function of different N:K ratios and the control treatment (Table 3).
For the contents of N and Mg, it was found significant difference between the treatment with N K 1:1.5 and the control, indicating that the effect of N and K doses was greater than the effect of the N:K ratio (Table 3 .) The effect of N was indicated by the significant difference observed between the treatments of N K 1:0.5 and N:K 1:1 and the control for the N and Mg contents (Table 3).
Table 1. Height (H-cm), stem diameter (SD-cm), number of nodes of the plagiotropic index branch (NIB), number of pairs of plagiotropic branches (PPB), number of nodes of the orthotropic branch (NNO), and cherry bean production (PROD - kg per plant) in response to N:K ratios obtained with different doses of these nutrients (N6 - 6 mmol L-1 N, N3 - 3 mmol L-1 N) in nutrient solution
N:K ratio H SD NIB PPB NNO PROD
1:0.5 (N6) 81.23 * 15.19 * 10.80 11.16 15.21 0.422
1:1 (N6) 75.85 * 14.90 * 8.80 * 10.75* 14.17 0.567
1:1.5 (N6) 88.65 16.49 10.38 12.25 13.73 1.232 *
1:2.5 (N6) 86.66 16.42 10.70 12.05 15.35 0.751
1:1.5(N3 Control) 91.51 17.81 10.86 12.06 15.09 0.556
CV (%) 34.75 37.20 35.88 52.94 29.29 57.18
* Means followed by * are significantly different from the control treatment, at 10% probability level by the Dunnett test.
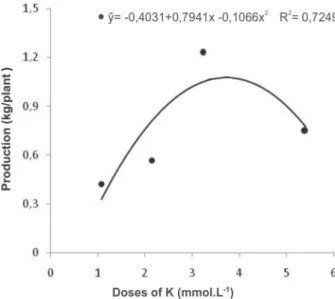
Figure 1. Production of coffee cherries ( ) as a function of K doses in the nutrient solution.
Only in the control treatment, the mean K contents were higher than those of N. In the other treatments, the most abundant element was N, although the highest dose of N did not result in increased production. These results suggest that the most exported nutrient by the beans is N and the requirements for N and K to obtain good yields are equivalent.
Cietto & Haag (1995) found N:K ratios of 1.41 and 1.12 for 3- and 5-year-old coffee plants, respectively, and concluded that the requirement for N is greater than that for K. Neves et al. (2006) found mean N:K
ratios in leaves of 2.36 and 1.51 at 31 and 55 months of cultivation, respectively, concluding that the requirement for N is greater than that for K to obtain good yield, although the greatest proportion of K was found in coffee beans, and of N in leaves. Silva (1999) stated that the requirements of coffee for K are equivalent to those for N.
Bean size classification
Treatments with different N:K ratios did not affect the percentage of small beans (retained on sieve < 15) compared with the control treatment, indicating that the N:K ratio and N content were not important for defining this characteristic ( Table 4). The treatment with N:K 1:0.5 differed significantly from the control, indicating a possible effect of the N:K ratio on the percentage of medium-sized beans (retained on sieves 16 and 17) and large-sized beans (retained on sieve > 18 - Table 4).
The highest proportion of large-sized beans in the treatment of N:K 1:0.5 may be related to the low production of cherry beans obtained in this treatment (0.422 kg/plant).
In general, most beans are retained on sieves 16 and 17; however, when the plants are young, shaded or when the fruit load is low, fruits and beans are considerably larger. During the reproductive phase of the coffee tree, the fruits are the drain preferred over other plant organ in photoassimilate partitioning, and high loads compete for photoassimilates (Matiello et al., 2002), agreeing with the
results found in this study, in which beans were retained on the sieves 16, 17 and 18.
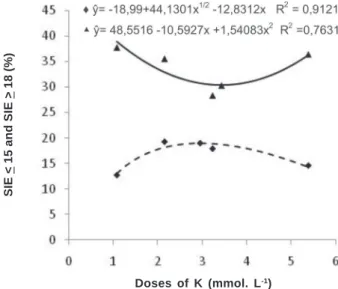
At 6 mmol L-1 N, the percentage of large beans was affected by the K doses. A decreasing quadratic response occurred, decreasing initially with the increasing K dose, reaching the minimum point at 3.43 mmol L-1 of K. The estimated dose for maximum bean production is 3.72 mmol L-1 K, showing the inverse relationship between percentage of large beans and yield per plant.
The percentage of small beans showed a quadratic increase up to 2.95 mmol L-1 K (Figure 2). The response was complementary to that obtained for the percentage of large beans, as expected.
The requirement of potassium increases with the age of the plant and is particularly intense when the plant reaches maturity because of the additional quantities present in the beans, which remove large amounts of K from the adjacent leaves. The importance of K in coffee
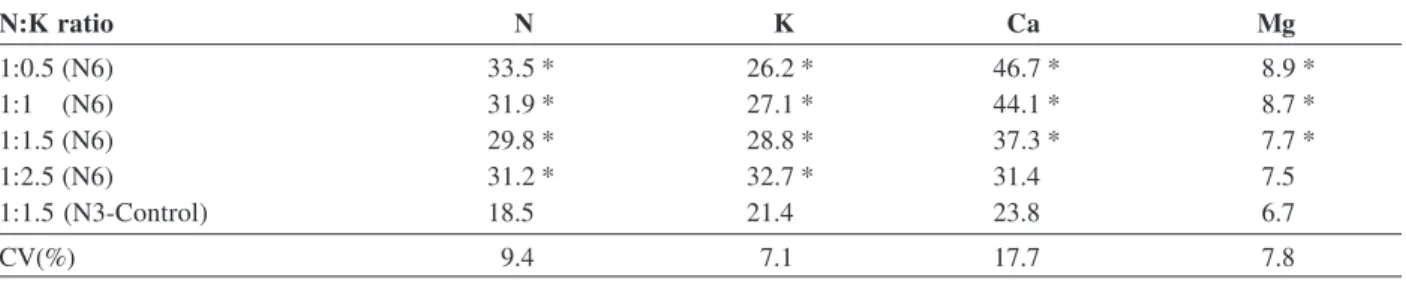
Table 2. Macronutrient contents (g kg-1) in Coffea arabica leaves under different N:K ratios (N6 - 6 mmol L-1 N; N3 - 3 mmol L-1 N) in the nutrient solution between flowering and rapid expansion stage
N:K ratio N K Ca Mg
1:0.5 (N6) 33.5 * 26.2 * 46.7 * 8.9 *
1:1 (N6) 31.9 * 27.1 * 44.1 * 8.7 *
1:1.5 (N6) 29.8 * 28.8 * 37.3 * 7.7 *
1:2.5 (N6) 31.2 * 32.7 * 31.4 7.5
1:1.5 (N3-Control) 18.5 21.4 23.8 6.7
CV(%) 9.4 7.1 17.7 7.8
* Means followed by * are significantly different from the control treatment, at 5% probability level by the Dunnett test.
Table 3. Macronutrient contents (g kg-1) in Coffea arabica beans in response to the N:K ratio obtained with different doses of these nutrients in nutrient solution
N:K ratio N K Ca Mg
1:0.5 (N6) 24.1 * 16.8 * 1.35 1.95 *
1:1 (N6) 23.2 * 18.1 1.15 1.95 *
1:1.5 (N6) 22.7 * 17.7 1.13 1.96 *
1:2.5 (N6) 19.6 18.2 0.99 1.95 *
1:1.5 (N3-Control) 16.5 18.5 1.14 1.78
CV(%) 12.96 4.83 11.16 3.19
production is further demonstrated by the fact that a sufficient reserve of this element tends to decrease the amount of withered beans (Malavolta, 1986).
CONCLUSIONS
Nitrogen influenced mainly the characteristics of vegetative growth and the optimal growth was associated with the concentration 1.85 dag kg-1 in the index leaves.
Potassium influenced mainly the characteristics of reproductive growth, as assessed by production, number of cherry beans on the index branch and bean size obtained in plants whose K concentrations in the index leaves were 3.72, 5.38 and 3.43 dag kg-1.
The bean sizes were associated with the production. The lowest production resulted in higher percentages of beans retained on sieves with holes greater than 16/64 inches, while the highest production increased the percentage of beans retained on sieves with holes smaller than 16/64 inches.
Table 4. Percentage of coffee beans retained in sieves in response to the N:K ratio obtained with different doses of these nutrients in the nutrient solution
SIEVE(%)
SIE < 15 ns 16 > SIE > 17 SIE > 18
1:0.5 (N6) 13.76 35.67 * 50.57 *
1:1 (N6) 12.71 49.42 37.87
1:1.5 (N6) 19.23 45.14 35.63
1:2.5 (N6) 17.88 53.76 28.36
1:1.5 (N3-Control) 14.58 48.92 36.50
CV(%) 15.01 12.9 19.39
ns Not significant by F test at 5% probability.
* Means followed by * are significantly different from the control treatment, at 5% probability level by the Dunnett test.
N:K ratio
ACKNOWLEGMENTS
The authors would like to thank CNPq (Conselho Na-cional de Desenvolvimento Científico e Tecnológico), CAPES (Coordenação de Pessoal de Nível Superior) and FAPEMIG (Fundação de Amparo à Pesquisa do Estado de Minas Gerais) for the financial support.
REFERENCES
AOAC - Association of Official Analytical Chemists (1975) Official methods of analysis. 12ª ed. Washington. 1094p.
Bremner JM (1965) Total nitrogen In: Black CA (Ed.) Methods of soil analysis. Madison, American Society of Agronomy, 2:1149-1178.
Brasil (2003) Ministério de Estado da Agricultura, Pecuária e Abastecimento. Instrução Normativa no 8, de 11 de junho de 2003. Regulamento Técnico de Identidade e de Qualida-de para a Classificação do Café Beneficiado Grão Cru. Seção 1, p.4.
Carneiro JG (1995) Produção e controle de qualidade de mudas florestais. Curitiba, UFPR/FUPEF, 457p.
Catani RA & Moraes FRP (1958) A composição química do cafe-eiro. Revista de Agricultura, 1:45-57.
Cietto S & Haag HP (1995) Nutrição mineral do cafeeiro I: acu-mulação de matéria seca, recrutamento de N, P e K pelo cafeei-ro (Coffea arabica L. cv. Catuaí) com dois, três, quatro e cinco anos de idade, nas fases fenológicas de repouso, granação e maturação vegetando em um Latossolo Vermelho Amarelo, fase cerrado. Agronomia Lusitana, 45:101-120.
Gallo PB, RAIJ Bvan, Quaggio JA & Pereira LCE (1999) Resposta de cafezais adensados à adubação NPK. Bragantia, 58:341-351. Guimarães RJ & Mendes ANG (1997) Nutrição Mineral do
cafeei-ro. Lavras, UFLA/FAEPE, 70p.
Guo, SW, QR Shen & Brueck H (2007) Effects of local nitrogen supply on water uptake of bean plants in a split root system. Journal of Integrative Plant Biology, 49:472-480.
Jarvis SC, Macduff JH, Webb J & Mosquera A (1987) Effect of nitrate supply and deprivation and/or defoliation on potassium absorption and distribution in rye grass. Journal of Experimen-tal Botany, 41:1-10.
Malavolta E (1986) Nutrição, Adubação e calagem para o cafeei-ro. In: Rena AB (Ed.) Cultura do cafeeiro: fatores que afetam a produtividade. Piracicaba, Associação Brasileira para Pesquisas da Potassa e do Fosfato. p. 165-275.
Figure 2. Percentage of beans sieve < 15 (SIE < 15 - ) and sieve > 18 (SIE > 18 - ) as a function of K doses in the nutrient solution.
SIE
<
15 and SIE
>
18 (%)
Malavolta E (1993) Nutrição mineral e adubação do cafeeiro: colheitas econômicas máximas. São Paulo, Agronômica Ceres. 210 p.
Marschner P (2012) Marschner’s mineral nutrition of higher plants. 3rd ed. New York, Academic Press. 651p.
Martinez HEP, Menezes JFS, Souza RB, Venegas VHA & Guima-rães PTG (2003) Faixas críticas de concentração de nutrientes e avaliação do estado nutricional de cafeeiros em quatro regiões de Minas Gerais. Pesquisa Agropecuária Brasileira, 38:703-713. Martinez HEP & Clemente JM (2011) O uso do cultivo hidropônico de plantas em pesquisa. 1ª ed. Viçosa, Editora UFV. 76p.
Matiello JB, Barros UV, Barbosa CM, Torquato RL & Walker KJS (2002) Efeito do número de hastes no cafeeiro sobre o tama-nho dos grãos produzidos. In: Congresso Brasileiro de Pesquisas Cafeeiras, Marília. Anais, PROCAFÉ. p. 23-24.
Moura WM, Lima PC de, Martinez HEP, Paixão GP da, Sano PM, Condé ABT & Pertel J (2007) Avaliação de cultivares de café em solução nutritiva com diferentes níveis de nitrogênio e po-tássio. In: 5º Simpósio de pesquisa dos cafés do Brasil, Águas de Lindóia. Anais, Embrapa – Café. CD-ROM.
Nakashgir GH (1992) Influence of potassium on nitrogen utilization by maize under dryland conditions as affected by water storage. Advances in Plant Science, 5:134-142.
Neves YP, Martinez HEP, Amaral JFT & Souza R (2006) Produtividad y acumulación de materia seca por cultivares de
Coffea arabica L. Coffee Science, 1:156-167.
Oliveira S (2005) Adubação com nitrogênio, fósforo e potássio para experimentos com cafeeiros em vaso. Dissertação de Mestrado. Universidade Federal de Lavras, Lavras. 52p. Rosolem CA (2005) Interação do potássio com outros íons. In:
Yamada T & Roberts TL (Eds.) Potássio na agricultura brasilei-ra. Piracicaba, POTAFOS. p.239-260.
Sanzonowicz C, Toledo PMR, Gomes AC, Sampaio JBR, Maia TEG, Guerra A F, Rodrigues GC & Nazareno RB (2003) Avalia-ção inicial do crescimento de um cafezal em um solo de cerrado sob diferentes níveis de adubação e regimes hídricos. In: III Simpósio de Pesquisa dos Cafés do Brasil, Porto Seguro. Anais, EMBRAPA. p.398-399.
Severino LS, Sakiyama NS, Pereira AA, Miranda GV, Zambolim L & Barroso UV (2001) Caracterização de progênies de café Catimor em Martins Soares (Minas Gerais). Revista Ceres, 48:629-648.
Steiner AA (1984) The universal solution, In: 6th International Congress on soilless culture, Lunteren. Proceedings, ISOSC. p. 633-649.
Silva EB (1999) Fontes e doses de potássio na qualidade do café proveniente de plantas cultivadas em duas condições edafoclimáticas. Tese de Doutorado. Universidade Federal de Lavras, Lavras. 105p.