Received May 6, 2010 and accepted June 1, 2011. Corresponding author: nevesvv@yahoo.com.br
Growth index in massai grass under different levels of nitrogen fertilization
1Marcos Neves Lopes2, Roberto Cláudio Fernandes Franco Pompeu3, Magno José Duarte Cândido2*, Claudivan Feitosa de Lacerda2, Rodrigo Gregório da Silva4, Francisco Ronaldo
Belem Fernandes2
1Research financed by MEC/SESu. 2Universidade Federal do Ceará - UFC.
3Empresa Brasileira de Pesquisa Agropecuária, Centro Nacional de Pesquisa Caprinos e Ovinos. 4Instituto Federal de Educação, Ciência e Tecnologia - IFCE, Campus Avançado do Tauá.
* Pesquisador do CNPq e tutor do PET Zootecnia/UFC.
ABSTRACT -This study aimed to evaluate the growth index of massai grass during two regrowth cycles in a greenhouse under five levels of nitrogen (0, 150, 300, 450 and 600 mg N/dm3 of soil) and eight growth ages (5, 8, 11, 14, 17, 20, 23 and
26 days) in a split-plot design with five replications. The following variables were evaluated: net assimilation rate, herbage growth rate, relative growth rate, leaf area ratio, leaf weight ratio and specific leaf area. The effect of nitrogen was detected on the variables net assimilation rate (regrowths 1 and 2), leaf area ratio (regrowth 1), leaf weight ratio (regrowths 1 and 2), specific leaf area (regrowths 1 and 2) and herbage growth rate (regrowths 1 and 2). The growth ages influenced the relative growth rate (regrowth 2) and the net assimilation rate (regrowth 2). The net assimilation rate presented linear effect, estimated in 0.70 and 2.86 g/m2 leaf.day-1 for the 0 and 600 mg N/dm3 soil, respectively (regrowth 1). For each milligram of N/dm3
added, the leaf area ratio was reduced in 0.0000258 m2 leaf/g plant (regrowth 1). The herbage growth rate was estimated in 1.38
and 37.02 g/m2.day-1 (regrowth 1), and 4.37 and 32.20 g/m2.day-1 (regrowth 2) for the 0 and 600 mg N/dm3 soil, respectively.
The massai grass’ growth is favored by nitrogen fertilization, and little do the growth ages affect the growth index of the plants.
Key Words: herbage growth, net assimilation rate, nitrogen fertilizer, Panicum maximum × Panicum infestum
www.sbz.org.br
Introduction
The use of fertilization associated to a type of forage with high capability of response to intensive management, and with the efficient use of produced forage constitutes essential mechanisms for the success of livestock production on pastures. Among the nutrients, nitrogen is the most influential element on the growth characteristics, since it participates in several physiological processes and also takes part in vital compounds for the development and life of the plant, such as protein, chlorophyll, nucleic acids, among others (Taiz & Zeiger, 2009).
The accumulation of biomass in forage plants is a result of complex interactions between genetic attributes and environment, and their effects on the physiological processes and the morphological characteristics of the plants (Da Silva & Pedreira, 1997). Over 90% of dry mass of plants is directly originated from the photosynthetic carbon assimilation (Robson et al., 1988).
The basis of growth analysis is the sequential measurement of the accumulation of organic matter and its determination is performed by evaluating the accumulation of dry mass of the plant and the leaf area growth (Santos
Júnior et al., 2004). This determination is crucial, since the leaves are the main responsible for the capture of solar energy and for the production of organic matter through photosynthesis. Knowing the leaf surface and the accumulation of dry mass of the plant during a given time period enables to evaluate the leaf photosynthetic efficiency and its contribution to the plant growth (Magalhães, 1985; Benincasa, 1988). In this context, this study aimed at evaluating the growth index of Panicum maximum × Panicum infestum
cv. Massai, during two regrowth cycles, receiving increasing levels of nitrogen fertilizer.
Material and Methods
The relative air humidity presented minimum and maximum averages of 13.6 and 59.8% (establishment), 10.8 and 58.9% (regrowth 1), and 10.2 and 58.4% (regrowth 2), respectively.
The evaluated treatments consisted of five nitrogen levels (0; 150; 300; 450 and 600 mg N/dm³ of soil), and eight growth ages (5; 8; 11; 14; 17; 20; 23 and 26 days of growth after emergence), according to completely randomized design in a split-plot arrangement, with the nitrogen levels allocated in the plots, and the growth ages, in the subplots, with five replicates.
The soil used in the experiment was the yellow argisoil, with sandy and clay sediments in barrier formation as source material. After collected, the soil was sieved for better homogenization and retention of coarse materials. Soil samples, obtained in the 0 - 20 cm deep layer, presented the following chemical composition: phosphorus = 4 mg/dm3; potassium = 76 mg/dm3; Ca2+ = 2.0 cmolc/dm3; Mg2+ = 1.9 cmolc/dm3; Al3+ = 0.0 cmolc/dm3; Na+ = 11 mg/dm3; organic matter = 9.10 g/kg; base saturation = 4.14 cmolc/dm3; CTCt = 4.14 cmolc/dm3; pH in water = 5.7; Fe2+ = 19 mg/dm3; Cu2+ = 0.14 mg/dm3; Zn2+ = 3.91 mg/dm3; manganese = 12.18 mg/dm3, corrected by following recommendations from CFSEMG (1999), for nitrogen levels suggested for grasses with high productive potential and high production level.
Pots were randomly distributed inside the greenhouse. At the moment of filling the pots with capacity of 10 dm³ each, soil amendment was performed, by applying a dose of limestone of 6.169 g/pot, equivalent to 1,233 kg/ha, according to the fertility analysis, aiming at the increase of calcium content and the pH value. During a period of ten days, samples received daily irrigation, in order to accelerate the reaction of lime.
The control of daily irrigation to be applied was done by installing mercury tensiometers (Hg) into the pots (two tensiometers per treatment), with water replacement when the mercury column (h) reached about 10.0 cm in the treatments supplied with higher nitrogen levels. The treatment that received the level of 600 mg N/dm3 of soil was the reference for the water replacement applied in the other treatments, according to the equation: ψm = –12.6 h + h1 +
z; where: ψm = matric potential; h = height of mercury
column (Hg) in the cube (cm), in relation to the soil surface, and z = depth of the porous capsule (10 cm) (Amaro Filho et al., 2008). At the end of irrigation, the Hg column height in the cube (cm) presented about 5.0 cm for all treatments, i.e., the moisture soil conditions were kept close to field capacity in all experimental units (pots).
Sowing was carried out using an average of 50 seeds per pot. Thinning was done eight days after germination, leaving 12 plants remaining per pot, which were reduced to three, after final thinning carried out 13 days after germination.
Three cuts were undertaken, the first for uniformity, which had as reference the horizontal length of the stem, i.e., all potted plants were cut, with only a residue with 10 cm length of stem remaining, 43 days after sowing. This criterion was adopted in order to standardize the cut plants, since they would present growth with different inclination angles of the tiller, impairing the cut uniformity, if the cut were held to a fixed vertical height. The second and third cuts obeyed the same criterion and were accomplished after a rest period of 28 days.
Fertilizations of phosphate (simple superphosphate), potassium (potassium chloride) and micronutrients (FTE BR-12) were done according to the results of soil analysis, as well as the use of limestone. The applications of nitrogen (urea) and potassium were split. At the establishment growth, the nitrogen dose for each treatment was divided into two, the first half applied soon after final thinning, and the second half, after 14 days. In all nitrogen applications urea was diluted in the water used for irrigation, in order to improve the uniformity of the application of this fertilizer. Potassium was made available in two applications, the first (120 mg/dm3 of K2O), accomplished at the sowing. The second application (120 mg/dm3 of K2O) via aqueous solution was done soon after the uniformity cut, along with the first nitrogen dose, at regrowth 1. The supply of phosphorus (125 mg/dm3 of P
2O5) was done once, at the
time of sowing. In this moment, micronutrients (25 mg/dm3
of FTE BR-12) were also supplied. The second half of the nitrogen dose for each treatment applied at regrowth 1 was supplied in the middle of the rest period (28-day cycles). At regrowth 2, the same procedures were followed.
The tiller population density (TPD) was measured concurrently to the measurements of biomass flow, by counting the number of tillers in each experimental unit (pot). Thus, the total green leaf area per pot (LA), the total herbage biomass (THB) and the green leaf biomass of (GLB) were estimated. With the forage biomass and the value of the leaf area index (LAI), the following indices were obtained: net assimilation rate (NAR), leaf area ratio (LAR), leaf weight ratio (LWR), specific leaf area (SLA), herbage growth rate (HGR) and relative growth rate (RGR), according to equations described in Radford (1967) and Beadle (1993). Data were analyzed using analysis of variance and regression analysis. The effects of the level of nitrogen fertilizer and growth ages were assessed by regression analysis, in the main effect. The choice of the models was based on the significance of the linear and quadratic coefficients, by means of the t test of Student (P<0.05) and the coefficient of determination. As an aiding tool for statistical analyses, the GLM procedure from the SAS statistical package (SAS Institute, 2003) was adopted.
Results and Discussion
A lack of interaction (P>0.05) was observed between nitrogen levels and growth ages in both regrowth cycles for the net assimilation rate (NAR), which represents the balance between photosynthesis and respiration (Lambers, 1987) and can be positive or negative depending on the conditions of the environment and management to which the plant is submitted.
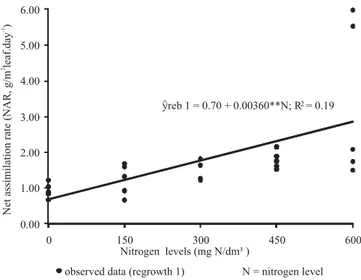
At regrowth 1, NAR has presented positive linear response (P<0.05) with increase in nitrogen levels, estimated in 0.70 to 2.86 g/m2 leaf.day-1 for 0 and 600 mg N/dm3 of soil,
respectively. For each milligram of N/dm3 added, an increase
of 0.00360 g/m2 leaf.day-1 in the net assimilation rate was
observed (Figure 1).
This increase in NAR in response to increasing nitrogen fertilizer levels is due to the increase in the number of cells, leading to a higher development of leaves with higher photosynthetic potential. According to Andrade et al. (2005), the greater availability of nitrogen affects the photosynthesis because it is a component of chlorophyll molecule and part of the molecular structures of the entire protein synthesis apparatus involved in the photosynthetic process. In fact, there are reports of increased photosynthetic rate and the relative chlorophyll index in response to the levels of nitrogen fertilizer (Cândido et al., 2009).
Also in regrowth 1, despite the lack of effect (P>0.05) to the NAR in regression analysis with the advancing growth ages, the raw values of this variable were lower for the
intermediate values (3.04; 1.80; 1.28; 1.48; 1.72; 1.70 and 1.38 g/m2 leaf.day-1 for ages 8; 11; 14; 17; 20; 23 and 26 days of growth, respectively).
At regrowth 2, quadratic response to the NAR with the advance in growth ages was observed, with values estimated at 3.42 and 1.98 g/m2 leaf.day-1 at the ages 8 and 26 days of growth, respectively, and reaching the minimum point (1.76 g/m2 leaf.day-1) with 21 growth days (Figure 2), but no effect on this variable was observed with increasing levels of nitrogen, with average of 2.29 g/m2 leaf.day-1.
Figure 1 - Net assimilation rate (NAR) with increasing nitrogen levels in Panicum maximum × Panicum infestum cv.
Massai during the first regrowth cycle; significant at 1% level (**).
Figure 2 - Net assimilation rate (NAR) with the advance in growth ages in Panicum maximum × Panicum infestum
In both regrowth cycles, the higher net assimilation rate values at the early growth stage indicate the non occurrence of negative balance and consequent biomass loss. The low respiratory demand, due to low biomass in the intermediate age and the rapid emergence of new leaves with high photosynthetic capacity (Woledge & Leafe, 1976; Gomide et al., 2002) explains the higher NAR values during the first growth ages of massai grass (Lambers et al., 1989).
The low values of NAR in massai grass at the most advanced plant maturity (end of the cycle) probably occurred due to the increase in the average age of the leaves coupled to the mutual shading of the leaves in the plant, thus reducing their photosynthetic efficiency. Furthermore, with the advance in plant maturity there is greater supply of assimilates for the stem development and other parts, enhancing the plant respiratory losses, leading to a reduction in NAR (Oliveira et al., 2000).
In this context, the net assimilation rate represents the difference between the dry matter produced by the photosynthesis and consumed by respiration and photorespiration (Lambers, 1987). Nevertheless, according to Watson et al. (1966), NAR reduction is mainly due to the drop in the photosynthetic rate that occurs with increased respiratory losses of the plant. Importantly, NAR is not only determined by the photosynthetic rate, but also by the size of leaf area, in addition to the duration of vegetative period, architecture of upper part, translocation, and assimilate partitioning (Bernardes, 1987).
Considering the leaf area ratio (LAR), which represents the leaf area in use by the plant to produce a gram of dry mass, no interaction (P>0.05) was detected between nitrogen levels × growth ages. At regrowth 1, no effect (P>0.05) of the growth ages for this variable were detected, with a mean value of 0.027 m2 leaf/g plant, although variation (P<0.05)
was recorded in the LAR with increasing nitrogen levels, revealing a decreasing linear pattern (P<0.05) in the variable response, with estimates of 0.0343 and 0.0188 m2 of leaf/g
of plant, for the 0 and 600 mg N/dm3 levels of soil, respectively. The dose of 600 mg N/dm3 of soil provided an 82.4% reduction (regrowth 1) in the LAR, in relation to the treatment without nitrogen fertilizer (Figure 3).
The leaf area ratio reduction with increasing nitrogen levels indicates lower investment in the area of light capture at higher doses, possibly due to the investment in supporting structures of the plant, as the canopy becomes heavier with higher nitrogen levels. This downward trend of the LAR in response to nitrogen fertilization can also be justified by the initial condition of the structure and mass of the canopy at higher nitrogen levels, in which the higher residual mass after cutting resulted in a greater amount of stem, possibly
due to the investment in supporting structures of the plant, as there was an increase in biomass (Pompeu et al., 2009), and therefore provided lower values of LAR, at the highest levels of nitrogen.
For regrowth 2, the LAR was not influenced (P<0.05) by the nitrogen fertilization, nor was it modified (P<0.05) by the growth ages, with mean values of 0.0214 and 0.0214 m2 of
leaf/g of plant, respectively.
Usually, LAR decreases with age due to variations in the source/sink ratio, but in the present trial, this trend was not observed. In this way, during the vegetative growth stage there is greater input of assimilates for the leaf production in order to increase the capture of incident light, and promote fast growth. A drop in the LAR values with the plant maturity is associated with variations in leaf weight ratio (LWR) and specific leaf area (SLA). A decrease in LAR during the development reflects greater allocation of assimilates for the development of stem, roots and reproductive parts at the expense of leaf production, during the linear growth phase (Oliveira et al., 2000).
Considering that the leaf blades are the organs responsible for the production of dry mass via photosynthesis and the other components of the plant depend on the exportation of photoassimilates produced in the leaves, the leaf weight ratio (LWR) expresses the fraction of dry mass not exported from the leaves to such components of the plant (Benincasa, 1988). For this variable (LWR) no interaction (P>0.05) between nitrogen levels and growth ages were recorded in either of the regrowth cycles.
In regrowth 1, the LWR values were similar (P>0.05) between the growth ages, with mean of 0.796 g leaf/g plant.
Figure 3 - Leaf area ratio (LAR) as function of increasing nitrogen levels in Panicum maximum × Panicum infestum cv.
However, the raw data of this variable presented an increasing linear trend (P£0.1206) with the advancing growth ages (0.74; 0.77; 0.78; 0.79; 0.80; 0.82; 0.83 and 0.84 g leaf/g plant for the ages of 5; 8; 11; 14; 17; 20; 23; 26 growth days, respectively).
The leaf weight ratio (LWR) was influenced (P<0.05) by nitrogen fertilization (regrowth 1), revealing a quadratic pattern in the response of the variable, with maximum value (0.8971 g leaf/g plant) for the dose of 28 5.4 mg N/dm3
of soil (Figure 4).
For the second regrowth, the LWR results followed the same response pattern of regrowth 1, without being influenced (P<0.05) by the more advanced growth ages, but with raw values presenting an upward linear trend (P≤0.1006) with the advance in growth ages (0.69; 0.73;
0.75; 0.77; 0.79; 0.80; 0.81 and 0.81 g leaf/g plant for 5; 8; 11; 14; 17; 20; 23; 26 day growth ages, respectively) and revealing a quadratic trend in the response to that variable (LWR), which was maximized (0.875 g leaf/g plant) at the dose of 288.6 mg N/dm3 of soil (Figure 4).
The similar pattern of response for both regrowth cycles was possibly result of the greater partition of carbon inside the plant, preferentially by the support structures at higher nitrogen levels, in relation to the areas of light capture, as previously reported for the leaf area ratio (LAR). By this pattern of response of the LWR in the two regrowth cycles, we can infer that the increase in nitrogen fertilization probably promoted retention of photosynthates in the leaves, which constitute the most relevant fraction of the animal feeding. Contrastingly, under conditions of nitrogen deficiency, leaves export more photosynthates to the roots than those leaves suitably supplied with nitrogen (Santos Júnior et al., 2004).
The specific leaf area (SLA) is the morphological and anatomical component of the LAR, since it relates the surface with the dry mass of the leaf itself, and its inverse (specific mass of the leaf) expresses the leaf thickness (Benincasa, 1988). For this variable (SLA) no interaction (P>0.05) between the nitrogen levels and growth ages of the massai grass were recorded during the two regrowth cycles.
At regrowth 1, the specific leaf area responded linearly decreasing (P<0.05) with increasing nitrogen levels, estimated in 0.0441 to 0.0245 m2 leaf/g leaf for the doses of 0 and 600 mg N/dm3 of soil, respectively (Figure 5).
In the second regrowth, the SLA results were not affected (P>0.05) by the growth ages, with mean 0.0279 m2
leaf/g leaf. Nevertheless, a decreasing linear response (P<0.05) in this variable with increasing nitrogen fertilization was observed, revealing values estimated at 0.0312 and 0.0245 m2 leaf/g leaf at the doses of 0 and 600 mg N/dm3 of soil, respectively (Figure 5).
The reduction in the estimates of specific leaf area with increasing nitrogen levels during the two growth periods reflects the effect of this nutrient on the weight growth of the leaves relatively on the leaf area, thus indicating the increase in leaf thickness. This indicates a morphological re-adaptation of the leaf, with lower investment in area of light capture and greater investment in thylakoid stacking in photosynthetic cells and synthesis of carboxilation enzymes (Taiz & Zeiger, 2009).
In relation to herbage growth rate (HGR), which represents the daily increase of weight per unit area of soil (g/m2.day-1) of massai grass, a lack of interaction (P>0.05) was observed between nitrogen levels and growth ages for both regrowth cycles.
Figure 5 - Specific leaf area (SLA) as a function of nitrogen levels in Panicum maximum × Panicum infestum cv. Massai
during the first (solid line) and second (dotted line) regrowth cycles; significant at 1% level (**). Figure 4 - Leaf weight ratio (LWR) as a function of nitrogen
levels in Panicum maximum × Panicum infestum cv.
Herbage growth rate was not influenced (P>0.05) by growth ages in either of the regrowth cycles, with mean 19.20 and 18.29 g/m2.day-1 for regrowth cycles 1 and 2,
respectively. However, this rate increased (P<0.05) with nitrogen levels in both regrowth cycles, with estimated values of 1.38 to 37.02 g/m2.day-1 (regrowth 1) and 4.37 to 32.20 g/m2.day-1 (regrowth 2) for the doses of 0 to 600 mg
N/dm3 of soil, respectively. The dose of 600 mg N/dm3 of
soil promoted an increase of 2,582.6% (regrowth 1) and 636.8% (regrowth 2) in the HGR, comparing with the treatment with absence of nitrogen (Figure 6).
Taking into consideration the response of the HGR, we may infer that during the vegetative phase of the plant, it is likely that a greater amount of absorbed nitrogen as a function of the highest dose will be invested in the synthesis of enzymes for the formation of photosynthetic tissues, especially prevalent in the leaves, increasing the leaf biomass.
For the relative growth rate (RGR) of the massai grass, no interaction (P>0.05) between nitrogen levels and growth ages was seen in any of the regrowth cycles, nor effect (P>0.05) of the factors isolated on regrowth 1, with mean of 0.80 g/g.day-1.
At the second regrowth cycle, RGR was not affected (P>0.05) by the nitrogen levels, with mean of 0.918 g/g.day-1,
but there was a quadratic response (P<0.05) with the advance in growth ages, with estimates of 1.33 and 0.761 g/g.day-1 in the ages of 8 and 26 growth days, respectively, and reaching the minimum point (0.73 g/g.day-1) with 22.65
growth days (Figure 7).
The literature states that the RGR presents higher values during the first growth days, with a posterior decrease. The studies conducted by Gomide (1996), with five cultivars of the genus Cynodon, recorded RGR values of
0.084 g/g.day-1 (21 to 28 growth days) and 0.026 g/g. day -1 (28 to 35 growth days). The pattern of response (reduction) in the RGR at more advanced ages (end of the cycle) can be ascribed to the progressive increase in plant weight, since the RGR = (1/W).(dW/dt), as well as to the decrease in the values of NAR and LAR, since the RGR derives from the product of these two growth indices; the first, a physiological component, and the second, a morphological component (Alexandrino et al., 2005).
At the beginning of growth, the leaf area of the plant is made up by young leaves with high photosynthetic capacity, i.e., high efficiency of fixation of atmospheric CO2. As the plant develops, leaf senescence enhances, reducing the photosynthetic efficiency of the leaves besides increasing respiratory losses, compromising the NAR and LAR, and consequently the RGR (Wilson, 1981).
Interestingly, the relative growth rate results are above the range between 0.02 and 0.5 g/g.day-1 reported by
Beadle (1993) for most species of C4 plants under diverse environmental conditions. Given this, several factors can influence the RGR values, such as species or variety (Garnier, 1992; Ludlow & Wilson, 1970), growth stage (Pinto, 1993) or variations in climatic conditions (Benincasa, 1988). Moreover, the differences in the growth rates can also result from how these values have been obtained. Also, the higher values recorded in the present study were
Figure 6 - Herbage growth rate (HGR) as a function of nitrogen levels in Panicum maximum × Panicum infestum cv. Massai during the first (solid line) and second (dotted line) regrowth cycles; significant at 1% level (**).
possibly due to the cultivation in pots (greenhouse), where there was a greater control in environmental and hydric conditions, leading to higher responses in the RGR of the massai grass.
Conclusions
The nitrogen fertilization promotes an expressive increase in the growth of massai grass, constituting an important management practice for the enhancement of animal production in grazing systems. Given the registered response from the massai grass over the regrowth period, in general, this forage should be managed for use at around 20 days of growth, associated with the supply of 600 mg N/dm³ of soil.
Acknowledgements
The authors wish to express their gratitude to SESu, especially the Tutorial Education Program (TEP) for financial support and granting scholarships.
References
ALEXANDRINO, E.; GOMIDE, J.A.; GOMIDE, C.A.M. Crescimento e desenvolvimento do dossel de P a n i c u m maximum cv. Mombaça. Revista Brasileira Zootecnia, v.34, n.6, p.2164-2173, 2005.
AMARO FILHO, J.; ASSIS JÚNIOR, R.N.; MOTA, J.C.A. Física do solo: conceitos e aplicações. Fortaleza: Editora Imprensa Universitária, 2008. 290p.
ANDRADE, A.C.; FONSECA, D.M.; LOPES, R.S. et al. Análise de crescimento do capim-elefante napier adubado e irrigado. Ciência e Agrotecnologia, v.29, n.2, p.415-423, 2005. BEADLE, C.L. Growth analysis. In: HALL, D.O.;
BOLHARNORDENKAMPF, H.R.; LEEGOOD, R.C. et al. (Eds.). Photosysthesis and production in a changing environment: a field and laboratory manual. London, 1993. p.36-46.
BENINCASA, M.M.P. Análise de crescimento de plantas: noções básicas. Jaboticabal: Fundação de Estudos e Pesquisas em Agronomia, Medicina Veterinária e Zootecnia, 1988. 41p. BERNARDES, M. S. Fotossíntese no dossel das plantas cultivadas.
In: CASTRO, P.R.S. et al. (Eds.) Ecofisiologia da produção agrícola. Piracicaba: Associação Brasileira para Pesquisa da Potassa e do Fosfato, 1987. p.12-48.
CÂNDIDO, M.J.D.; LOPES, M.N.; LACERDA, C.F. et al. Características fisiológicas de Panicum maximum x Panicum infestum cv. Massai sob doses crescentes de adubação nitrogenada.
In: REUNIÃO ANUAL DA SOCIEDADE BRASILEIRA DE ZOOTECNIA, 46., 2009, Maringá. Anais... Maringá: Sociedade Brasileira de Zootecnia [2009] (CD-ROM).
COMISSÃO DE FERTILIDADE DO SOLO DO ESTADO DE MINAS GERAIS – CFSEMG. Recomendações para uso de corretivos e fertilizantes em Minas Gerais - 5ª Aproximação. 5.ed. Viçosa, MG: UFV, 1999. 359p.
DA SILVA, S.C.; PEDREIRA, C.G.S. Princípios de ecologia aplicados ao manejo da pastagem. In: SIMPÓSIO SOBRE ECOSSISTEMAS DE PASTAGENS, 3., 1997, Jaboticabal. Anais… Jaboticabal: FUNEP, 1997. p.62.
DAVIES, A.; EVANS, M.E.; EXLEY, J.K. Regrowth of perennial ryegrass as affected by simulated leaf shealths. Journal of Agriculture Science, v.101, p.131-197, 1993.
GARNIER, E. Growth analyses of congeneric annual and perennial grass species. Journal of Ecology, v.80, n.5, p.665-675, 1992. GOMIDE, C.A.M.; GOMIDE, J.A.; MARTINEZ, C.A. et al. Fotossíntese, reservas orgânicas e rebrota do capim-mobaça (Panicum maximum, Jacq.) sob diferentes intensidades de desfolha do perfilho principal. Revista Brasileira de Zootecnia, v.31, n.6, p.2165-2175, 2002.
GOMIDE, C.C.C. Algumas características morfológicas e químicas de cinco cultivares de C y n o d o n. 1996. 100f. Dissertação (Mestrado em Zootecnia) - Universidade Estadual de São Paulo, Jaboticabal.
LAMBERS, H. Does variation in photosynthetic rate explain variation in growth rate and yield? Netherlands Journal of Agricultural Science, v.35, n.4, p.505-519, 1987. LAMBERS, H.; FREIDJEN, N.; POORTER, H. et al. Analysis of
growth based on net assimilation rate and nitrogen productivity. Their physiological background. In: LAMBERS, H.; CAMBRIDGE, M.L.; KONINGS, H. et al. (Eds.) Causes and consequences of variation in growth rate and productivity of higher plants. Hague: Netherlands, 1989. p.1-17. LUDLOW, M.M., WILSON, G.L. Studies on the productivity of
tropical pasture plants. II. Growth analysis, photosynthesis, and respiration of 20 species of grasses and legumes in a controlled environment. Australian Journal of Agriculture Research, v.21, n.2, p.183-194, 1970.
MAGALHÃES, A.C.N. Análise quantitativa do crescimento. In: FERRI, M.G. (Ed.). Fisiologia vegetal. São Paulo: Universidade de São Paulo, v.1, 1985. p.332-349.
OLIVEIRA, M.A.; PEREIRA, O.G.; GOMIDE, J.A. et al. Análise de crescimento do capim-bermuda “Tifton 85” (Cynodon spp.). Revista Brasileira de Zootecnia, v.29, n.6, p.1930-1938, 2000. PINTO, J.C. Crescimento e desenvolvimento de Andropogon gayanus, Panicum maximum e Setaria anceps cultivadas em vasos, sob diferentes doses de nitrogênio. 1993. 149f. Tese (Doutorado em Zootecnia) - Universidade Federal de Viçosa, Viçosa, MG.
POMPEU, R.C.F.F.; LOPES, M.N.; CÂNDIDO, M.J.D. et al. Características estruturais do resíduo pós-corte do capim-massai sob níveis crescentes de nitrogênio. In: CONGRESSO DE FORRAGICULTURA E PASTAGENS, 3., 2009, Anais... Lavras: [2009] (CD-ROM).
RADFORD, P.J. Growth analysis formulae: Their use and abuse. Crop Science, v.7, n.3, p.171-175, 1967.
ROBSON, M.J.; RYLE, G.J.A.; WOLEDGE, J. The grass plant its form and function. In: JONES, M.B.; LAZENBY, A. (Eds.) The grass crop. Chapman & Hall, 1988. p.25-83.
SANTOS JÚNIOR, J.D.G.; MONTEIRO, F.A.; LAVRES JUNIOR, J. Análise de crescimento do capim-marandu submetido a doses de nitrogênio. Revista Brasileira de Zootecnia, v.33, n.6, p.1985-1991, 2004.
STATISTICAL ANALYSES SYSTEM - SAS. SAS System for Windows. Version 9.0. Cary: SAS Institute Inc. 2003. (2 CD-ROM).
TAIZ, L.; ZEIGER, E. Fisiologia vegetal. Porto Alegre: Editora Artmed, 2009. 848p.
WATSON, D.J., WILSON, J.H., FORD, M.A. et al. Changes with age in the photosynthetic and respiratory components of the net assimilation rates of sugar beet and wheat. N e w Phytologist, v.65, n.4, p.500-508, 1966.
WILSON, J.W. Analysis of growth, photosynthesis and light interception for single plants and stands. Annals of Botany, v.48, n.3, p.507-512, 1981.