UNIVERSIDADE DA BEIRA INTERIOR
Engenharia
Forecasting Tools and Probabilistic Scheduling
Approach Incorporating Renewables Uncertainty
for the Insular Power Systems Industry
Gerardo José Osório da Silva
Tese para obtenção do grau de Doutor em
Engenharia e Gestão Industrial
(3º Ciclo de Estudos)
Orientador: Prof. Doutor João Paulo da Silva Catalão Coorientador: Prof. Doutor João Carlos de Oliveira Matias
ii
This thesis was supported by FEDER funds (European Union) through COMPETE and by Portuguese funds through FCT, under Projects FCOMP-01-0124-FEDER-014887 (Ref. PTDC/EEA-EEL/110102/2009), FCOMP-01-0124-FEDER-020282 (Ref.
PTDC/EEA-EEL/118519/2010) and PEst-OE/EEI/LA0021/2013. Also, the research leading to these results has received funding from the EU 7th Framework Programme FP7/2007-2013 under grant agreement no. 309048.
iii
Dedicatory
To my closest family, who with love, dedication and effort, always believed in my capabilities and my humanity, supporting me unconditionally in the hardest times, even in their absence.
iv
Acknowledgement
I would like to express my gratitude first to my supervisor and friend Prof. Dr. João Paulo da Silva Catalão for the excellent guidance, motivation, support and expertise he shared with me in my PhD studies, and all the friendship, sympathy, support, honesty, trust and confidence in all the steps I have taken over the past few years, as well as for all the lessons and experiences that we had together, even in those moments which were really difficult. I will be eternally grateful to the noble Professor for all the respect that we have shared in these years.
I am also grateful to my co-supervisor Prof. Dr. João Carlos de Oliveira Matias for all the support, friendship, encouragement, affection and life experiences he transmitted and shared over the years of my PhD in Industrial Engineering and Management, setting an example to follow whether in personal or professional live. Also, I would like to express my gratitude to him for giving me the opportunity to be his PhD student.
I cannot forget the shared affection, enrichment and professional experience of the international researchers belonging to the Sustainable Energy Systems laboratory (SES), in the University of Beira Interior, associated with “Instituto de Engenharia de Sistemas e Computadores – Investigação e Desenvolvimento” (INESC-ID), because without the resources available in the SES laboratory it would not have been possible to carry out this work. In particular, I would like to thank Dr. Juan Miguel Lujano Rojas, colleague and friend, for all the friendship, help, lessons and support that he offered me in the last few years.
Also, I want to thank the University of Beira Interior for all the support, care and resources made available in these years, such that I consider it as my second home. My respectful thanks to all personnel of the University of Beira Interior, especially those in the Electromechanical Engineering Department.
Finally, to all my colleagues and friends who are also an integral part of my life, who shared with me the good and bad times in their lives too, I want to express my gratitude for all the support, especially those who helped me, supported me and gave their precious time to help me, especially in my hardest times. Also, my kindest and respectful thanks to Prof. Cláudio Domingos Martins Monteiro, of the Engineering Faculty of the University of Oporto (FEUP), whose active participation and shared ideas in the FP7-SiNGULAR project in which I collaborated, having been really enriching for me in the past few years.
v
Resumo
Hoje em dia, a mudança de paradigma do setor elétrico e o desenvolvimento da rede elétrica inteligente, em paralelo com as crescentes exigências para uma redução gradual das emissões de gases com efeito de estufa, apresentam inúmeros desafios relacionados com a gestão sustentável dos sistemas de energia elétrica.
A indústria de energia elétrica nos sistemas insulares é profundamente dependente da importação de energia primária, nomeadamente de combustíveis fósseis, e também do comportamento do turismo sazonal, o qual influencia significativamente a economia local. Comparativamente ao sistema elétrico continental, o comportamento dos sistemas elétricos insulares é profundamente influenciado pela natureza estocástica dos recursos energéticos renováveis disponíveis.
A rede elétrica insular é particularmente sensível aos parâmetros de qualidade do sistema elétrico, principalmente aos desvios de frequência e tensão, e a integração massiva do potencial renovável endógeno no sistema elétrico poderá afetar a fiabilidade e segurança do fornecimento de energia, pelo que deve ser dada peculiar atenção aos procedimentos de previsão e operação do sistema.
Os objetivos da presente Tese incidem na criação de novas ferramentas de apoio à decisão, para a previsão fiável dos preços de mercado e da potência eólica, para o despacho económico e afetação ótima de unidades considerando a geração renovável, e para o controlo inteligente de sistemas de armazenamento de energia. As novas metodologias desenvolvidas são testadas em casos de estudo reais, demonstrando a sua proficiência computacional comparativamente ao atual estado da arte.
Palavras-Chave
Indústria de energia elétrica; Gestão sustentável; Despacho económico; Energias renováveis; Armazenamento de energia.
vi
Abstract
Nowadays, the paradigm shift in the electricity sector and the advent of the smart grid, along with the growing impositions of a gradual reduction of greenhouse gas emissions, pose numerous challenges related with the sustainable management of power systems.
The insular power systems industry is heavily dependent on imported energy, namely fossil fuels, and also on seasonal tourism behavior, which strongly influences the local economy. In comparison with the mainland power system, the behavior of insular power systems is highly influenced by the stochastic nature of the renewable energy sources available.
The insular electricity grid is particularly sensitive to power quality parameters, mainly to frequency and voltage deviations, and a greater integration of endogenous renewables potential in the power system may affect the overall reliability and security of energy supply, so singular care should be placed in all forecasting and system operation procedures.
The goals of this thesis are focused on the development of new decision support tools, for the reliable forecasting of market prices and wind power, for the optimal economic dispatch and unit commitment considering renewable generation, and for the smart control of energy storage systems. The new methodologies developed are tested in real case studies, demonstrating their computational proficiency comparatively to the current state-of-the-art.
Keywords
Power systems industry; Sustainable management; Economic dispatch; Renewable energies; Energy storage.
vii
Table of Contents
Dedicatory... iii Acknowledgement ... iv Resumo ... v Palavras-Chave ... v Abstract... vi Keywords ... vi Figures List ... xTables List ... xii
Acronyms ... xiii Nomenclature ...xvi Introduction ... 1 1.1. Framework ... 1 1.2. Motivation ... 10 1.3. Thesis Structure ... 15 1.4. Notation ... 16 State-of-the-Art ... 17
2.1. Electricity Market Prices and Forecasting Tools ... 17
2.2. Wind Power Forecasting Tools ... 22
2.3. Economic Dispatch and Unit Commitment Tools ... 26
2.4. Energy Storage System Tools Management ... 29
2.5. Stochastic Programming ... 33
Hybrid Forecasting Tool ... 35
3.1. Mutual Information ... 35
3.2. Wavelet Transform ... 37
3.3. Evolutionary Particle Swarm Optimization ... 39
3.4. Adaptive Neuro-Fuzzy Inference System ... 42
3.5. Proposed Forecasting Tool ... 44
3.6. Case Studies and Results ... 47
3.6.1. Forecasting Accuracy Evaluation ... 48
3.6.2. Short-Term Electricity Market Prices Results ... 49
3.6.3. Short-Term Wind Power Forecasting Results ... 59
Economic Dispatch Problem... 64
4.1. Probabilistic Economic Dispatch Problem and Proposed Approach ... 64
4.1.1. Discretization of the PDF of Forecasted Wind Power Generation ... 65
4.1.2. Simplification of PDF of Initial Power Production ... 66
4.1.3. Incorporation of Wind Power Forecasting Error ... 67
viii
4.2. Case Studies and Results ... 71
4.2.1. Analysis of 5-Unit Power System ... 72
4.2.2. Analysis of 10-Unit Power System ... 75
Unit Commitment Problem ... 81
5.1. Scenario Generation Process ... 81
5.2. Problem Description... 84
5.2.1. Objective Function ... 84
5.2.2. Generation Limit Constraints ... 85
5.2.3. Operating Ramp rate Constraints ... 85
5.2.4. Startup and Shutdown Ramp Rate Constraints ... 85
5.2.5. Reserve Requirements Constraint ... 85
5.2.6. Power Balance ... 86
5.2.7. Minimum Up/Down Time Constraint ... 86
5.3. Priority List Method to the Unit Scheduling ... 86
5.3.1. Primary Unit Scheduling ... 87
5.3.2. Minimum Up/Down Time Repairing ... 87
5.3.3. Spinning Reserve Repairing ... 88
5.3.4. Shutdown Repairing Process ... 89
5.3.5. Unit Substitution Process ... 89
5.3.6. Shutdown Excess of Generation ... 90
5.4. Proposed Approach ... 91
5.5. Case Study and Results ... 92
Control Strategy with Energy Storage System ... 97
6.1. Power System under Analysis ... 97
6.1.1. Thermal and Renewable Generation Units ... 98
6.1.2. Power Converter ... 99
6.1.3. Vanadium Redox Battery and Charge Controller Model ... 100
6.2. Unit Commitment Problem Incorporating Energy Storage System ... 101
6.2.1. Proposed Methodology ... 101
6.2.2. Solving the Unit Commitment Problem by Priority List Method ... 104
6.3. Case Study and Results ... 107
Conclusions... 111
7.1. Main Conclusions ... 111
7.2. Guidelines for Future Contributions ... 113
7.3. Research Contributions Resulting from this Work ... 113
7.3.1. Articles in Journals ... 113
7.3.2. Book Chapters ... 114
7.3.3. Papers in Conference Proceedings ... 114
x
Figures List
Figure 1.1 — Power capacity in EU28 from 2008 till 2013 in MW and shared renewable power capacity. 6
Figure 1.2 — Wind power capacity evolution in Europe between 2001 till 2013 in MW in onshore and offshore installation. 6
Figure 1.3 — Overall renewable energy capacity installed in Portugal from January 2005 till July 2014. 7 Figure 1.4 — Wind power profile showing intermittency and volatility. 8 Figure 1.5 — Distribution of Portuguese electrical mix production in 2013. 8 Figure 2.1 — Brief characterization of electricity market. 18
Figure 2.2 — Daily electricity market procedure. 18
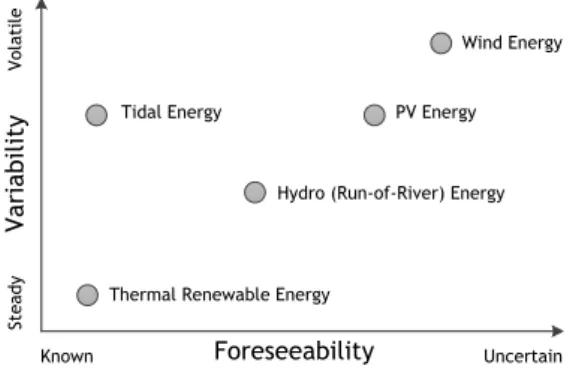
Figure 2.3 — Activity sequence in electricity intraday market. 19 Figure 2.4 — Variability and foreseeability of renewable energy sources. 24 Figure 2.5 — General block diagram for wind power forecasting from physical models. 24 Figure 2.6 — Stochastic programming problems classification. 34
Figure 3.1 — General mutual information representation. 37
Figure 3.2 — Three-level decomposition model of WT. 39
Figure 3.3 — EPSO movement rule of a particle. 41
Figure 3.4 — Most used ANFIS membership functions. 42
Figure 3.5 — Inference system architecture. 43
Figure 3.6 — General ANFIS architecture. 43
Figure 3.7 — Flowchart of proposed HEA tool. 46
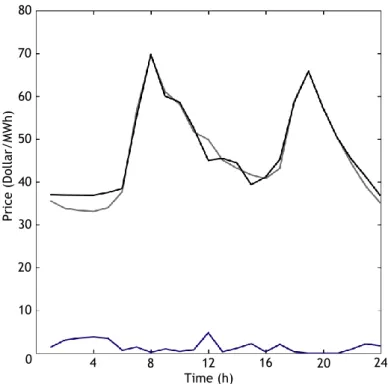
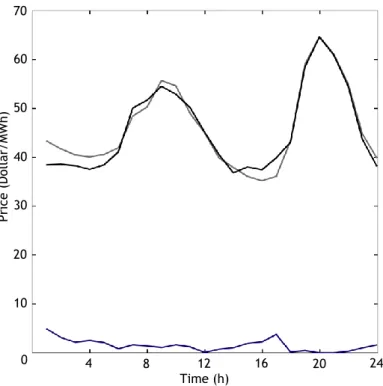
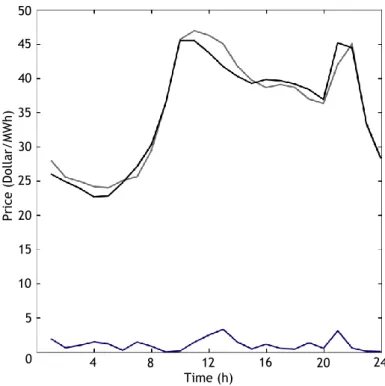
Figure 3.8 — Winter week 2002 results for the Spanish market. 50 Figure 3.9 — Spring week 2002 results for the Spanish market. 51 Figure 3.10 - Summer week 2002 results for the Spanish market. 51 Figure 3.11 - Fall week 2002 results for the Spanish market. 52 Figure 3.12 - May 8, 2006, results for the Spanish market. 52 Figure 3.13 - Daily error comparative results between NN, NNWT, WPA and HEA methodologies. 53 Figure 3.14 - January 20, 2006, results for the PJM market. 55 Figure 3.15 - February 10, 2006, results for the PJM market. 55
Figure 3.16 - March 5, 2006, results for the PJM market. 56
Figure 3.17 - April 7, 2006, results for the PJM market. 56
Figure 3.18 - May 13, 2006, results for the PJM market. 57
Figure 3.19 - February 1–7, 2006, results for the PJM market. 57 Figure 3.20 - February 22–28, 2006, results for the PJM market. 58 Figure 3.21 - Measured and forecasted results for the Winter season. 60 Figure 3.22 - Measured and forecasted results for the Spring season. 60
xi Figure 3.23 - Measured and forecasted results the Summer season. 61 Figure 3.24 - Measured and forecasted results for the Fall season. 61
Figure 4.1 — Power system under study. 65
Figure 4.2 — Characteristics of the discretized beta PDF. 66
Figure 4.3 — PDF of 𝑃𝑛𝑡−1 and CDF of 𝑃𝑛𝑡−1. 68
Figure 4.4 — Selected cases of power production at time 𝑡 − 1. 68 Figure 4.5 — Allocation of power generation (𝑃𝑛,𝑖𝑠
𝑡 ) in the PDF of 𝑃
𝑛𝑡. 69
Figure 4.6 — Illustration of the join PDF of failure events and power production. 71 Figure 4.7 — CDF of power generation loss and PDF of power loss due to failure events. 71 Figure 4.8 — PDF of wind power generation (5-Unit system). 73
Figure 4.9 — PDF of power generation of unit 1. 73
Figure 4.10 - PDF of generation cost. 73
Figure 4.11 - PDF of CO2 emissions of unit 1. 75
Figure 4.12 - PDF of power generator of unit 4. 76
Figure 4.13 - PDF of power generator of unit 6. 76
Figure 4.14 - PDF of generation cost related with fuel consumption. 77
Figure 4.15 - PDF of energy not supplied. 78
Figure 4.16 - PDF of wind power generation. 78
Figure 4.17 - PDF of power generation of unit 6. 79
Figure 4.18 - PDF of generation cost. 79
Figure 4.19 - Behavior of computational time. 79
Figure 5.1 — Probability transformation. 83
Figure 5.2 — Repairing process of minimum up-time constraints. 87 Figure 5.3 — Repairing process of minimum down-time constraints. 87 Figure 5.4 — Selection of generators in unit substitution process. 90 Figure 5.5 — Results from scenario generation and reduction process. 94 Figure 5.6 — CDF of supply reserve requirements for 𝑡 = 1 and 𝑡 = 17. 94 Figure 5.7 — CDF of supply reserve requirements for 𝑡 = 12 and 𝑡 = 20. 94 Figure 6.1 — Architecture CDF of the power system under analysis. 98
Figure 6.2 — SOC and charging power simulation. 101
Figure 6.3 — Charge and discharge periods according to the wind power curtailed. 102 Figure 6.4 — Charge and discharge periods according to the load profile. 103
Figure 6.5 — Reference power of ESS. 103
Figure 6.6 — Hourly aggregated wind power generation. 109
Figure 6.7 — Power from/to ESS under study. 109
Figure 6.8 — State of charge behavior of ESS under study. 109 Figure 6.9 — Load to be supplied by thermal and wind units. 109
xii
Tables List
Table 1.1 — Total wind power capacity installed in some countries in EU28. 5 Table 2.1 — Most widespread wind power forecasting tools used around the world. 25
Table 3.1 — Parameters of MI, EPSO and ANFIS. 47
Table 3.2 — MAPE criterion: Comparative results for Spanish market. 53 Table 3.3 — Weakly error variance criterion: Comparative results for Spanish market. 54 Table 3.4 — MAPE criterion: comparative results for PJM market. 58 Table 3.5 — Error variance criterion: comparative results for PJM market. 58
Table 3.6 — MAPE outcomes for all methodologies. 62
Table 3.7 — Error variance outcomes for all methodologies. 62
Table 3.8 — Comparative NMAE results. 62
Table 3.9 — NRMSE results. 62
Table 3.10 - Comparative MAPE outcomes for 2009. 63
Table 3.11- Comparative NMAE outcomes for 2009. 63
Table 4.1 — Description of 5-Unit system. 72
Table 4.2 — Expected value comparison between MCS and proposed approach. 74
Table 4.3 — CO2 emission model. 74
Table 4.4 — Expected value of CO2 emissions. 74
Table 4.5 — Description of 10-Unit system. 76
Table 4.6 — Expected value comparison between MCS and proposed approach. 77 Table 4.7 — Expected value comparison between MCS and proposed approach incorporating generator reliability. 80 Table 5.1 — Description of the power system under analysis (part 1). 93 Table 5.2 — Description of the power system under analysis (part 2). 93
Table 5.3 — Load demand and wind power forecasting. 93
Table 5.4 — PDF of unit scheduling. 95
Table 5.5 — Average power production results (MW). 96
Table 5.6 — Probability of supply the required reserve. 96
Table 6.1 — Characteristic of thermal units. 108
Table 6.2 — Unit scheduling of day 2 without incorporating ESS (MW). 110 Table 6.3 — Unit scheduling of day 2 incorporating ESS (MW). 110
xiii
Acronyms
AC Alternating current
AHL Augmented Hopfield Lagrange ANEM Australian electricity market
ANFIS Adaptive neuro-fuzzy inference system ARIMA Auto regressive integrated moving average ARMA Autoregressive moving average
ARTMAP Adaptive resonance theory mapping AWNN Adaptive wavelet neural network AWPPS Armines wind power prediction system AWPT Advanced wind power prediction tool BESS Battery energy storage systems CAES Compressed air energy storage system CDF Continuous distribution function
CLSSVM Chaotic least squares support vector machine CNEA Cascaded neuro-evolutionary algorithm CNN Cascaded neural network
COP Conference of parties
CSP Concentrated solar power plant CWT Continuous wavelet transform
Db4 Daubechies mother-wavelet function of fourth order DC Direct current
DR Demand response
DWT Discrete wavelet transform ED Economic dispatch
EGARCH Exponential generalized autoregressive conditional heteroskedastic ENS Energy not supplied
EPL Enhanced priority list
EPSO Evolutionary particle swarm optimization ESS Energy storage system
EU28 Europe Union 28 States Members FA Firefly algorithm
FF Fuzzy algorithm
FNN Fuzzy neural network FOR Forced outages rates GHE Greenhouse emissions HFO Heavy fuel oil
xiv HNES Hybrid neuro-evolutionary system
ILR Improved Lagrangian relaxation IPPD Improved pre-prepared power demand ISO Independent system operator
KPCA+IVM Kernel principal component analysis with informative vector machine ktoe Kilo tons of oil equivalent (103)
LCOE Levelized cost of energy LFO Light fuel oil
LHS Latin hypercube sampling
LHS-CD Latin hypercube sampling with Cholesky decomposition MCS Monte Carlo simulation
MI Mutual information MIBEL Iberian electricity market
MILP Mixed-integer linear programming MIP Mixed-integer programming
MO Market operator
Mton Mega tons (106)
MW Megawatt
NF Neuro-fuzzy
NN Neural network
NNWT Neural network combined with wavelet transform NRM New reference model
NWP Numerical weather prediction
NYISO New York Independent System Operator’s OMEL Futures contracts market operator in Spain OMIP Daily and intraday market operator in Portugal PDF Probability distribution function
PHES Pumped hydro energy storage
PJM Regional transmission organization in USA that coordinates the movement of wholesale electricity (PJM market) PL Priority list
PNAEE National Action Plan for Energy Efficiency (from Portuguese abbreviation) PNAER National Action Plan for Renewable Energy (from Portuguese abbreviation) PSF Pattern sequence-based forecasting
PSO Particle swarm optimization PV Photovoltaic power plants
RAL Research applications laboratory (wind energy predictions) RBF Radial basis function
RBFN Radial basis function neural network
RDFA+KF Fuzzy ARTMAP recursive dynamic factor analysis combined with Kalman filter REN Redes Energéticas Nacionais
xv SCADA Supervisory control and data acquisition system
SDNN Similar days neural network model
SEN National Electrical System (from Portuguese abbreviation) SOC State of charge
SRN Elman network or simple recurrent network SUW Solid urban waste plants (waste)
SVM Support vector machine TNF Time numerical forecasting TSO Transmission system operator
UC Unit commitment
UK United Kingdom
VOLL Value of lost load
VRB Vanadium Redox batteries WNF Wavelet neuro-fuzzy WNN Weighted nearest neighbors
WPA Wavelet transform combined with particle swarm optimization and adaptive neuro-fuzzy inference system WPPT Wind power prediction tool
WT Wavelet transform
xvi
Nomenclature
𝐴𝑖 ANFIS linguistic label.
𝑎𝑖 ANFIS contribution parameter set. 𝛼𝑝𝑑𝑓 Parameter of continuous beta PDF. 𝛼 Significance level value.
𝐴𝑛 Approximation coefficient in wavelet transform. 𝑎𝑛 Parameter of fuel consumption of generator/unit 𝑛. 𝑎𝑣0 Auxiliary variable.
𝑎𝑣1 Auxiliary variable. 𝑎𝑣2 Auxiliary variable. 𝑎𝑣3 Auxiliary variable.
𝐴𝑤 Continuous distribution function of time series 𝑊𝑡.
𝑎𝑤𝑝𝑗𝑡 Value of available wind power generation in discrete state 𝑗 at time 𝑡. 𝐴𝑊𝑃𝑡 Discrete PDF of available wind power generation at time 𝑡.
𝑎𝑤𝑡 Continuous scale parameter of wavelet propagation. 𝐴 Continuous distribution function.
𝛽𝑝𝑑𝑓 Parameter of continuous beta PDF. 𝛽 Significance level limit index of 𝑙𝑚.
𝐵𝐹𝐸 Increment in spinning reserve due to uncertainty in the power to be discharged from ESS. 𝑏𝑔∗ EPSO best global position of a particle.
𝐵ℎ Number of elements of spinning reserve in ESS. 𝐵𝑖 ANFIS linguistic label.
𝑏𝑖 ANFIS contribution parameter set.
𝑏𝑛 Parameter of fuel consumption of generator/unit 𝑛.
𝐵𝑆𝑠ℎ𝑎𝑝𝑒𝑡 Binary vector of battery state of ESS due to load profile shape at time 𝑡. 𝐵𝑆𝑊𝐶𝑡 Binary vector of battery state due to wind power curtailment at time 𝑡. 𝑏𝑤𝑡 Continuous translation parameter of wavelet position.
𝐵 Total number of bins of discrete PDF of power production. 𝑏 Discrete state of power production ∈ {1, 𝐵}.
𝐶𝐻𝑛,𝑚𝑡 Generators/units to be substituted matrix. 𝑐𝑖 ANFIS contribution parameter set.
𝑐𝑛 Parameter of fuel consumption of generator/unit 𝑛. 𝐶𝑃𝑡 Available charge power at time 𝑡 for ESS.
𝐶𝑆𝑇𝑛,𝑚𝑡 Cold start-up time of generator/unit 𝑛, at time 𝑡, in scenario 𝑚. 𝐶𝑆𝑈𝑛,𝑚𝑡 Cold start-up cost of generator/unit 𝑛, at time 𝑡, in scenario 𝑚. 𝐶𝑊𝑇𝑎𝑏 Continuous wavelet transform set.
𝐶𝜔 Objective decision at scenario 𝜔.
xvii 𝐷𝑎𝑣𝑔 Average value of the hourly load.
∆𝑃 Discretization step of the power values 𝑃𝑏. ∆𝜃 Sampling increment of interval {𝛾, 1 − 𝛾}. Δ𝑡 Time-step of the simulation in ESS.
𝐷𝐿𝑡𝑖 Value of the power consumed by dump load at time 𝑡 in sampling point 𝑖. 𝐷𝐿𝑡 Dump load at time 𝑡.
𝐷𝑛 Detail coefficient in wavelet transform.
𝐷𝑛,𝑚𝑡 Binary matrix of generator/unit to be substituted. 𝐷𝑅𝑛 Operating ramp-down rate of generator/unit 𝑛.
𝐷𝑡 Load demand at time 𝑡.
𝐷𝑊𝑇(𝑚𝑤𝑡, 𝑛𝑤𝑡) Discrete wavelet transform set. 𝐸0 Energy stored in ESS to be discharge.
𝐸(𝑙,𝑛) Discrete PDF of power production when generators/units reliability is considered. 𝐸𝑚𝑎𝑥 Maximum energy to be stored on VRB of ESS.
𝐸𝑁𝑆𝑖𝑡𝑠 Energy not supplied at time 𝑡 in sampling point 𝑖𝑠.
𝜖 Gaussian white noise
𝜂𝑏 Efficiency of VRB of ESS.
𝜂𝑣 Efficiency of the power converter in ESS. 𝐸𝑇𝐺𝑡 Excess of thermal power generation at time 𝑡.
𝐹𝑏𝑒 CDF of power loss as consequence of failure in generator/unit system. 𝐹𝑐 Control factor in charge process of ESS.
𝐹ℎ𝑛 Discrete PDF of lack of power of generator/unit 𝑛 as a consequence of a failure event. ∅ One-lag autocorrelation parameter.
𝐹𝑛 Vector of binary elements of generator/unit 𝑛. 𝑓𝑛𝑡 Fuel consumption of generator/unit 𝑛 at time 𝑡. 𝐹𝑂𝑅𝑛 Forced outage rate of generator/unit 𝑛.
𝑓 Expected value of total operating cost.
𝛾 Significance level.
𝐺𝐻𝐸𝑛 CO2 emissions of generator/unit 𝑛.
𝐺𝑛 Average production cost of generator/unit 𝑛. 𝑔𝑛 Average power production of generator/unit 𝑛.
𝐺𝑡 Power to be supplied by thermal and wind units at time 𝑡. 𝐻𝐹𝑛𝑡 Histogram frequency of generator/unit 𝑛, at time 𝑡. ℎ Discrete state of power production.
ℎ𝑛𝑡 Intermediate time series variable.
𝐻𝑆𝑈𝑛,𝑚𝑡 Hot start-up cost of generator/unit 𝑛, at time 𝑡, in scenario 𝑚. 𝐻(𝑋, 𝑌) Conditional entropy.
𝐻(𝑋) Entropy of random discrete variable 𝑋.
𝐻 Last state of 𝑡.
xviii x𝑖𝑚𝑥 EPSO maximum number iteration.
𝑖𝑠 Index of sampling point 𝜃𝑖, 𝑖𝑠 ∈ {1, 𝐼}.
𝑖𝑡ℎ ANFIS output node.
𝐼 Total number of sampling points of interval {𝛾, 1 − 𝛾}. 𝑖 Data index with 𝑁 dimension.
𝐽ℎ Number of elements with excess of spinning reserve in ESS. 𝑗ℎ Position of the element with excess of spinning reserve in ESS. 𝐽 Last state of (𝐿 = (𝐻 + 1)2= 𝐵2).
𝑗 Data index with 𝑀 dimension.
𝑘 EPSO generation step.
𝑙𝑚 Degree index at which a scenario under analysis fulfills the hourly forecasting error
𝐿𝑛𝑖 ANFIS layer.
𝐿𝑡 Value of load demand at time 𝑡.
𝑙 Discrete state of power production when generators reliability is considered. 𝑚1 Battery parameter determined by experimental information.
𝑚2 Parameter of charge process of ESS. 𝑚3 Parameter of charge process of ESS. 𝑀𝑎𝑣𝑔 Defuzzification maximum average. 𝑀𝑐𝑒𝑛 Defuzzification centroid.
𝑀𝐷𝑇𝑛 Minimum down-time of generator/unit 𝑛. 𝑀𝐼(𝑋, 𝑌) Mutual information.
𝑚0 Battery parameter determined by experimental information. 𝑀𝑈𝑇𝑛 Minimum up-time of generator/unit 𝑛.
𝜇 Gaussian mean deviation value.
𝑚𝑤𝑡 Integer scaling parameter of wavelet transform.
𝑀 Scenario maximum number.
𝑚 Scenario generated index.
𝑁𝑃𝑟 Normalized probability of occurrence of a determined event. 𝑛𝑤𝑡 Integer translation parameter of wavelet transform.
𝑛 Number of generator/unit index.
𝑂𝐹𝐹𝑛,𝑚𝑡 Integer variable of cumulative account of the number of hours that generator 𝑛 has been de-comitted. Ω Total scenario universe.
𝜔 Scenario index.
𝑂𝑁𝑛,𝑚𝑡 Integer variable of cumulative account of the number of hours that generator 𝑛 has been committed. 𝑃𝑏 Power value that corresponds to the discrete state 𝑏.
𝑃𝑏𝑡𝑡 Power to charge/discharge VRB of ESS. 𝑃𝑑 Discharged Power of ESS.
𝑃𝐷𝐹𝑛𝑡 Probability density function of generator/unit 𝑛, at time 𝑡. 𝑃𝑑,𝑚𝑎𝑥𝑓 New power to be discharge from ESS.
xix 𝑃𝐸𝑆𝑆𝑡 Power exchange between ESS and electrical framework at time 𝑡.
𝑃ℎ Power value in discrete state ℎ. 𝜑𝑚𝑛 Father-wavelet function.
𝑝𝑖 ANFIS parameter set of membership function. 𝜋𝜔 Probability of scenario 𝜔.
𝑃𝑚𝑎𝑥 Maximum power to be considered. 𝑃𝑚𝑖𝑛 Minimum power to be considered. 𝑃𝑛,𝑖𝑠
𝑡−1 Power production of generator/unit 𝑛 at time 𝑡 − 1 in sampling point 𝑖 𝑠. 𝑃𝑛𝑚𝑎𝑥 Maximum power production of generator/unit 𝑛.
𝑃𝑛𝑚𝑖𝑛 Minimum power production of generator/unit 𝑛.
𝑃𝑛𝑡 Discrete PDF of power production of generator/unit 𝑛 at time 𝑡. 𝑃𝑟(𝑚) Probability of occurrence of a determined scenario 𝑚.
𝜓𝑎𝑏 Mother-wavelet function.
𝑃𝑛 ,𝑚𝑡 Power production of generator/unit 𝑛, at time 𝑡, in scenario 𝑚. 𝑝(𝑡𝑤𝑡) Signal input of wavelet function.
𝑃𝑈𝑆𝑛,𝑚𝑡 Primary unit scheduling of generator/unit 𝑛, at time 𝑡, in scenario 𝑚. 𝑃𝑣 Power through the inverter in EES.
𝑃𝑣𝑟𝑎𝑡𝑒𝑑 Rated power of the inverter in ESS.
𝑃(𝑋) Distribution probability of random variable 𝑋. 𝑞𝑖 ANFIS parameter set of membership function. 𝑟𝑖 ANFIS parameter set of membership function. 𝑅𝑃𝑡 Reference power of ESS at time 𝑡.
𝑅 Last discrete state of beta PDF.
𝑟 Discrete state of beta PDF in interval {0, 1}, 𝑟 ∈ {0, 𝑅} 𝑆𝐷𝑅𝑛 Shutdown ramp rate of generator/unit 𝑛.
𝜎𝑝 Parameter of discretization process. 𝜎 Gaussian standard deviation value.
𝑆𝑂𝐶𝑚𝑎𝑥 Maximum state of charge allowed to be reached by VRB of ESS. 𝑆𝑂𝐶𝑚𝑖𝑛 Minimum state of charge allowed to be reached by VRB of ESS. 𝑆𝑂𝐶𝑡 State of charge at time 𝑡.
𝑠𝑟 Value that corresponds to the discrete state 𝑟. 𝑆𝑅 Spinning reserve variable.
𝑆𝑈𝐶𝑛,𝑚𝑡 Starting-up cost of generator/unit 𝑛, at time 𝑡, in scenario 𝑚. 𝑆𝑈𝑅𝑛 Startup ramp rate of generator/unit 𝑛.
𝜏′ EPSO mutated learning parameter.
𝜏 EPSO learning parameter.
𝜃𝑖𝑠 Sampling point 𝐼 of the interval {𝛾, 1 − 𝛾}.
𝑡𝑓 Ending time of charge of ESS. 𝑡𝑖 Starting time of charge of ESS.
𝑡0 Bound time between the periods of charge/discharge ESS. 𝑡𝑤𝑡 Time-step used in wavelet function.
xx
𝑡 Scheduling time index.
𝑈𝑛 Parameter of the CO2 emission curve of generator/unit 𝑛.
𝑈𝑛,𝑚𝑡 Binary variable of (de)-committed generator/unit 𝑛, at time 𝑡, scenario 𝑚. 𝑈𝑅𝑛 Operating ramp-up rate of generator/unit 𝑛.
𝑉𝑖𝑒 EPSO actual particle velocity.
𝑉𝑖𝑛𝑒𝑤𝑒 EPSO new particle velocity.
𝑉𝑛 Parameter of the CO2 emission curve of generator/unit 𝑛.
𝑉𝑂𝐿𝐿 Value of lost load. 𝑉𝑂𝑊𝐸 Value of wasted energy.
𝑊𝐹𝐸 Increment in spinning reserve due to wind power forecasting error . 𝑤𝑖 ANFIS firing strength.
𝑤𝑖∗𝑒 EPSO weight parameter. 𝑤𝐼𝑁 EPSO inertia weight.
𝑤𝑗𝑡 Value of wind power generation of discrete state 𝑗 at time 𝑡. 𝑊𝑚𝑎𝑥𝑡 Maximum value of available wind power generation at time 𝑡. 𝑊𝑚𝑖𝑛𝑡 Minimum value of available wind power generation at time 𝑡. 𝑤𝑚𝑛 EPSO minimum inertia weight.
𝑤𝑚𝑥 EPSO maximum inertia weight.
𝑊𝑛𝑡 Total wind power generation at time 𝑡 generator/unit 𝑛. 𝑊𝑡 Time series of the total wind power generation at time 𝑡. 𝑤(𝑡𝑤𝑡) Computed mother-wavelet function.
𝑋𝑖𝑒 EPSO actual particle position. 𝑋𝑖𝑒
𝑛𝑒𝑤 EPSO new particle position.
𝑋𝑛 Parameter of the CO2 emission curve of generator/unit 𝑛.
𝑥𝑛𝑡 Scenario time series of wind power nature.
𝑋 Random discrete variable.
𝑦𝑡 Normalized wind power profile at time 𝑡.
𝑌 Random discrete variable.
𝑧𝑏 Generation cost incorporating ESS.
𝑧𝑖𝑠,𝑗 Total generation cost in sampling point 𝑖power generation 𝑗. 𝑠 at discrete state of available wind 𝑧𝑛𝑡 Normalized total wind power generation at time 𝑡 generator/unit 𝑛.
Chapter 1
Introduction
This chapter describes the framework of the electricity industry sector and the new paradigm related to renewable energy sources and their integration in the electricity framework, in particular, wind power capacity. This chapter also describes the motivations that support the proposed work and gives an overview of the organization of the thesis and the notation used.
1.1. Framework
The conversion of energy and its use, since the days when humans first learned to exploit its potential for their own benefit, has been the utmost factor in the growth of the economy and society and their sustainable development. In this way, the energy sector plays an important role in the national economy, since it is the propellant of greater stimulus and dynamism in creating new business and employment opportunities.
Historically, the electricity sector worldwide, before the 1980s, was characterized by a vertical structure of integrated companies (generation, transmission and distribution), which allowed the natural expansion and growth of the electricity infrastructure as a scale economy whose imperative ideology was to minimize production costs. Consequently it came to be regarded as a natural monopoly structure. Nonetheless, during the 1980s the idea of natural monopoly began to be questioned with the advent of new independent electricity producers, since the companies concerned with the transport and distribution of electricity were obliged to acquire the electricity produced by the new electricity producers [1]. Since the 1980s, the worldwide electricity sector has been subject to a constant process of restructuring, which allowed the creation of liberalized electricity markets and a competitive environment among different players, and consequently it allowed the necessary conditions for consumers to be able to participate in the electricity market, i.e., offering their proposed purchase of electricity to different suppliers [2].
The planning, management and exploitation of the electricity system are three important concepts for the electricity companies, which must operate in accordance with the global liberalization of the electricity sector, i.e., manage their operations with a concern to guarantee the rationality, sustainability and robustness of the complex energy mix that makes up the electricity system [3]. Thus, the mechanisms and tools that allow the proper participation in the electricity market should include a number of factors whose objectives are intrinsically related to profit maximization via optimizing the use of electricity system production, i.e., providing adequate support strategies for participation in liberalized electricity markets [4].
2 This new paradigm has not been ignored in Portugal. The initiative of electricity market liberalization happened in the 1990s with Directive 1996/92/CE of the European Parliament and of the Council (published December 19, 1996), whereby the rules for the creation of an internal electricity market were established, and allowing liberalization of the electricity sector. The same liberalization also took into account improvement of the efficiency of the electricity system and increased economic competitiveness [5]. On June 26, 2003, Directive 2003/54/CE of the European Parliament and of the Council was published, which triggered the liberalization of the electricity sector throughout the Iberian Peninsula, allowing the creation of the Iberian electricity market (MIBEL). Such restructuring of the electricity sector had a strong impact on the production and transmission of electricity [6].
In July 2007 MIBEL started its activity, with the expected competitive environment among players in the Iberian market mediated by the futures contracts market operator (OMEL) on the Spanish side, and by the daily and intraday market operator (OMIP) on the Portuguese side. However, it was only in April 2010, with Portuguese Resolution of the Council of Ministers no. 29/2010, that a harmonized MIBEL market was created in which some mechanisms have been defined, notably [7]:
Definition of dominant operators;
Harmonized mechanism of power guarantee;
Definition of an interruptibility mechanism which harmonized the service system.
Resulting from the liberalization of the electricity sector with its competitive environment, there are currently two ways of transacting the supply of electricity:
The bilateral contracts market, which is responsible for the agreements made between buyers and sellers of electricity, relative to the price and the quantity of electricity to be traded, which will later be implemented by the independent system operator (ISO).
The spot market, where the purchases and sale of electricity are made, held by the market operator (MO). The MO determines the quantity of electricity to be produced and the market price of electricity, according to the offers of purchase and sale made by the market players.
After the technical feasibility resulting from the agreements between the ISO and MO operators, related to the technical program of electricity production, a complementary service is also required to ensure the safety, robustness, and quality of the electricity supply.
Nowadays, the activity of electricity production with a liberalized and organized electricity market is associated with a wholesale market, where the producers’ agents present their production and ensure the placement of that production, and agents seek to purchase electricity for two main reasons: one, to satisfy the demand of end customers; and two, for their own consumption. The trading activity is associated with a retail market where the trading agents compete to ensure the provision of electricity for end customers.
3 Monitoring the proper operation of the electricity market in the current liberalized environment is necessary because it is required to follow some characteristics and behavior of others organized electricity markets, as well as the developments in other markets, whose transactions can influence the determination of electricity prices (e.g., fossil fuel trading, carbon dioxide emissions trading, and financial markets, among others) [7]. Therefore an organized electricity market is composed of the following architecture:
The wholesale electricity market, composed of the daily market (where electricity is purchased for the next day); the futures market (where electricity for long-term periods is purchased); and other mechanisms such as bilateral contracts or other specific legal mechanisms [8], [9]:
o The daily market works through the intersection of offers (of buying and selling) by the various agents registered to operate in that market. Each offer indicates the day and time to which it relates with the price and amount of corresponding electricity. Furthermore, it follows its own operating rules;
o The intraday market is where the electricity transacted in the daily market is corrected, in six sessions starting at 20h00 of the previous day (1st session), and ending at 16h00 of the current day (6th session). The electricity price is corrected with the corresponding electricity transaction;
o The futures market which involves instruments of risk management for buying and selling electricity in the future (from one week to one year) between agents. These instruments are agreed under contracts, which can be divided into:
Future contract, which is a standardized contract to buy and sell electricity for a determined horizon time; where the players (producer and buyer) agree with each other to buy and sell electricity at a determined price;
Forward contract, which is similar to the future contract but differs on the final price of the electricity at the time of acquisition of the electricity;
Swap contract, which is a standardized contract where a positional variable price is exchanged for a fixed price, or vice versa, depending on the direction of exchange between the parties. This type of contract is applied to manage or take a financial risk, and it is not for the exchange of any subjacent product.
o Bilateral contract, which can be divided into:
Forward contracting market, where future commitments for the production and purchase of electricity are established;
Daily contracting market, which is divided into daily contracting and intraday-adjustment, and where the programs of production and selling electricity are established for the next day of negotiation;
Service market, where the adjustment between production and consumption of electricity is performed in real time;
Bilateral contract, where the parties contract for the production and purchase of electricity for all different horizon times.
4 The retail electricity market, where any customer can freely choose their electricity supplier. It is also helpful to guarantee the competition between the different operators in a balanced way and to minimize the information asymmetries between consumers and other market agents.
Since the ratification of the Kyoto Protocol in 1999, enhanced by the Climate Conference in Copenhagen in 2009, and the continuous conferences of parties (COP), the last one held in Lima, Peru, in December 2014, campaigners are trying to assess, warn, and encourage all nations to create a set of measures and targets to meet the emerging need for the continued mitigation of anthropogenic greenhouse gas emissions (GHE) around the world [10] to reduce rising seawater levels and mediate global warming.
In Portugal, the challenge of anthropogenic GHE mitigation is addressed through a series of encouraging targets. These satisfy Directive 2001/77/CE of the European Parliament and of the Council of Ministers, published in September 2001, which defined the incentives and motivations for production of electricity by renewable energy sources in order to maintain the standards of equity and sustainability in the whole economy [11]. The targets for the mitigation of GHE include a substantial increase in the share of electricity production from renewable sources (higher incidence of wind energy) through the encouragement of the private sector and consequently reducing the production of electricity from fossil fuels [12]. The endogenous use of renewable energy has a substantial level of social acceptance, it actively contributes to a sustainable economy and reduces dependence on importation of foreign energy. Beyond the inherent ecological advantages, the implementation costs are decreasing [13]. In the renewable energy field, wind power stands out as the most promising, since it is considered a very evolved and mature technology worldwide, with a good relationship between the implementation cost and profitability throughout its lifetime. Therefore, many European governments, despite the epidemic of economic crises which have struck Europe in recent years, have taken great efforts to continue their incentive programs for installing more wind farms or enhancing existing ones, as well as other incentives, and reforming laws to sustain further plans to decarbonize the global electricity system [14]. Such measures to decarbonize the electricity industry are supported by the policy adopted in 2007 by the European Council, i.e., the binding obligation on Member-States to increase by 20% the share of renewable energy by 2020, commonly referred to as the “20-20-20 program”. The policy imposes the following targets [15], [16]:
Reducing the anthropogenic emissions of GHE in 20% relative to 1990 emissions; Increase the amount of renewable energy by 20% in the final energy consumption; Reduce in 20% the total primary energy consumption by increasing the energy efficiency. At the end of 2013, and despite the economic crisis, more than 11,159 wind-power units were installed in the 28 Member States of the European Union (EU28), but with a decrease in installations of 8% compared with 2012.
5 This decrease had a negative impact on regulatory markets, the consequence of political uncertainties throughout Europe, which causes disturbances in legislative frameworks and future investments. Nevertheless, wind power capacity represents 32% of total power capacity installed in Europe, i.e., 5% more than in 2012. Furthermore, since 2000 more than 28% of the total renewable power capacity is derived from wind power.
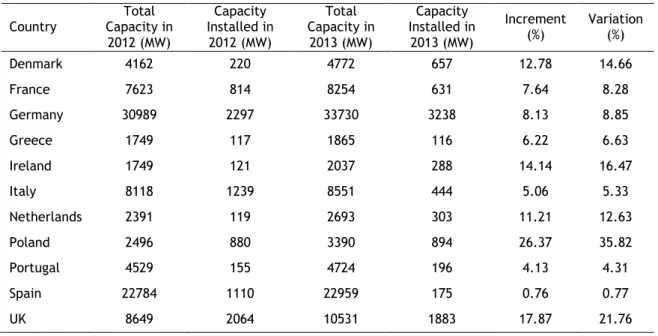
Table 1.1 shows the total wind power capacity installed in EU28 (onshore capacity), where some countries such as Germany, Spain, United Kingdom, Italy, France, Denmark and Portugal stand out. Other countries show a noticeable increment of wind power capacity installed between 2012 and 2013. Figure 1.1 shows the total power capacity from 2008 to 2013 in MW and shared renewable power capacity in the EU28 (light green area), representing 72% at the end of 2013. The high contribution of wind power capacity over the years, which is briefly described in [17] is also shown in Figure 1.2.
In the case of Portugal, and despite the deep economic crisis that has affected other areas in this country, the harnessing of endogenous renewable energies and the decarbonization of the electricity sector has not been set aside. The constant demands to face new challenges are faced with new strategies such as the Resolution of the EU Council of Ministers no. 20/2013, which reinforces the ambitious Portuguese strategy for 2020, for a sustainable and progressive decarbonization of the electricity sector, through the “National Action Plan for Energy Efficiency” (PNAEE) and the “National Action Plan for Renewable Energy” (PNAER). As shown in Figure 1.3, the integration and penetration of renewable energies into the electricity framework in Portugal from 2005 to July 2014 has deeply modified the dynamic behavior of the electricity generation mix [18], which requires appropriate studies to maximize the use of the available renewable potential. It also shows the relevance of renewable energy, which reached 4808MW at the end of July 2014.
Table 1.1. Total wind power capacity installed in some countries in EU28 [17].
Country Capacity in Total 2012 (MW) Capacity Installed in 2012 (MW) Total Capacity in 2013 (MW) Capacity Installed in 2013 (MW) Increment (%) Variation (%) Denmark 4162 220 4772 657 12.78 14.66 France 7623 814 8254 631 7.64 8.28 Germany 30989 2297 33730 3238 8.13 8.85 Greece 1749 117 1865 116 6.22 6.63 Ireland 1749 121 2037 288 14.14 16.47 Italy 8118 1239 8551 444 5.06 5.33 Netherlands 2391 119 2693 303 11.21 12.63 Poland 2496 880 3390 894 26.37 35.82 Portugal 4529 155 4724 196 4.13 4.31 Spain 22784 1110 22959 175 0.76 0.77 UK 8649 2064 10531 1883 17.87 21.76
6 Figure1.1.PowercapacityinEU28from2008till2013inMWandsharedrenewablepowercapacity [17].
Figure 1.2. Wind power capacity evolution in Europe between 2001 till 2013 in MW in onshore and offshore installation [17].
Meanwhile, from January 2005 to July 2014, renewable thermal generation (biomass, biogas, solid urban waste plants (SUW), and geothermal) increased from 447MW to 752MW, overall hydro power plants from 4816MW to 5535MW, and photovoltaic power plants (PV) from 3MW to 332MW. In the final results, the total renewable capacity represents 24% of total primary energy consumed in Portugal at the end of 2012, of which 21% was related to wind power, and also a substantial reduction of 4618ktoe of conventional equivalent thermal energy with equivalent GHE reduction [19]. Wind energy is a mature and viable technology economically, in comparison with other renewable endogenous energies. It contributes to a significant reduction of GHE and also encourages competition in today’s liberalized electricity markets due to its intermittency and volatility. In other words, the electricity frameworks face the need for greater flexibility and adaptability in terms of fluctuations and also demand variation because, in comparison with other renewables integration, wind energy is itself a non-dispatchable energy, in comparison with classical generation units (thermal or hydro power plants) [20]. 0 5000 10000 15000 20000 25000 30000 35000 40000 45000 50000 2000 2001 2002 2003 2004 2005 2006 2007 2008 2009 2010 2011 2012 2013 Po w er In st al le d (M W ) Year
Wind PVall* Ocean Hydro
Ren.Thermal** Conv.Thermal*** Nuclear * PV + CSP
** Waste + Biomass + Geothermal *** Gas + Coal + FuelOil + Peat
0 2000 4000 6000 8000 10000 12000 14000 2001 2002 2003 2004 2005 2006 2007 2008 2009 2010 2011 2012 2013 Pow er I ns ta lle d (M W ) Year Onshore Offshore
7 Figure 1.3. Overall renewable energy capacity installed in Portugal from January 2005 till July 2014[19]. Therefore, it is necessary to differentiate the concepts of intermittency and volatility. Intermittency is an event that starts but abruptly culminates, whereas volatility is related to fluctuating variation around the trend line [21]. To represent these characteristics, Figure 1.4 shows the profile of wind power during one week of January 2014 in Portugal, in which it is possible to observe the difference between intermittency and volatility along a hypothetical trend shape of the wind power profile [22].
Regarding the consumption of fossil fuels and their use in the Portuguese electricity sector, it should be noted that there are ambitious plans for a gradual decommissioning of the biggest thermal power plants (mostly coal) between 2017 and 2030. However, despite the importance of gas for the robustness and quality of service of the electricity sector, Portugal will be dependent on natural gas supplies from Algeria and Nigeria, which requires a future improvement of infrastructure for its storage. Notwithstanding, there are some interesting plans for the reinforcement/replacement of 10% of the power generated by these conventional plants by biomass and natural gas power plants. These measures are planned in order to guarantee the energy mix of electricity production, the robustness and quality of service, and also to help in attenuating as much as possible the marginal costs of electricity, and finally to maintain competitiveness with other electricity markets [9].
Moreover, there are some studies that show a reduction of competitiveness in the Portuguese electricity market in the coming years, mainly because of the increment of the marginal cost of electricity. However, it will be easier in the coming years to export surplus electricity due to the strengthening of electricity connections between Spain and France, which will allow an increased flow of electricity produced in the Iberian Peninsula [23]. It should also be noted that, in order to minimize the impact of decommissioning the conventional thermal power plants in Portugal in the coming years, the necessary conditions are being created to increase the harnessing of hydro energy, i.e., by the construction of hydro power plants, either by strengthening existing plants or the construction of new hydro reversible plants (which allow more energy storage by converting the electricity surplus into potential surplus energy).
* Biomass+Biogas+SUW+Geothermal ** July 2014 results 0 2000 4000 6000 8000 10000 12000 2005 2006 2007 2008 2009 2010 2011 2012 2013 2014** Pow er I ns ta lle d (M W ) Year Hydro Wind Thermal* PV
8 In the final calculation, the previously stated contributions will allow a reduction of Portugal’s GHE to about 8Mton in the coming years, compared with the current emissions of 14.4Mton, which is significant. Finally, it is also important to note that there are more details that could be analyzed from the Portuguese national electricity system (SEN) report for the period 2013-2030 [24], but which are outside the scope of this work. Figure 1.5 shows the actual mix of electricity production in Portugal. Note the importance of wind energy as a slice of overall electricity production and the weight of thermal units (including biomass, natural gas and SUW plants) [23].
The energy storage system (ESS) is one of the answers for the new paradigm shift in renewable grid integration and the advent of smart grids, which helps to increase the flexibility of the generation mix, mitigating the stochastic nature of the impact of renewable electricity production in the electricity framework. Hydro storage or pumped hydro is the oldest and cheapest solution for this purpose, but it needs a favorable chain and adequate physical conditions, among others.
Figure 1.4. Wind power profile showing intermittency and volatility.
Figure 1.5. Distribution of Portuguese electrical mix production in 2013 [23].
168 Volatility
Intermittency
9 Some pilot projects related to battery technologies are based on small-scale storage units, for self-consumption (in small industries), residential purposes or in locations highly dependent on fossil energy with high retail prices, such as islands, other isolated locations or those with less profitable hydro resources. Meanwhile, the same study concludes that, with adequate innovative policies and regulation, the final cost of the available technologies in ESS will be reduced in the following years making such options profitable.
The work that has been developed in this thesis is intended to produce new contributions by formulating mathematical models to be inserted in computational applications for decision and management support.
The aim is to combine the stochastic and volatility behavior of electricity market price forecasting, the volatility and intermittency of wind power behavior, the uncertainty related to wind power forecasting when wind power and conventional thermal electricity production are combined, applying also the possibility of small energy storage systems, usually found as pilots in island systems, which will be taken as examples for real application.
From the analysis of the literature review carried out during the research work, there are several challenges that the power systems industry and the scientific community have been facing in last years, namely:
Reduction of fossil fuel dependency and mitigation of GHE;
Development of computational tools for decision support with higher accuracy and improved proficiency;
Harmonization between conventional and renewable power production, helping to increase the overall flexibility of the system;
Reduction of generation costs in a sustainable and reliable manner; Development of algorithms for managing ESS based on batteries.
In summary, it is important in the context of Industrial Engineering and Management to develop innovative computational tools for the sustainable management of power systems, with a special focus in this thesis on the insular power systems industry. The following research topics are addressed in the forthcoming chapters:
Electricity market prices and wind power forecasting, combining advances techniques such as mutual information (MI), wavelet transform (WT), evolutionary particle swarm optimization (EPSO) and adaptive neuro-fuzzy inference system (ANFIS), in real applications;
Solving the economic dispatch (ED) problem using heuristic and stochastic approaches, in order to incorporate wind power forecasting error, system reliability and net load uncertainty. A probabilistic point of view using different configurations of conventional generation will be applied to an insular electricity framework;
10 Solving the unit commitment (UC) problem using a stochastic approach under high wind power penetration, with several case studies using different configurations of conventional generation and scalability;
Devising a strategic way to manage an ESS via battery configuration, combining conventional thermal generation and renewable generation in an insular electricity framework.
The approach developed for forecasting electricity prices and wind power has a stochastic feature. Uncertainty is the utmost important factor to be considered in rational decision making, since the omission of its influence can radically stimulate the correct benefits associated with wind energy exploitation. Most of the decisions are based on forecast profiles which lead to increasing difficulty, since the usual lack of information in datasets collected to create a forecast profile may make the decision-making processes more difficult. Furthermore, the scalability problem of the electricity framework, associated with the increased uncertainty of wind power forecasting, the increasing integration of renewable potential with its stochastic nature in the electricity framework, the storage cost (new strategies, or conventional strategies – hydro resources), and even the strategies and decisions may lead to increased costs of electricity production by conventional thermal power plants, which can translate to a waste of resources, increased GHE, and the diversion of government decarbonizing objectives in the electricity system.
Thus, treating the aforementioned topics in their different stages could provide major contributions to help the different players in the electricity system, enabling a rational and effective decision-making. It may ensure the correct co-existence of a robust and high quality energy production mix, contributing also to future lines of research to create efficient computational tools on the topic of sustainable management of power systems, given the advent of smart grids.
1.2. Motivation
An insular power systems industry is one where the entire electricity power grid infrastructure is physically located in an isolated geographical area surrounded by water. Typically, these have several limitations, including among others and [25]:
Limited range of natural resources; Limited economies of scale; Seasonal population;
Higher infrastructure costs;
Distance from the mainland prevents interconnection of electricity supply; Different climatic conditions and microclimates from the mainland.
11 These limitations lead to negative outcomes such as dependency on overseas trade, economic weakness reducing the possibilities to play in conventional markets, the oversizing of infrastructures including the electricity industry, and vulnerability to climate change. Moreover, islands are heavily dependent on imported fossil fuels, and lack availability of fresh water and capacity for proper management of SUW, among other factors that directly affect the insular economy.
Such island economies have as their main revenue the inflows generated by seasonal tourism, which also creates indirect challenges to be overcome, such as the seasonal increment of population, resources management, and cost per tourist during their stay, among others. Natural resources such as fresh water may be compromised, making it necessary to resort to desalination processes or import fresh water, which undermines the local economy even more and the energy requirements [26]. In this sense, the oversizing of infrastructure, including the electricity framework, is a reality which makes its exploitation more expensive.
The mitigation of dependence on imported fossil fuels, especially for electricity production, is an important parameter for the economic sustainability of insular areas. Electricity production from fossil fuels is costly, especially due to transportation costs. Thus, the utilization of local and endogenous resources, mainly renewable energy systems, is of the utmost importance in many energy policies especially during the last decade, and the structures of electric power grids have started to change significantly with the recently increasing interest in renewable energy systems.
Compared with mainland electricity industries, the insular electricity grid structures are more sensitive to power quality issues, such as frequency and voltage deviations, especially if the level of penetration of renewable energy resources is high. Insular electricity grids have lower inertia due to the lower number of generating units connected to the framework. This makes them more vulnerable to large range frequency and voltage deviations, rendering the system reliability and security constraints more fragile. Moreover, the policies that allow the penetration of renewable energy resources in the electricity industry are limited.
In this sense, the insular power systems industry in general is considered as a good starting point for research and improvement and also for testing the impacts of new technologies and strategies for future technological advancements, ultimately including the advent of smart grids [25], [26].
Electricity frameworks in insular systems, can be classified according to their daily peak power demand (in MW) and annual energy consumption (in GWh) [27]:
Very small islands: Less than 1MW per day and 2GWh per annum; Small islands: Within a range of 1-5MW and 2-15GWh;
Medium islands: Within a range of 5-35MW and 15-100GWh; Big islands: Greater than 35MW and 100GWh.
12 Usually, the insular power systems industry is composed of a few conventional thermal units, especially in the case of very small and small islands. As stated previously, the inertia of the total system is significantly lower and the current status of insular power systems can be considered unreliable due to possible outages and fuel shortages, having such a small number of generating options that may reduce reliability and economic sustainability. In other words, the technical and nontechnical losses in insular areas are proportionately higher compared with the mainland, inciting the increase of fuel utilization and increasing the unit cost of electricity. Moreover the overall efficiency in the operation of insular power systems is significantly lower, which adds further economic burdens on energy companies and end-user customers [28]. Despite there being some successful examples of liberalization of electricity markets in the world, there are still constraints to be overcome in islands due to several barriers, [25] such as :
In contrast with a continental electricity industry, an electrical unit in an island cannot have significant capacity due to system security reasons;
The island electricity framework needs more reserve capacity than a continental electricity framework due to isolation and consequently the incapacity of interconnections with other electricity frameworks;
Electricity production in islands is more costly (usually 2 to 5 times more) for the reasons given above, related to fuel provision and consumption;
The geographical and local factor limitations of islands do not allow investment in conventional power plants, due also to social and seasonal factors;
Renewable energy resources are the best candidates for the improvement of electricity production; however, the security issues of the electricity network and its stochastic nature limit their integration.
The aforementioned concerns may affect the economical sustainability of insular areas. As a real example, the electricity energy prices for end-users in insular areas varied between 25 and 34 cents per kWh, while the same cost was in the range of 10 to 14 cents per kWh in the mainland for the United States in 2005 [26]. The cost of electricity for residential and commercial end-users was approximately 31 cents per kWh in September 2010, 40 cents per kWh in December 2012, and 42 cents per kWh in the third quarter of 2013 in American Samoa [29]. It is clear that the price was significantly volatile in a short time period for Samoa, an insular area, largely due to the higher cost of fuel. Another reason for this cost difference is the increasing percentage of maintenance events, due to the aging of the electricity infrastructure [25].
Another example of these issues is located in Sicily, Italy, where the Ministry of Industry gives support [30] to improve and renew the electricity system. However, this is not common to all the cases and is also an additional burden on the economy of the country. As stated before, most islands do not have any exploitable fossil fuel sources [25].
13 An example of this is the case of the Canary Islands, Spain, where 94% of the electricity generation depended on imported fuels in 2010 [31]. Similarly, the island of Cyprus uses exclusively heavy fuel oil and diesel for electricity generation [32]. However, at present, there are some interesting cases of opportunities and challenges for insular power systems industries, showing valuable results in islands around the world. Some of these cases involve a high level of integration of renewable and endogenous resources; they are listed in brief below according to [25]:
In 2010, PV farms generating 112MW were installed on the Canary Islands. Furthermore, the Canary Islands Energy Plan aims to have 30% of the electricity produced by RES, mainly solar (160MW) and wind (1025MW) [31];
Due to the commitment of Cyprus to comply with the EU 2020 obligations, the country developed a program (National Renewable Energy Action Plan of Cyprus) that, among other targets, aims to install 192MW of PV farms and 75MW of concentrated solar power (CSP) by 2020 [32];
In Rhodes, Greece, approximately 6% of the energy production comes from the 11.7 MW of installed wind power farms [33]. The biggest Greek island, Crete, has an installed wind capacity of 105MW, which accounts for 12.5% of the total capacity; however, the total licensed capacity exceeds 200MW; Furthermore, Crete is expected to have installed 140MW of solar energy by 2030 [34];
In 1998 Samso Island was chosen by the Danish government as a pilot island to achieve 100% of electricity production from renewable resources, with more than 23MW of offshore and 11MW of onshore wind capacity, sufficient to satisfy the demand. The Spanish island of El Hierro is also subject to an ambitious target of becoming a 100% renewable energy island and currently wind power penetration has reached 30% [35];
In Pantelleria, Italy, studies have shown that it is possible to install a plant generating 2.5MW of geothermal power. It may be possible to achieve a production of 20,000MWh per year, representing about 46% of the island’s consumption [36];
The government of the Azores has launched an ambitious plan to achieve 75% of renewable electricity production by 2018. Reflecting this ambition is the additional investment in geothermal plants in the major island (São Miguel) [37];
Furthermore, other endogenous and renewable energy resources such as biomass, urban waste and wave or tidal energies are being studied in some pilot islands around the world. Hence, this thesis has the objective to respond to the impact of the inherent challenges of electricity supply to islands. In detail, it focuses on the lines of research designed to support the decisions and management of the electricity companies which are the owners of conventional electricity conversion systems, renewable energy systems, or a combination of both for electricity conversion. In addition, this thesis also aims to analyze the different methodologies currently used, with a critical appreciation, and also to introduce several new contributions that address the uncertainties in the sustainable management of existing resources, seeking to provide viable solutions for the electricity industry.
![Figure 1.2. Wind power capacity evolution in Europe between 2001 till 2013 in MW in onshore and offshore installation [17]](https://thumb-eu.123doks.com/thumbv2/123dok_br/18660314.913098/26.892.161.779.107.415/figure-wind-capacity-evolution-europe-onshore-offshore-installation.webp)