Universidade de Lisboa
Faculdade de Ciências
Departamento de Biologia Animal
Comparison of brain and cranial nerve morphology
between eyed surface fish and blind cave fish of the
species Astyanax mexicanus
Fábio Ribeiro Rodrigues
Mestrado em Biologia Evolutiva e do Desenvolvimento
2013
Universidade de Lisboa
Faculdade de Ciências
Departamento de Biologia Animal
Comparison of brain and cranial nerve morphology
between eyed surface fish and blind cave fish of the
species Astyanax mexicanus
Fábio Ribeiro Rodrigues
Dissertação
orientada por
Doutor Yoshiyuki Yamamoto (UCL)
Orientador
Interno:
Profª.
Doutora
Sara Magalhães (CBA/FCUL)
Mestrado em Biologia Evolutiva e do Desenvolvimento
2013
Acknowledgements/Agradecimentos
There are several individuals that have to be thanked, and perhaps some of them will not be listed, but I will do my best.
To Dr Yoshiyuki Yamamoto, who accepted me in his lab, supported my stay here and opened a lot of possibilities for my future. No words can express my gratitude.
To Dr Mathilda Mommersteeg (Tilly), for all her help in dealing with some parts of the scientific process, for the sectioning and Amira) and for the moral support (in the form of caffeine or frappuccino).
To Mark Hajawi from Tim Arnett’s lab, that helped us with the micro-CT scanning.
To Monica Folgueira, for the help with the confocal imaging, and all the corrections she made! To Elizabeth Ward (Lizzie) from Claudio Stern’s lab, for her availability to teach me how to operate the OPT.
To Dr Brian Metscher, who even from afar tried to help me the best way he could.
To Simone Villari, for all his patience and support which were indispensable to get me through this year.
Ao Prof. Dr. Élio Sucena, por todo o apoio prestado enquanto me encontrava no estrangeiro, bem como pelas recomendações que enviou. Muito obrigado!
À Prof.ª Dr.ª Sara Magalhães, pela ajuda e disponibilidade que demonstrou e por todas as correcções e indicações dadas!
À Prof.ª Dr.ª Sólveig Thorsteinsdóttir, pelo apoio prestada à distância e pela disponibilidade em ajudar no que fosse preciso.
A todos os restantes Professores que construíram e fazem parte deste Mestrado, um grande obrigado pelas oportunidades que dão pois, mesmo com todas as adversidades, principalmente económicas, conseguem abrir portas a um mundo de possibilidades e, mais importante ainda, conseguem transmitir a sua paixão 365 dias por ano.
Finalmente, aos meus pais e irmãs, que me apoiaram em tudo durante este ano e, mesmo que difícil, fizeram o possível e impossível para me ajudar. Um grande obrigado!
i
Sumário
O Sistema Nervoso Central (SNC) de qualquer vertebrado desenvolve-se a partir de uma estrutura semelhante, fazendo uso dos mesmos factores. A placa neural embrionária, através da acção coordenada de Wnts, FGFs, Sonic Hedgehog e BMPs, é padronizada nos seus eixos Antero-Posterior e Dorso-ventral. Estes mesmos factores desencadeiam o desenvolvimento de organizadores secundários no sistema nervoso que vão actuando de uma forma gradualmente mais localizada. Como resultado, cinco vesículas cerebrais são formadas: Telencéfalo, Diencéfalo, Mesencéfalo, Metencéfalo e Mielencéfalo. Os mesmos factores actuam posteriormente no controlo da proliferação de células progenitoras neurais.
Esta organização corresponde ao arquétipo cerebral de qualquer vertebrado a partir da qual toda a diversidade morfológica que se verifica na natureza é gerada. Pequenas modificações em qualquer um destes três momentos do desenvolvimento do SNC (padronização, regionalização e neurogénese, respectivamente) podem alterar a morfologia final do encéfalo. No caso dos teleósteos e peixes cartilagíneos, regiões específicas do cérebro apresentam expansões relativamente ao resto do cérebro conforme o input sensorial – a título de exemplo, os tubarões apresentam geralmente cerebelos mais desenvolvidos dado o grau de mecano- e electrorrecepção, enquanto teleósteos apresentam maiores expansões do tecto óptico, que responde ao input visual. Parece de facto haver uma correlação entre a alteração de diferentes regiões do cérebro e o nicho que as espécies ocupam. Estas observações estão de acordo com a hipótese de Evolução em Mosaico, que afirma que diferentes regiões do cérebro alteram-se conforme as exigências ecológicas do meio que a espécie ocupa. Esta teoria contrapõe-se à ideia de que constrangimentos no desenvolvimento do cérebro levam à modificação coordenada do desta estrutura como um todo. No entanto, para perceber como o SNC evolui, é necessário mais que descrever diferenças anatómicas e correlacioná-las com o meio. É igualmente indispensável entender quais os mecanismos responsáveis por estas alterações, quando é que estes foram modificados e que forças levaram à retenção dessas alterações. Infelizmente, os modelos animais mais utilizados não nos garantem respostas a todas estas perguntas.
A espécie de teleósteo Astyanas fasciatus mexicanus é originária da América Central e é composta por populações de superfície com um fenótipo perfeitamente similar ao de outros peixes. Esta espécie apresenta também um morfotipo cavernícola que, embora tenha divergido significativamente do seu ancestral, não atingiu o isolamento reprodutor. É, portanto, possível gerar híbridos férteis ao cruzar ambos os morfotipos. A colonização das cavernas terá ocorrido há cerca de 8 milhões de anos, tendo havido segunda onda de colonização mais recente estimada nos 3 milhões de anos que originou outras populações. No meio cavernícola, as populações não são predadas e encontram-se num ambiente relativamente estável. Contudo, este ambiente pode ser particularmente hostil dada a falta de alimento durante a estação seca e à hipoxia do meio aquático. Todos estes factores poderão ter gerado pressões selectivas grandes o suficiente para permitir divergências genéticas e fenotípicas entre populações de superfície e cavernícolas. Não se pode excluir o papel da deriva genética, pois dada a escassez de alimento e o isolamento, é de prever que as populações estejam sujeitas à acção de bottlenecks periódicos, promovendo a erosão da diversidade genética destes grupos. Estas populações cavernícolas evoluíram independentemente um fenótipo convergente: perda de pigmentos, expansão da linha lateral craniana, maior número de papilas gustativas e degeneração dos olhos. Todas estas características, bem como a possibilidade de fazer análises moleculares, tornam esta espécie num excelente modelo para estudar evolução do SNC.
ii A expansão da linha lateral permitiu aumentar a capacidade de mecanorrecepção deste morfotipo, compensando a perda da visão que é tradicionalmente considerada um sentido dominante em teleósteos. Sabendo que a degeneração dos olhos resultou numa redução do tecto óptico – região do cérebro que responde a estímulos visuais –, é expectável que o incremento no input proveniente da linha lateral tenha resultado em modificações de outras regiões do cérebro. Há, no entanto, várias outras modalidades sensoriais (olfacto, paladar, tacto) que poderão ter sido modificadas no ambiente cavernícola, à semelhança da linha lateral, permitindo que indivíduos consigam lidar com as adversidades deste meio.
Qualquer informação sensorial é transmitida ao cérebro através de nervos cranianos. Estes são tipicamente doze, mas em vertebrados basais, como teleósteos, estes são dez (excluem-se os nervos XI, acessório e XII, hipoglossal). No entanto, dada a capacidade de mecanorrecepção deste grupo de vertebrados, estes possuem ainda os nervos anterior e posterior da linha lateral. No caso de Astyanax, sabe-se que houve uma redução do nervo óptico (II) – o que está em parte associado à redução do seu respectivo órgão sensorial. Nada se sabe em relação aos outros nervos.
Desta forma, definimos como objectivo deste projecto descrever morfologia dos nervos cranianos e do cérebro em ambos os morfotipos, de forma a perceber como é que o ambiente cavernícola afectou quer o input sensorial quer os respectivos centros no cérebro. As medições foram realizadas em indivíduos criados no mesmo ambiente e em dois estadios, a cinco dias depois da fertilização (larvas) e a um ano de idade. A medição robustez dos nervos cranianos e o volume de diferentes regiões do cérebro nestes dois estadios permitiu comparar diferenças definidas durante o desenvolvimento e outras que pudessem aparecer mais tarde na ontogenia. As medições de volume do encéfalo foram feitas através de microtomografia computacional (micro-CT), uma técnica de imagiologia baseada em raios-X. Esta permitiu realizar reconstruções 3D do encéfalo dos peixes em ambas idades após um tratamento com ácido fosfotúngstico para marcar tecidos não mineralizados. Através destas reconstruções, foram medidos os volumes do cérebro, bolbo olfactivo, telencéfalo, tecto óptico, hipotálamo e cerebelo. Esta técnica permitiu ainda a medição dos nervos cranianos de espécimes adultos. Para medir e comparar nervos cranianos das larvas, fez-se um ensaio imuno-histoquímico para tubulina-α acetilada, marcando os axónios destes nervos para serem visualizados em microscopia confocal. As imagens obtidas foram usadas para fazer reconstruções 3D dos nervos cranianos de modo a medir as respectivas áreas de secção.
Como resultado, reportamos que para além do nervo óptico, os nervos associados com os músculos do olho (oculomotor e troclear) têm também um menor diâmetro no morfotipo cavernícola. Para além disto, os nervos trigémeo e linha lateral anterior têm uma maior área de secção no mesmo morfotipo, representando um possível incremento no input somato- e mecanossensorial, respectivamente. O cérebro da forma cavernícola aparenta ter um menor volume que o dos peixes de superfície, o que pode representar uma adaptação importante ao ambiente hipóxico e à falta de recursos alimentares.
Ao contrário do que sugerido por trabalhos anteriores e contra as expectativas de uma coordenação entre modificações sensoriais e cerebrais, o telencéfalo, hipotálamo e cerebelo aparentam ser relativamente menores neste morfotipo. Verificou-se que o tecto óptico, a região do cérebro que responde ao input visual, se encontra subdesenvolvido. Isto é verificado ainda na fase larvar, evidenciado que esta redução pode ser uma característica já fixa no código genético da população cavernícola. O bolbo olfactivo aparenta representar uma maior fracção
iii do cérebro no morfotipo cavernícola. Muito embora a análise efectuada não revele diferenças no hipotálamo, telencéfalo e cerebelo deste morfotipo, é importante referir que trabalhos anteriores descrevem alterações no número de neurónios que constituem os núcleos cerebrais nos peixes cavernícolas, causando modificações comportamentais. Assim, nesta fase incipiente do processo de especiação, as principais diferenças no SNC de ambos os morfotipos podem assentar nos diferentes núcleos cerebrais, sendo estas talvez mais relevantes para garantir a sobrevivência da forma cavernícola num ambiente hostil.
Palavras-chave
iv
Abstract
Understanding how the brain evolves in response to new environmental situations is key to comprehend not just the developmental mechanisms underlying the generation of variability in brain patterns, but also to understand how the animal’s perception and mental representation of their environment evolves. With this idea in mind, we described the differences in cranial nerve and brain morphology between the eyed surface form and the blind cave of Astyanax fasciatus mexicanus using micro-CT technology. This is, to our knowledge, the first time this method is employed for neuroanatomical studies. Comparisons were performed at both five day old and one year old fish. Our results show a topological conservation of cranial nerves in both morphotypes with significant reductions in visual related nerves in the cavefish along with a reduction in the optic tectum. We also found an increased robustness of the trigeminal and anterior lateral line nerves, responsible for somato- and mechanosensory input, respectively. At 5 dpf the surface fish brain is bigger than the cavefish and no differences were found between different regions. The overall adult brain volume of cavefish is approximately 20% smaller in the cavefish, which is also accompanied by a reduction of its telencephalic, hypothalamic and cerebellar regions. The olfactory bulb appears to circumvent this trend, showing signs of enhancement. This overall reduction shows that energetic constraints may be of significance in shaping the overall morphology of the brain the cave environment.
Keywords
v
Table of Contents
INTRODUCTION ... 1
MATERIALS AND METHODS ... 6
ANIMAL REARING AND MANIPULATION ... 6
MICRO-CT SAMPLE PREPARATION AND IMAGING... 6
VOLUME MEASUREMENTS ... 7
LENS MANIPULATION ... 7
ENZYME METALLOGRAPHY, PARAFFIN SECTIONS AND OPT ... 8
CONFOCAL IMAGING OF ACETYLATED Α-TUBULIN STAINING ... 8
CRANIAL NERVE 3D RECONSTRUCTIONS AND MEASUREMENTS ... 8
DII INJECTIONS ... 9
STATISTICAL ANALYSIS ... 9
RESULTS ... 10
LENS MANIPULATION IN SURFACE FISH ... 10
ENZYME METALLOGRAPHY ... 10
IMMUNOSTAINING IN PARAFFIN SECTIONS ... 11
OPT ... 12
CONFOCAL IMAGING, RECONSTRUCTION AND CRANIAL NERVE MEASUREMENTS ... 12
ADULT CRANIAL NERVE RECONSTRUCTION AND MEASUREMENTS ... 14
BRAIN MORPHOLOGY ... 19
DISCUSSION ... 27
METHODOLOGY ... 27
VISION RELATED NERVES ... 27
OLFACTORY AND OCTAVOLATERAL NERVES ... 28
TRIGEMINAL AND LATERAL LINE MODIFICATIONS ... 28
CHANGES IN BRAIN SHAPE AND MORPHOLOGY ... 29
THE TECTUM AND OLFACTORY BULB ... 29
THE CASE OF THE TELENCEPHALON,HYPOTHALAMUS AND CEREBELLUM ... 30
ON THE ORIGIN OF CNS DIFFERENCES ... 31
CNS EVOLUTION IN ASTYANAX ... 32
REFERENCES ... 33
SUPPLEMENTS ... 38
MATERIAL AND METHODS ... 38
Acetylated α-tubulin staining for Micro-CT imaging ... 38
Acetylated α-tubulin DAB staining ... 38
OPT preparation and imaging ... 39
Paraffin sectioning, immunohistochemistry and reconstruction ... 39
Lens deletion in surface fish ... 40
SUPPLEMENTAL FIGURES ... 40
Cranial nerve 5 dpf ... 40
Ratios of different regions across stages ... 42
Ratios at 5 days without the Tectum ... 42
1 “As long as our brain is a mystery, the universe, the reflection of the structure of the brain, will also be a mystery.”
Santiago Ramón y Cajal
Introduction
For almost a century, scientists have been attempting to describe and grasp the complexity of the system that detects environmental signals and constructs complex behaviours in response to such stimuli. Ever since Santiago Ramón y Cajal, we have come to understand how different types of neurons are distributed in several nervous tissues and what is the functional significance of such organisation. The central nervous system (CNS) develops, like all other systems, through complex signalling networks that are responsible for (i) its patterning, (ii) for its further compartmentalization and, finally, (iii) for the neurogenic process [1-5]. Although these networks are well conserved across all vertebrates, they may have different outcomes based on some variances, such timing or duration of activity [2, 6-9].
As a consequence of such alterations, a large array of adult brain morphologies arises in all vertebrate lineages which, astoundingly, derive from the same embryonic bauplan. These different adult morphologies appear to correlate with both sensory and ecological demand of each species niche. Cartilaginous fishes for instance, seem to have enhanced olfactory bulbs (OBs) and cerebellum. The former is an anterior region responsible for olfaction and the latter performs sensory-motor integration and processes mechanoreceptive input [10]. In most teleosts however, the optic tectum (TeO), which receives direct input from the eyes, is, in most teleosts, a dominant sensory brain region [10, 11]. Modifications like this are detectable in smaller phylogenetic scales and can also be correlated with the animal’s environment. Some species of carps (Cyprinids) rely mainly on gustatory input to cope with their environment, thus having specifically enlarged brain nuclei in the hindbrain to respond to such stimuli [10]. Specific sensory needs appear to have a strong influence on the degree of morphological change that the brain undergoes. This is in agreement with the theory of Mosaic Brain Evolution, which suggests that overall brain morphology can be changed by the expansion/reduction of specific brain regions independently of others. Another theory considers how functional association of these different parts constrains the levels of plasticity in brain morphology, hence its name Developmental Constraints theory. It proposes that such constraints cause coordinated changes between regions, resulting in larger or smaller brains which are scale-up/down versions, respectively, of the ancestral morphology. Both theories can be largely explained by specific genetic changes that affect CNS development [5, 10, 12]. Such alterations cannot proceed on their own, as modifications in specific brain regions should be in agreement with changes in both sensory input and effector output. The structures responsible for conveying afferent information to the brain as well as the appropriate efferent output are termed Cranial Nerves (CNs).
CNs have both a motor and sensory component and their nuclei develop in the hindbrain and midbrain. These nuclei exist in different rhombomeres and produce pioneering efferent axons which will exit the brain and follow paths towards specific muscles/structures. Afferent axons from peripheral organs find their way into the brain and develop sensory ganglia outside of the brain. To certain extent and not always, both motor and sensory components bundle together. Functionally, CNs communicate external signals to the brain but also transmit motor responses and control several different “autonomous actions” such as breathing and swallowing [13]. There twelve CNs: Olfactory Nerve (I); Optic Nerve (II); Oculomotor, Throchlear and Abducens (III, IV and VI, respectively), all controlling different eye muscles; Trigeminal (V), jaw muscle innervation and associated structures (like teeth); Facial (VII), responsible for gustatory
2 information and facial muscle control; Acoustic or Octavolateralis (Ole) in fish (VIII); Glossopharyngeal (IX), pharynx innervation; Vagus (X), visceral innervation; Accessory (XI), neck muscles; and Hypoglossal (XII), tongue muscle innervation. This general CN organisation is shared by most vertebrates, but there are variations beyond this description. Fish for instance do not have CN XI or CN XII, but they possess a nerve that transmits input captured by mechanoreceptive structures termed neuromasts. The neuromasts are organised into the Lateral Line System (LLS) and its sensory information is directed to the brain through the Anterior and Posterior Lateral Line Nerves (ALLN and PLLN, respectively) [10, 14]. The sensory/afferent portion of some CNs develop through contributions of neural crest and neurogenic placodes, forming sensory ganglia and specific types of neurons (sensory bipolar neurons) [10]. It is also expected that these structures, as well as their respective processing centres, can undergo modifications as a result of ecological demands.
Intrinsic CNS differences between organisms result from the “tinkering around” with these different “modules” (both at the brain and at the CN level), which are further refined by years of natural selection. But studying the evolution of this system requires the appropriate set of questions (“What?”, “When?”, “How?”, and “Why?”) [8] and a model organism that can provide answers. Astyanax fasciatus mexicanus, a fresh water fish species, has particularities that make it an exceptionally good model to answer such questions. This species consists of an eyed surface fish, widely distributed in northeastern Mexico and southern USA, and several eyeless cave populations (cavefish) throughout Central America [15]. This species belongs to the order Characiformes (family Characidae) and the first Astyanax cavefish were discovered in limestone caverns in northeastern Mexico [16]. They have been described as different species, but due to their interfertility, surface and cave forms are now considered morphotypes of the same species [17].
Distinct cave populations display the same phenotype that has evolved independently in each cave. This is supported by the isolation of each cave and by the intricate topography of the region that would not allow contact between caves. Genetic analysis also support the multiple origin hypothesis, particularly complementation crosses between different cavefish which rescue the surface phenotype, and intra-/inter-population variation studies [15, 18, 19]. Several mitochondrial and nuclear DNA analyses exposed the complex and controversial history of this species: periodic bottlenecks in cave populations; high allelic variation in the epigean populations compared to the low allelic diversity in cave populations due to the low founding number of individuals [18]. The most recent consensus is that the Mesoamerican cave populations were originated by two waves of ancestral epigean forms coming from South America. The first wave, which occurred between 3.1 Million years ago (Mya) and 8 Mya, gave rise to the cave populations of the Sierra de El Abra, a limestone mountainous complex that allowed stream capture and isolation of several surface fish. The second wave, 2.1 Mya, founded the Micos and Guatemalan populations which are 90 km away from the El Abra region (genetic studies confirm their dissimilarity and age difference)[18]. Introgressive hybridization events between cave populations and surface ones can occur frequently in some caves or rarely in others. This depends on the caves’ altitude. The higher the caves, the more isolated they are, making hybridization an uneven (if not impossible) phenomenon throughout time [18].
The Pachón cavefish are a particular population originated in the first wave of invasion and have experienced very few crosses with surface fish [18, 20, 21]. They show one of the highest levels of genetic differentiation from surface fish, which is a likely result of its isolation and low funding number of individuals [22]. Genetic drift may have shaped some of its traits, reducing its variability and increasing its genetic differentiation from river populations, all in cooperation with selective forces [18, 20-23].
3 Cavefish, as well as their surface counterparts, can adjust to life in the laboratory without much hassle. They can be raised on a simple diet and spawning can be induced every other week by raising the water temperature. Embryos are easily collected and raised, and all important events of their development can be followed due to their transparency. They hatch roughly at 24 hours post-fertilization (hpf) and start actively eating brine shrimp at 5 days post-fertilization (dpf). Usually in 4-6 months, the individuals become fully mature and ready to mate [19]. Their proximity with zebrafish (Danio rerio) allows the use of some genetic and molecular tools developed for the latter, from morpholinos to transgenesis [15]. The ability to generate fertile hybrids between morphotypes also allows to study the genetic basis of their phenotypic differences.
For these reasons and given the detailed information about Astyanax origins and phylogeny, this species appears to be an excellent model to study CNS evolution. Unorthodox models like Astyanax not only allow us to overcome some of the limitations of other vertebrate models, but also open a wide range of new questions that have not been exhaustively depicted in other organisms, providing more interesting challenges to modern day science.
Previous works have documented differences between surface and cavefish neuroanatomy. The loss of visual input was compensated by the enhancement of other sensory systems of the cavefish, namely the LLS and Taste Buds (TBs) (chemoreception) [15, 19, 24-26]. The neuromasts are present in a higher number in the cavefish [27]. They are also larger (with a respectively larger sensory area) and have a longer cupula, which allows cavefish to be more sensitive to hydrodynamic stimuli [28, 29]. The LLS may be of crucial importance in the cave environment, allowing habitat exploration and orientation through a hydrodynamic representation of the environment [29-31]. In regards to chemoreception, TBs are not structurally different between surface fish and cavefish. Yet, some specific TBs in the cave morph contain significantly more axons than those of the epigean morph, which suggests an improvement of this sense [32]. This is caused by the expansion of the expression domain of sonic hedgehog (shh) at the anterior embryonic midline, which is also responsible for lens apoptosis in the cavefish [26, 33]. The auditory system does not differ between both morphs [34]. In regards to olfaction, which was also expected to be enhanced, it has been shown that olfactory projections to the telencephalon do not differ from other teleosts [35].
Previous authors have described the cavefish brain as more “slender and elongated” than the surface fish’s brain [36]. The pallial and subpallial (dorsal and ventral telencephalic subdivisions, respectively) organisation of both morphs does not diverge substantially [36]. Previous reports have hypothesized an enlarged telencephalon in cavefish [37], an idea which was further reinforced by demonstrating the influence of Shh in the developing forebrain. Shh not only increases cell proliferation in the hypothalamus, but also drives the specific increase of subpallial inhibitory GABA-ergic interneurons that migrate to the OB – located anteriorly to the telencephalon [38, 39]. This suggests that the cavefish olfactory bulb may have suffered some modifications. It also points to probable modifications in the gustatory input, considering that the hypothalamus is a relay centre for this information [39]. The hypothalamus is also the main neurosecretory centre in the vertebrate brain, responsible for hormonal regulation necessary in several homeostatic and behavioural responses. It has also been shown that this structure plays a pivotal role in aggressive behaviour and feeding behaviour [10, 40].
The TeO is a highly stratified portion of the brain of vertebrates which responds to visual and somatosensory input [10, 41]. The correspondent structure in mammals is the superior colliculus [10]. The cavefish TeO appears to be underdeveloped, a hypoplasia most likely caused by the lack of visual input [42, 43] which is already evident at 5 dpf [44]. The first actual test to this hypothesis was performed by Schmatolla [42] through a comparative study between the Astyanax river fish, its hypogean form and zebrafish, in both larval and adult stages. He reported
4 an already hypoplastic TeO at 7 dpf (a reduction of about 55%) in the cave form compared to the surface embryo of the same age. In the adult (over 1 year old), this reduction was still visible (and still of about 50%). Schmatolla also describes a higher density of rounded neurons in the periventricular layers of the adult cavefish TeO, whereas the same layer in the surface fish has neurons with a pyriform shape and have processes that extend into the TeO, suggesting lack of differentiation of neural cells in the cavefish tectum. After performing optic cup extirpation in the river fish before the optic nerve developed (18 hpf), there was a 27.9% reduction in the contralateral TeO when compared to the normal ipsilateral side. After raising the river fish in the absence of light (an experiment which yield no differences in TeO mass), Schmatolla concludes that the innervation itself is required to boost TeO’s development, but the “natural denervated” state of the hypogean morph is somewhat more hypoplastic than the “artificially denervated” TeO of the surface fish. Other experiments have corroborated these findings and explained the role of the lens/eye degeneration in TeO hypoplasia. Through lens transplantation from a surface embryo to its cave counterpart [33, 45, 46] Soares et al. [47] showed a 13% increase in volume and 8% increase in neuron number in the contralateral TeO of the operated eye in comparison to the ipsilateral. The surface lens partially rescued the ganglion cell layer of the retina, whose neurons extend their axons to the TeO, forming the optic nerve [47]. However, this rescue does not allow complete tectal restoration in the adult cavefish and optic cup extirpation in the epigean embryo does not phenocopy the cavefish TeO [42, 47].
Not many other brain regions have been thoroughly investigated in this particular species. The hindbrain and its CN nuclei could provide very interesting information about CNS evolution “in the dark”. As it has been reported, some fish species that rely on gustatory input to explore their surroundings (like carps, goldfishes and catfishes) have more TBs not only in the head region but also inside the mouth. As a result, CNs that relay this information to the brain (Facial, Glossopharyngeal and Vagus) are more robust and their respective nuclei are also increased in volume [10]. Considering the changes in cavefish’s sensory organs, there is reason to think that modifications in their CNs and respective brain centres may represent important adaptations to their habitat. In fact, recent experiments have shown the importance of the enhanced LLS in the cave environment, which elicits an attraction behaviour to high vibrations that helps cavefish finding food, a scarce resource in caves [48-50].
In summary, lack of visual information causes hypoplasia in the cavefish’s TeO and there may be hypertrophied nuclei/brain regions in the cavefish brain that respond to enhanced sensory input. So, in Astyanax, can these differences be solely due to neural plasticity [51], or has (micro)evolution fixed these traits in the cave morphotype? Previous works state that early brain specification does not differ between surface and cavefish (with the exception of Pax6 expression domain in the optic primordia region which is larger in the surface fish embryo) [47]. Thus, neural plasticity and the “sensory environment” of the cavefish may account for the differences in brain volume and shape that we find in this morphotype. With this question in mind, we aimed to understand how the cave environment affected both the sensory input and the brain’s overall morphology and organisation by comparing the cavefish’s cranial nerves and brain morphology with those of its epigean counterpart.
For this purpose, different brain regions and CN robustness were measured to look for coordinated modifications between sensory input and its brain centres. We used the 5 dpf as a basal state to compare with our adult fish (1 year post-fertilization, ypf), all reared in the same environment. Five day old larvae start actively finding food and escaping predators. Therefore, some of differences between surface and cavefish larvae up to this stage can be considered as fixed traits, as sensory experience starts after 5 dpf. Comparing both stages could allow us to distinguish between some developmentally fixed traits and neural plasticity.
5 Serial sections of an organism can be used to measure volumes of particular organs. This a laborious process which involves modification of the samples, which in turn could conceal subtle volumetric differences. Therefore, the best method to estimate volumes would involve a non-invasive whole-mount procedure. Optical projection tomography (OPT) is one of such methods. It is based on visible light transmission through a transparent sample which has been stained specifically for a structure [52]. Even if this method had worked well for the CNs of 5 dpf larvae, it could not be applied to adult fish due to the transparency requirement. For this reason, x-ray based micro-computed tomography (micro-CT) was chosen. Not only it allows an easy staining method for soft tissues (including both brain and CNs) but it works fairly well in both adults and larvae [53, 54]. As for CN detection and measurement, by using an enzyme metallography procedure it would be possible to trace and measure these structures in the larva [55]. The results obtained would allow the careful selection and measurement of brain volumes and CNs without causing any damages to the samples. Unfortunately, due to setbacks with the technique, CN measurements in 5 dpf stage were made in 3D reconstructions of images obtained through confocal microscopy. This is, to our knowledge, the first time this technique is employed to perform neuroanatomical descriptions an organism
With this method, differences were found in the adult and 5 dpf fish’s whole brain volume, but also in the olfactory bulb and TeO of both adult morphotypes. The data gathered does not support previous suggestions of increased telencephalic and hypothalamic volumes and no differences in cerebellar volume were found either. The CN measurements revealed changes in input pathways, particularly trigeminal and LLS, and also demonstrate reductions of vision related nerves. We thus supply evidence of changes in sensory input and brain volume reduction in Astyanax cavefish, the latter being a likely result of energetic constraints.
6
Materials and Methods
Animal rearing and manipulation
The Astyanax lab populations came from William Jeffery’s laboratory at the University of Maryland, College Park, MD, USA. The surface populations are raised descendants of individuals collected in Balmorhea Springs State Park, Texas, whereas the cavefish populations are descendants of individuals caught in Cueva de El Pachón in Tamaulipas, Mexico. No other cavefish populations were used in this study. All adult individuals were maintained in the same conditions: 19-21°C in a 14:12 hours light:dark cycle; spawning was induced by raising the temperature to 24.5-25.5°C and embryos collected, washed in E2 medium and incubated at 24.5°C. When they reached the desired stage: they were anesthetized in ice; washed once in PBS 1x and then fixed in 4% paraformaldehyde (PFA) overnight at 4°C; progressively dehydrated to methanol and stored at -20°C.
After 5 dpf, larvae were fed with brine shrimp twice a day and after 14 dpf they were transferred to larger container for faster growth. At 30 dpf, the juvenile were transferred into the tanks and fed with commercial food. The adult individuals used in this study, both Pachón and Surface, were exactly the same age (1 year old). All individuals were anesthetized in a tricaine solution, weighed and measured (from the tip of the mouth to the tip of the tail), and then sacrificed through a cut at the base of the skull. The heads were separated from the rest of the body (the cut being made behind the gills) and then fixed in PFA for 24 hours at 4°C before dehydration to methanol and storage at -20°C.
Micro-CT sample preparation and imaging
Samples previously fixed were prepared for Phosphotungstic Acid (PTA) (Sigma) staining as described by Metscher [53]. PTA gives contrast to non-mineralized tissues, including the CNS, allowing to detect and reconstruct the latter after imaging. A 1% PTA Stock Solution in water was prepared, a portion of which was used to make a 0.3% PTA solution in 100% Ethanol (Sigma). Samples, both adults and 5 dpf larvae, were then serially dehydrated to 70% Ethanol and transferred into the 0.3% PTA solution in Ethanol. Penetration time varied with age and size of the samples. Larvae took 2 days to stain and for both surface and Pachón cavefish heads, it was necessary to remove a small part of the dorsal cranial bone to facilitate the penetration of the staining agent, resulting in a staining time of 2 weeks. For the adults, the PTA solution was changed every 4 days. Samples were mounted in a 70% ethanol medium in polypropylene micropipette tips (Gilson), sealed and capped with Blu Tack (Bostik)[53].
The imaging was performed with Skyscan 1172 high-resolution Micro-CT scanner (Bruker-microCT, Kontich, Belgium), using a tungsten source (Hamamatsu 100/250). Adult heads were scanned at 59 kV and 149 mA (8W) with Al 0.5 mm filter, whereas 5 dpf fish were scanned at 40kV and 100uA (4W) without filter. Source-sample distance was set at 36 mm for 5 dpf fish and 94.53 mm for the adult. Projection images were taken every 0.3 of rotation and then saved as 16-bit files. Using Bruker microCT’s reconstruction software NRecon, these projection images were converted into virtual z-sections in Bitmap format. All the adult image files had a 9.95 μm pixel size whereas the images for the younger fish had 1.18 μm pixel size. Total scanning time for each adult head was approximately 50 min with a 10 min reconstruction time. Total larval scanning times were approximately 1 hr and 20 min with a 30 min reconstruction time.
7
Volume measurements
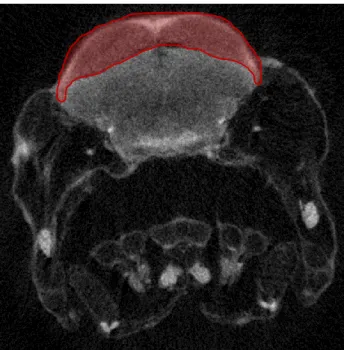
The reconstructed Bitmap image files from each individual were then loaded into Bruker-microCT analyzing software CTAn 1.12.0. For each set of images, the whole brain and specific brain regions were selected as Regions of Interest (ROI) across the whole dataset (Fig.1). This selection yielded entire Volumes of Interest (VOI) that were binarised to threshold the grey values that corresponded to the structure of interest. For all brain structures and across all individuals of the same age, this threshold was kept the same to allow comparable results. After binarisation, the software could perform a 3D analysis of the whole VOI previously binarised.
This method was used to measure the whole brain volume as well as some of its specific regions. The adult brain was selected from the OB to the beginning of the spinal cord (immediately after the hindbrain, the diameter of the medulla reduced significantly and the bulbous aspect gave rise to a more circular tube). The 5 day larval brain was selected from its most rostral point, right after the nostrils, up to the point where the musculature appeared (spinal cord).
The adult brain regions analysed include the OB, telencephalon, TeO, hypothalamus and cerebellum. At 5dpf, the same regions were selected, with the exception of the OB and cerebellum, which are not evident at this stage. The larval telencephalon was selected from the nostrils up to the diencephalon. In the adult, the OB was defined from the brain’s most rostral point to the telencephalon, and the latter was then selected from that point to the beginning of the diencephalon as well. The TeO, right above the ventricle (Fig.1), starts rostrally just on top of the diencephalon and terminates caudally as two lateral structures separated by the cerebellum/hindbrain in adults/larvae, respectively. The cerebellum was selected from the valvula cerebelli (its most anterior part located inside the tectal ventricle) all the way to hindbrain. The hypothalamus was selected from its most caudal point, where its lobes are clearly separated from the rest of the midbrain, to its rostral extremity, just behind the optic chiasma [10].
Lens manipulation
To detect changes associated with sensory experience, we set out to perform lens deletions in surface fish (detailed method in supplements)[46]. Time constraints however, did not allow us to scan matured individuals.
Figure 1 – Reconstructed micro-CT scan image of a virtual
section of a 5 dpf Pachón larva through the midbrain. The red region represents a ROI selection identical to what was performed in all scanned samples. The ROI selected in this picture corresponds to the TeO.
8
Enzyme metallography, paraffin sections and OPT
Enzyme metallography staining was used to detect CN in the 5 dpf fish [55]. However the method did not work out properly. To solve this issue we also tried to perform paraffin sections and OPT imaging. However problems arose in these methods as well. The detailed procedures used for these techniques are in the supplemental information.
Confocal imaging of Acetylated α-tubulin staining
Due to the high-resolution of the technique, confocal microscopy was used to image CN of 5 dpf fish. For this purpose we performed an immunostaining for Acetilated α-tubulin (Aαt) by using previously fixed fish. These fish were rehydrated to PBT, digested in proteinase K at 40 μg/ml for 30 min at room temperature, post-fixed in PFA 4% for 20 min, and washed in PBT before the 1 hour blocking step (blocking solution: 10% normal goat serum, 1% DMSO, 0.5% Triton-X100 in PBS). Samples were incubated overnight at 4°C in primary antibody (mouse anti-Aαt, Invitrogen) diluted at 1:200 in the same blocking solution. After 4 washes in PBT (30 min each), embryos were incubated (overnight at 4°C) in the secondary antibody (Alexa Fluor 488 goat anti-mouse IgG, Invitrogen) diluted at 1:200. After the final washes, in PBS, the embryos were mounted for confocal imaging: plastic rings were fixed to a glass slide with a silicone glue, where 1% agarose in PBS was added to immobilize the fish that had been properly positioned before cooling. Samples were imaged by scanning laser confocal microscopy (Leica™ TCS SPE), for one channel and with a 4 μm z-step.
Cranial nerve 3D reconstructions and measurements
For adult fish, the cranial nerves were reconstructed from PTA stained heads. The reconstructed tomographic images were halved by selecting every other image, and this new data set was read in Amira 5.3.3 (Visage Imaging) adjusting the voxel z distance for double the original (from 9.95 μm to 19.9 μm). This was done to reduce the amount of computational and graphical power the software would require. Selection and identification of nerves was performed by going through virtual sections in all axes and by using previously published information on CN anatomy in other fish [56-58]. Due to the fact that some of the cranial nerves bundle together and/or that their “entry point” into the brain was hard to detect, not all the cranial nerves were accurately and consistently reconstructed in all the individuals. For this reason, the Abducens (CNVI), Facial (CNVII), Glossopharyngeal (CNIX) and Vagus (CNX) will not be included in this analysis of adult fish. The CNI was easily reconstructed due to its linear path from the nose to the OB. The same can be said for the Optic Nerve, whose path was linearly followed from the eye to optic chiasma. The Oculomotor and Throchlear nerves were followed by tracing them from specific muscles: the former was traced from the Inferior Rectus muscle (located in the ventral posterior quandrant of the eye), even though this nerve is also responsible innervation of the Superior Rectus and Inferior Oblique muscles; the latter was traced from the Superior Oblique muscle, the most rostral-dorsal muscle of the eye. The remaining nerves (Trigeminal, Anterior and Posterior Lateral Line nerves and Octavolateralis) were selected and identified for their relative position, innervation targets and/or entry points. Measurements to all these nerves were made by applying a cutting plane in a specific point of their anatomy: CNI, V, VIII, ALL and PLL were sectioned just after their entry points into the brain; CNII, III and IV were sectioned halfway in their path. After this step, section areas were measured and their values recorded for posterior analysis. Both left and right CNs per individual were measured and their value was then
9 averaged, yielding a single value per CN per individual. At 5 dpf, fewer CNs were reconstructed in Amira (solely CNII, CNV, CNVIII, ALL, PLL and CNX).
DiI injections
To trace the PLL and ALL nerves, injections of DiI were made at 5 dpf surface and cavefish [47, 59]. All injections were made in PFA fixed fish previously washed in PBS. To allow for more precision, fish were then immobilized in 1% agar in PBS 1x. DiI (Sigma) was dissolved in Dimethylformamide (Sigma) yielding a stock solution of 2mg/ml. The tracer was loaded into glass micromicropipettes and, with a micromanipulator (Narishige) and pressure-injector system (Picospritzer III), the dye was injected into the specific organ. For lateral line tracing, the dye was injected in a particular ganglion: anterior lateral line ganglion (ALLG), located between the eye and otic vesicle, or posterior lateral line ganglion (PLLG), located immediately after the posterior pole of the otic vesicle. After the injections, fish were removed from the agar and left overnight at room temperature in PBS. Afterwards, the staining was checked and pictures were taken in 0.2% agarose in PBS.
Statistical analysis
Whole brain volume measures were either log10 transformed or square rooted if values were
below 1 mm3. This made our dataset comparable through parametric statistical analysis. To test
for differences in relative brain size among the two populations the transformed brain volumes were normalized by dividing them by the log10-transformedwhole fish volume. The latter was
estimated by approximating the fish’s volume to that of a prism, using body length, width and height of each individual as sides of a hypothetical rectangular prism. All ANOVA analysis and respective post-hoc (Scheffé) tests were performed in the normalized dataset. This methodology was applied to both 5 dpf and adult fish. For different brain structures to be compared, a normalization step was also required. In this case, as it has been done in previous works [60], we divided the measured volume of each structure by the absolute whole brain volume, thus yielding a ratio. It was with these ratios that the comparative tests were performed. All ANOVA assumptions were verified prior to execution of these comparisons and, in cases where these were violated, non-parametric tests were performed.
For CN robustness measurements, the data was also transformed (square-root), and these results were then normalized by dividing them by the log10-transformed hypothetical surface
area of each fish. This surface area was estimated by, again, assuming the fish as a rectangular prism and summing the areas of each face of this volume given by body length, width and height. After ascertaining that there were no differences between left right with a t-test between variables, averaged values were then compared through both parametric (ANOVA) and non-parametric (Mann-Whitney U) tests. At 5 dpf stage, the section areas were not normalized due to lack of the respective body length of individuals. Regardless, their areas were still analysed. All statistical analysis and graphs were done with STATISTICA 11 (StatSoft, Inc.).
10
Results
Lens manipulation in surface fish
After the experimental procedures, larvae were screened for malformations and/or presence of the lens. Only the desired fish were reared to adulthood or sacrificed at 5 dpf. Unfortunately, due to time constraints, these fish were not analysed for CNS volumetric modifications – they had not reached a desired and comparable body length with that of the adult fish used for the other measurements.
Enzyme metallography
In order to compare CN differences between surface and cavefish, we first tried to produce accurate 3D reconstructions through micro-CT imaging. For that we performed an enzyme metallography immunostaining for Aαt. This staining forces the precipitations of silver in the area neighbouring the location of the secondary Horseradish Peroxidase (HRP) conjugated antibody, thus allowing x-ray contrast. These silver deposits can be observed with visible light under the dissecting microscope (Fig.2), but the micro-CT was unable to detect any silver deposits. This method was performed several times with adjustments (Supplements), none of which were successful. Also, the staining never penetrated enough to see the entry point of the CNs into the hindbrain – only the most superficial braches were easily stained.
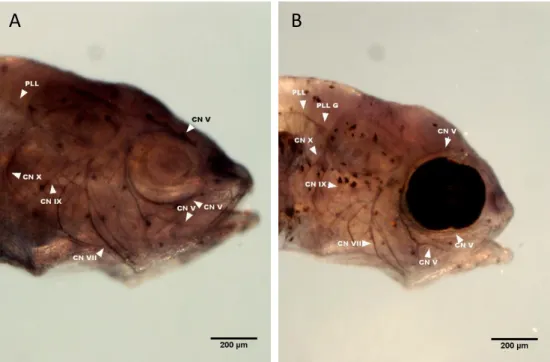
To see if the antibody penetration problem was due to the secondary antibody’s molecular weight, we performed DAB staining following the same protocol and an alternative one. As the images show (Fig.2), more CNs can be seen, but not by their entry point into the hindbrain. After several other attempts to make this method work, we decided to try sectioning the larvae, staining the sections for the same antibody and manually reconstruct the sections.
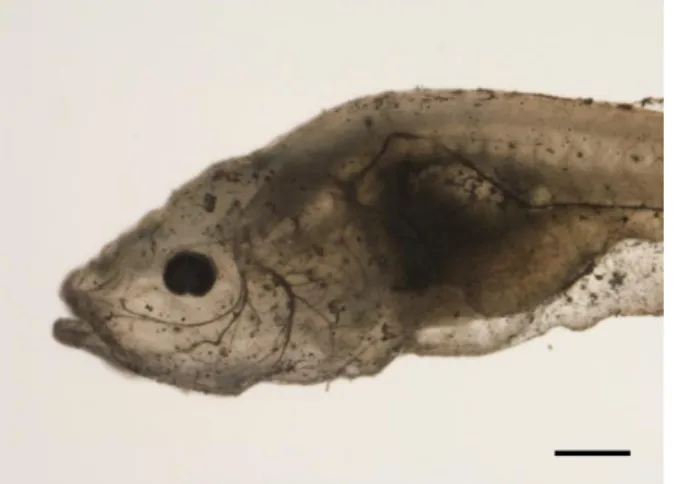
Figure 2 – 5 dpf Steinhardt (Chica) cavefish stained for Aαt
using the EnzMet™ kit to create x-ray detectable silver deposits in CNs which would allow 3D reconstruction through micro-CT imaging. Scattered silver deposits can be found throughout the surface of the larva and, in darker tones, some of the CNs are visible, particularly CNV and ALLN branches around the eye (scale bar, 200 μm).
11
Immunostaining in paraffin sections
After determining the right primary antibody dilution (1:50 Aαt in TNB), all 5 dpf larval sections were imaged. However some of the sections were detaching from the glass slides (see Fig.4). After controlling for possible mistakes and errors that could have been made throughout the entire protocol (see supplemental information), the problem still arose. Even though not all sections had this problem, the ones that did would render inaccurate and misaligned reconstructions, upon which no measurements could reliably be performed.
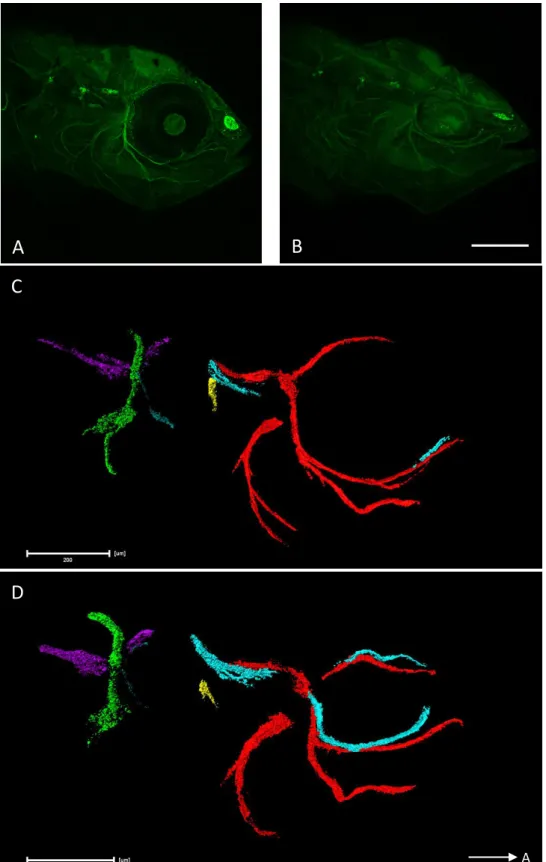
Figure 3 – DAB staining for Aαt in 5 dpf Pachón cavefish (A) and surface fish (B). This staining allowed
to identify more CNs than with the EnzMet™ (indicated in the images). However the penetration still remained an issue (scale bar, 200 μm).
B
A
Figure 4 – Example of Aαt staining with secondary Alexa Fluor® 488 in a 5 dpf surface fish. The first image (A)
shows the normal aspect of a section, with part of the optic nerve tract in the eye at the right side. The second image (B) demonstrates how the tissue looks like when it detaches from the slide.
12
OPT
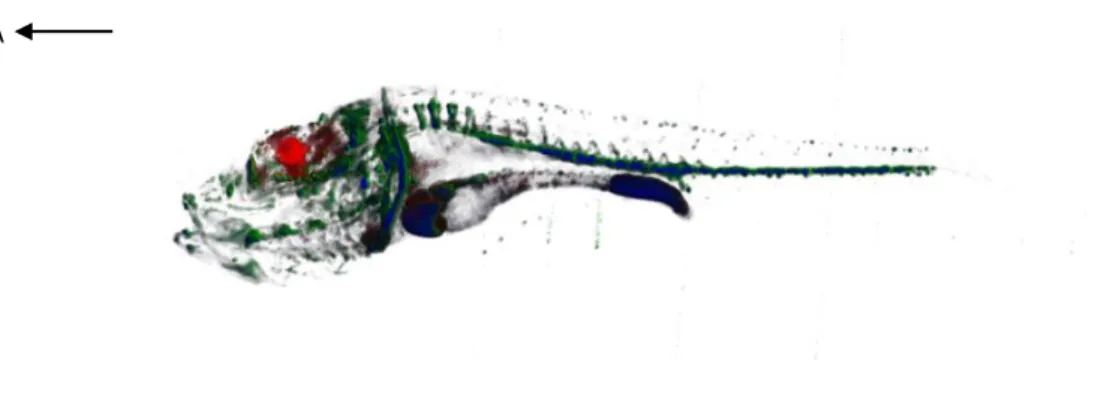
To test this procedure, we injected Fluorescent Dextran Amine (FDA) and Rhodamine Dextran Amine (RDA) into 5 dpf surface and Pachón larvae brain and then proceeded with the sample treatment and imaging. The results obtained showed a staining much weaker than anticipated (Fig.5). Even though the images obtained could serve some purposes, the long laborious sample preparation yielded images which could not serve for the 3D reconstructions of the brain. On top of that, problems with the OPT scanner filters would not allow us to image CNs properly either.
Confocal imaging, reconstruction and cranial nerve measurements
After immunostaining for Aαt and confocal imaging, we were able to reconstruct the cranial nerves from surface (n=4) and cavefish (n=5) at 5 dpf stage. Regrettably, the staining was not visible with a fluorescent dissecting microscope. With the confocal microscope, the signal was detected, but the gain had to be increased significantly, which in turn increased the background noise (Fig.6 A and B). Reconstructions of the most evident CNs were still performed using Amira 5.3.3 (Fig.6 C and D). These include CNV, ALLN, CNVIII, CNIX, PLLN and CNX, all of which, with the exception of CNIX, were measured at a level close to their entry point to the brain. Due to the weak signal, some of the CNs appear more dotted, particularly the CNX and the PLLN (Fig.6). When virtual section planes were applied to these nerves, the generated surfaces were patchy. Nevertheless, and as this was the case for all the samples, measurements were made and compared.
From a topological point of view, the nerve’s paths do not seem to differ between both morphotypes. There are some differences in the CNV and ALLN around the eye orbit (their tracts are more apart in the cavefish). The distinction between the CNV and ALLN branches was made after DiI injections to the ALL ganglion – the ALLN branches are connected to the neuromasts (Fig.7). Section area comparisons of the different nerves at this stage did not yield significant differences between both morphs (Mann-Whitney U, p>0.05). The graphs, though, suggest that such differences might exist, particularly in the CNX (see S.Fig.1 and 2).
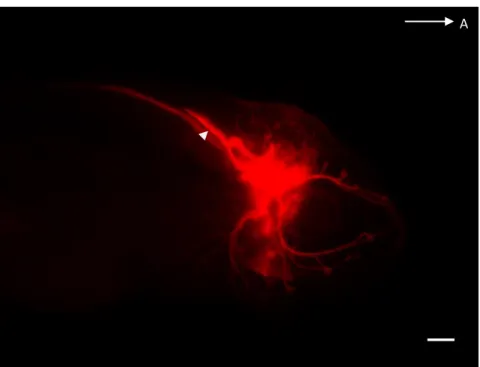
Figure 5 – OPT reconstruction resulting from the FDA and RDA injections in a 5 dpf Pachón cavefish. The arrow in the
top left corner indicates the anterior direction. FDA (green) was injected into the hindbrain and from there it spread to other regions of the body. RDA (red) was injected into the tectal ventricle, and it did not spread out beyond the midbrain. The blue regions were imaged with the anatomy channel, which detects tissue auto-fluorescence and reconstruct an overall outline of the sample.
13
D
Figure 6 – CN staining and reconstruction in 5 dpf surface and Pachón cavefish. A and B show the
confocal image of both surface (A) and cavefish (B) stained for Aαt. All images show the right lateral side and the arrow in the right bottom corner indicates the anterior direction. The difference in eye size at this stage is visible. As mentioned, the signal is not quite strong but allows visualization of the nerves. From these images, reconstructions were made in Amira. C shows the CN reconstruction of a surface fish and D the cavefish. Both images share the same colour code: CNV in red; ALLN in light blue; CNVIII in yellow; CNIX in ocean blue; PLLN in purple and CNX in green. Note the patchy aspect of CNX and PLLN (scale bars at 200 μm).
C
D
B
A
14
Adult cranial nerve reconstruction and measurements
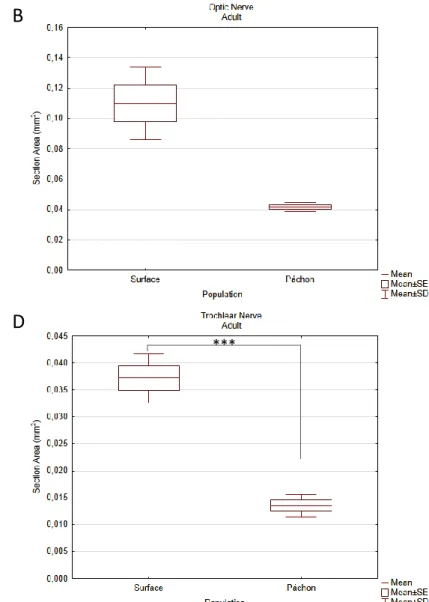
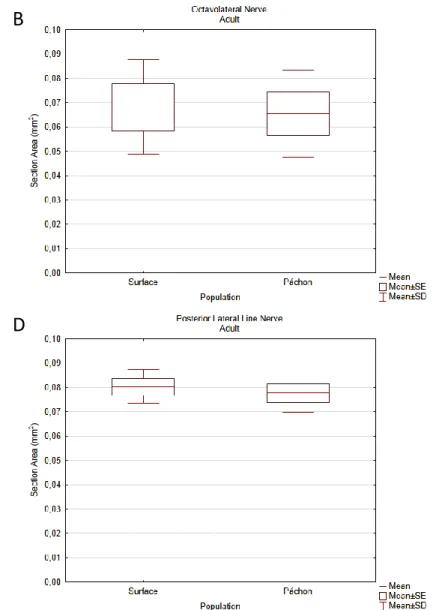
Adult cranial nerves were reconstructed from micro-CT scans of PTA stained fish. Reconstructed micro-CT files were loaded into Amira 5.3.3 and all the nerves reconstructed. The differences in anatomical complexity between the virtual sections of surface and Pachón fish did not allow identical nerve reconstructions. This is most evident for the ALLN and CNV. Based on previous reports in fish [56-58], CN neuroanatomical distribution was inferred. Due to the lack of detail, some of these nerves were not identified properly, namely CNVII, CNIX and CNX. The hypothetical IX and X nerves were reconstructed (Fig.8) but not measured. These two were distinguished from the PLLN because the latter could be traced to the trunk’s lateral midline. The 3D images obtained from both surface (n=4) and Pachón cavefish (n=4) (Fig.8 and 9) were sectioned and the nerves’ robustness measured. After normalization with the fishes’ surface area, the values were compared using the appropriate tests. After confirming all normality and homoscedasticity assumptions (Shapiro-Wilk tests p>0.05, Cochran C Test p>0.05), an ANOVA test was used to compare the two morphotypes except for the CNII. Post-hoc analysis were done using Scheffé’s test. The results, as shown in the boxplots, show significant differences in vision related nerves, the trigeminal and the ALLN (Fig.10 and 11). The CNII shows the expected reduction in cave morphotype (Mann-Whitney U, p=0.03), along with the CNIII (ANOVA, p=0.008) and the CNIV (p<0.001) (Fig.10). Both the trigeminal and ALLN show significant increases in their robustness in the cavefish (p<0.001 and p=0.002, respectively) (Fig.11). The olfactory (Fig.10), octavolateral and PLL (Fig.11) nerves did not show differences between the two morphotypes.
Figure 7 – DiI injection to the Anterior Lateral Line Ganglion of a 5 dpf Pachón. The arrow
in the right top corner indicates the anterior direction. This injection not only labelled the anterior branches of the ALLN, but also labelled parts of the trigeminal. The lateral line neuropil in the hindbrain is also visible (arrow) (scale bar, 200 μm).
15
B
A
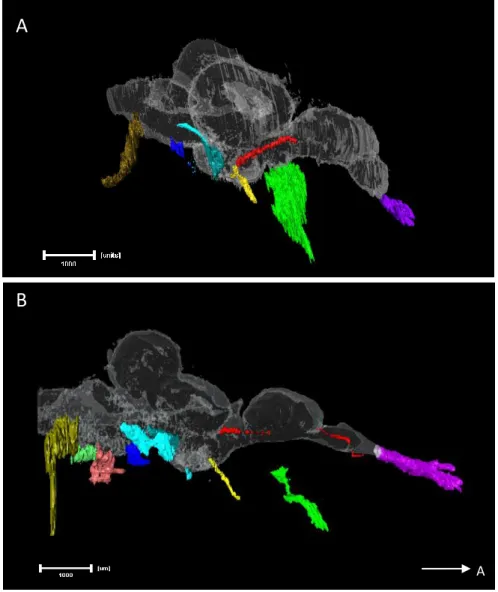
Figure 8 – Right lateral views of Amira 3D reconstructions of the CNs and brain of both adult
surface fish (A) and Pachón cavefish (B). To better understand their position, a brain reconstruction was also added to the image (white transparent). The arrow in the right bottom corner indicates the anterior direction. All measured nerves share the same colour code, from anterior to posterior: CNI in purple; CNII in green; Oculomotor in yellow; Trochlear in red; ALLN in light blue (arrow); trigeminal in ocean blue, close to the ALLN; CNVIII in dark blue and PLLN (the most posterior) in a shade of green. The hypothetical CNIX and CNX were reconstructed in the cavefish (in light red and green, respectively) (scale bar set to 1 mm).
16
B
A
A
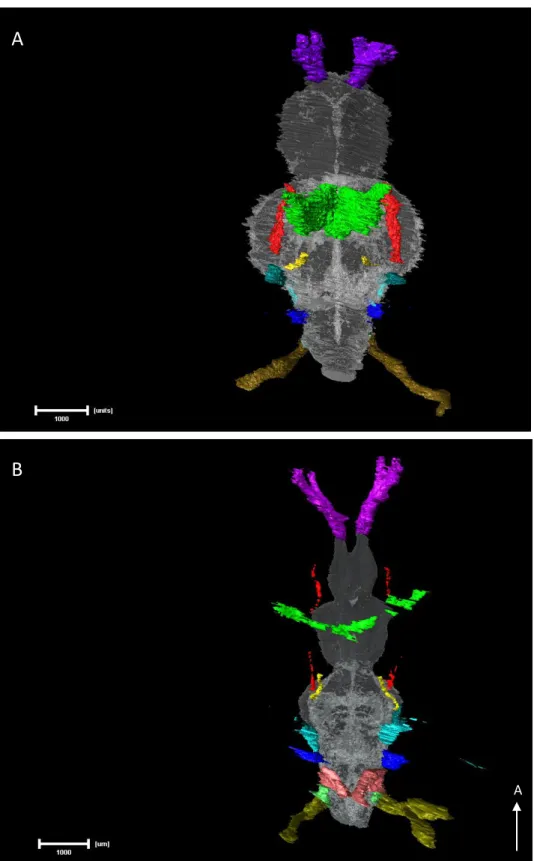
Figure 9 – Dorsal views of Amira 3D reconstructions of the CNs and brain of both adult surface fish
(A) and Pachón cavefish (B). To better understand their position, a brain reconstruction was also added to the image (white transparent). The arrow in the right bottom corner indicates the anterior direction. All measured nerves share the same colour code, from anterior to posterior: CNI in purple; CNII in green; Oculomotor in yellow; Trochlear in red; ALLN in light blue (arrow); trigeminal in ocean blue, close to the ALLN; CNVIII in dark blue and PLLN (the most posterior) in a shade of green. The hypothetical CNIX and CNX were reconstructed in the cavefish (in light red and green, respectively) (scale bar set to 1 mm).
17
*
A
B
C
D
** ***
Figure 10 – Boxplot graphs showing the differences in section area of CNI (A), CNII (B) CNIII (C) and CNIV (D) between the two adult morphotypes. Boxplots were constructed
18
A
B
C
D
***
**
Figure 11 – Boxplot graphs showing the differences in section area of CNV (A), CNVIII (B), ALLN (C) and PLLN (D) between the two adult morphotypes. Boxplots were
19
Brain morphology
Brain morphology was compared between the two morphotypes through micro-CT reconstructions of PTA stained adult and 5 dpf fish. The overall brain volume was normalized by each fish’s body volume to analyse each specific stage. OB, telencephalon, TeO, hypothalamus and cerebellum were measured and compared. For each of these structures and for the brain itself, ANOVA tests were performed along with the post-hoc tests. ANOVA’s assumptions were verified for all variables and except for the TeO. For this reason, tectal ratios in both stages were compared with non-parametric (Mann-Whitney U) tests.
Figure 12 – Lateral (A) and dorsal (B) view of Amira reconstructions of Pachón (red) and surface (green) larval
brains in 5 dpf stage. The arrow at the bottom right corner indicates the anterior direction. The arrows in figure A indicate the dorsal portion of the brain and are located just over the TeO (scale bar at 200 μm).
A
B
A
20
******
Figure 13 – Boxplot graphs showing the differences in normalized brain volume (A), and also in the telencephalic (B), tectal (C), and hypothalamic (D) ratios
between the two morphotypes in the 5 dpf stage. Boxplots were constructed using mean, standard error and standard deviation. Significance is shown where relevant (* for p<0.05; *** for p<0.001).
*
A
B
21
Figure 14 – Boxplot graph showing the differences in normalized brain volume between the
two morphotypes in the adult stage. Boxplots were constructed using mean, standard error and standard deviation (** for p<0.01).
**
A
Figure 15 – Dorsal view of Amira reconstructions of Pachón (A) and surface (B) adult brains. The arrow at the top right
corner indicates the anterior direction. The smaller arrows in both images indicates the TeO. The magnifications are different between the two images (scale bar at 1000 μm).
B
A
22
Figure 16 - Boxplot graphs showing the differences in normalized telencephalic (A), tectal (B), hypothalamic (C) and cerebellar (D) volumes between the two
morphotypes in the adult stage. These values were obtained by dividing each region’s volume by the overall fish volume. Boxplots were constructed using mean, standard error and standard deviation. Significance is shown where relevant (* for p<0.05, ** for p<0.001).
A
B
C
D
*
* **
23
Figure 17 – Boxplot graphs showing the differences in telencephalic (A), tectal (B), hypothalamic (C) and cerebellar (D) ratios between the two
morphotypes in the adult stage. Boxplots were constructed using mean, standard error and standard deviation. Significance is shown where relevant (* for p<0.05, ** for p<0.01). ** * **
A
B
C
D
24
Figure 18 – Boxplot graphs showing the differences in normalized OB volume (A) and OB ratio (B) in the
adult stage. Boxplots were constructed using mean, standard error and standard deviation. Significance is shown where relevant (*** for p<0.001).
***
A
25 The brain of the Pachón larvae (n=5) appears to be bigger than the surface fish’s brain (n=5) (Fig.12), but after normalization the Pachón larval brain seems to be significantly smaller than that of the surface fish larvae (ANOVA, p<0.001, Fig.13 A). To further dissect possible differences, three brain regions were compared. Unlike what previous studies have implied [38, 39], neither telencephalic nor hypothalamic ratios show differences between populations at this stage (Fig.13 B and D). However, an approximate 50% reduction in the TeO is already visible in the cavefish larvae (Mann-Whitney, p=0.01, Fig.13 C). This is in agreement with previous reports which state that tectal differences arise early in development [42, 44]. This last result reinforces the accuracy and reliability of the method.
In the adult stage, the surface fish brain is still bigger (approximately 22%, ANOVA p=0.004) than the Pachón’s (Fig.14 and 15). As it is visible in the reconstructions (Fig.14), the TeO is clearly less expanded in the adult cavefish. Also, the telencephalon, just anterior to the TeO, takes a cone-like shape in the Pachón (with the base and widest part at its anterior pole and the tip in its posterior one), compared to the more cylindrical shape of the surface fish’s. The OBs in the cavefish seem to be slightly more elongated, but they are more bulbous in the surface fish (Fig.8 and 14).
When comparing the normalized adult volumes, the hypothalamus (Fig.16 C) and OB (Fig.18 A) show no significant differences, unlike the TeO (Mann-Whitney U, p=0.0012, Fig.16B), the telencephalon and cerebellum (ANOVA, both regions with p=0.02). Comparisons between the adult tectal ratio of both morphs show, like at 5 dpf, the same significant proportional 50% difference between both morphs (Mann-Whitney U, p=0.005, Fig.17 B). The Pachón’s telencephalic ratio (Fig.17 A) is higher than the one of its surface counterpart, however this difference is marginally not significant (ANOVA, p=0.054). The hypothalamus also seems to obey the telencephalic trend, being enlarged in Pachón’s brain (Fig. 17 C). This difference is, in fact, significant (ANOVA, p=0.025), but this structure was not easily defined through the virtual sections (ROI selections may have include some non-hypothalamic nuclei). The cavefish cerebellar ratio is also significantly higher than the surface fish’s (ANOVA, p=0.002, Fig.17 D). The cavefish’s OB also shows significant higher ratio in contrast with the surface fish’s (Fig.18 B ANOVA, p<0.001).
To test the possibility that changes in other regions may be masked by modifications in the TeO, the telencephalic, cerebellar and hypothalamic volumes were all individually normalized by the whole brain volume without the TeO’s volume. As a result, proportions of the measured regions do not differ between morphotypes (Fig.18) with the exception of the OB (ANOVA, p<0.001). To further confirm these results, tectal size was proportionally increased in the Pachón cavefish and its ratios recalculated. The results were the same: only the OB shows still significant differences (S.Fig.6 B ANOVA, p<0.001). The same measurements were made for 5 dpf fish (S.Fig.3).
26 19% 9% 17% 3% 52%
Surface (without TeO)
Telencephalon Hypothalamus Cerebellum Olfactory Bulb Other 19% 9% 18% 5% 49%
Pachón (without TeO)
Telencephalon Hypothalamus Cerebellum Olfactory Bulb Other 10% 17% 8% 16% 5% 44%
Pachón
Optic Tectum Telencephalon Hypothalamus Cerebellum Olfactory Bulb Other 22% 15% 7% 13% 2% 41%Surface
Optic Tectum Telencephalon Hypothalamus Cerebellum Olfactory Bulb OtherA
B
C
D
Figure 19 - Pie charts showing the different ratios of each analysed brain region in adult fish. A and B represent the mean ratios measured for each region, previously compared between both morphotypes.
C and D are the mean ratios for each region calculated by excluding the tectal volume from the overall brain volume. No differences are found between both morphotypes when this ratio is measured (ANOVA, p>0.05) except for the OB (p<0.001).
27
Discussion
This analysis allowed to uncover: (1) significant reductions in vision related nerves accompanied by a TeO reduction in the Pachón cavefish; (2) increases in CNV and ALLN, perhaps related with enhanced sensory abilities in the cave morph; (3) the cavefish brain appears to be smaller than its surface counterpart; (4) relative expansion of the OB in the cave morphotype and (5) no differences in the telencephalon, hypothalamus and cerebellum between both populations
Methodology
The enzyme metallography staining at 5 days for Aαt would be the most interesting and accurate method to measure and compare CN. Unfortunately, the amount of silver deposits was enough for light detection, but not for x-ray detection. After several attempts, no actual solution was found for this issue. In a personal communication from Dr Brian Metscher, we were told that other labs that had tried this method with zebrafish were also unsuccessful. We thus inferred that this method would probably not work. The opportunities to optimize the method were scarce due to the lack of slots for scanning. For this reason we moved on to immunostaining in paraffin sections.
After sectioning however, portions of tissue from every other section detached from the slides. The most likely cause ought to be the lack of experience by the operator (as others have performed the same method and never experienced this problem). While staining the sections for Aαt, it was determined that the best dilution for the primary antibody was 1:50, which produced great results with alexa conjugated secondary antibodies. It is thus possible that the Aαt EnzMet™ staining did not work properly due to the fact that the primary antibody was highly diluted (1:2000). To confirm this, another Aαt EnzMet™ staining could be performed using a 1:50 dilution for the primary antibody and secondary HRP-conjugated antibody at 1:200. This could increase the amount of silver agglomerates in the nerves and create enough x-ray contrast to image them. The OPT was another possible alternative, but due to time constraints and to the faulty apparatus, we could not proceed with this method.
It was also possible to use PTA stained 5 dpf samples to reconstruct the CNs, but these were often difficult to find. Due to their small calibre, their tracts were also mistaken with other structures. Nevertheless, some of them were actually reconstructed, namely the CNII and the PLLN.
For the confocal imaging, the primary antibody dilution used was 1:200. This dilution proved not to be enough to get excellent images. As this method was used at the last minute, it was not possible to start another staining and image the samples again.
Vision related nerves
To determine changes in the degree of neural input, each CN’s section area was measured at a specific point. The measurements of the CNs yielded significant decreases in the robustness of the optic and eye muscle nerves in cavefish. This is the first time optic muscle innervation in Astyanax has been looked at in close detail. Their large width in surface fish made it easy to trace them from their target muscles into the brain. In the Pachón however, these were much smaller, making their reconstruction more difficult. Nevertheless, the adult cavefish, even with a degenerated eye, still retain these nerves and their respective muscles, though they seem atrophied like the CNII. At post-natal stages, there is an important bidirectional cross-talk