2017
UNIVERSIDADE DE LISBOA
FACULDADE DE CIÊNCIAS
DEPARTAMENTO DE BIOLOGIA VEGETAL
Consequences of Global Warming and Metal Pollution on the
metabolism of omega-3 and -6 fatty acids of Phaeodactylum
tricornutum
Eduardo Miguel Onofre Feijão
Mestrado em Biologia Molecular e Genética
Dissertação orientada por:
Doutora Carla Gameiro
Professora Doutora Ana Rita Matos
I
Declaração
De acordo com o disposto no artigo n.º 19 do Regulamento de Estudos de Pós – Graduação da Universidade de Lisboa, Despacho n.º 2950/2015, publicado no Diário da República, 2.ª série — N.º 57 — 23 de março de 2015, foram incluídos nesta dissertação resultados das seguintes publicações: 1 - Feijão, E., Gameiro, C., Duarte, B., Caçador, I., Cabrita, M.T., Matos, A.R., 2017. Consequences of global warming and metal pollution on the metabolism of omega-3 and -6 fatty acids of Phaeodactylum tricornutum. The 3rd general meeting of COST action FA1306 with the title "Field phenotyping
technologies from woody perennials to annual crops". Poster available at: https://www.plant-phenotyping.org/about_3rd_general_meeting
2 - Feijão, E., Gameiro, C., Franzitta, M., Duarte, B., Caçador, I., Cabrita, M.T., Matos, A.R., 2017. Heat wave impacts on the model diatom Phaeodactylum tricornutum: Searching for photochemical and fatty acid biomarkers of thermal stress. Ecological Indicators. (in press) doi:10.1016/j.ecolind.2017.07.058
Em cumprimento com o disposto no referido despacho, esclarece-se ser da minha responsabilidade a execução das experiências que estiverem na base dos resultados apresentados (exceto quando referido em contrário), assim como a interpretação e discussão dos mesmos.
Este trabalho específico foi abrangido pela o projeto Hg- Planktartic, parte do Programa Polar Português (PROPOLAR, financiado pela FCT).
Lisboa, 28 de Setembro de 2017
II
Agradecimentos
Eu gostaria de agradecer à Doutora Carla Gameiro e à Professora Ana Rita Matos pelo suporte continuado e orientação durante este último ano. A Doutora Carla Gameiro ensinou-me tudo sobre meios de crescimento e técnicas de contagem de células. A Professora Ana Rita Matos permitiu-me trabalhar no laboratório do Grupo de Biologia Funcional de Plantas do Instituto de Biossistemas e Ciências Integrativas (C2.4.27/28, FCUL) onde aprofundei os meus conhecimentos sobre o metabolismo de lípidos e técnicas de biologia molecular. A ambas eu gostaria de agradecer por me terem dado esta oportunidade de trabalhar no projeto que juntas desenvolveram. Gostaria de agradecer ao Doutor Bernardo Duarte por me ter ajudado a aprofundar o meu conhecimento em fotossíntese e técnicas de análise de fluorescência da clorofila e à Doutora Teresa Cabrita pelo apoio nas culturas celulares. Sem o envolvimento e apoio de ambos esta tese não teria sido possível. A todos os mencionados acima, um muito obrigado pelo apoio na elaboração e publicação do meu primeiro artigo.
Gostaria de agradecer à Daniela Ferreira, ao Miguel ‘migagas do mal’ Gaspar e ao Marco Franzitta com dois T’s por toda a palhaçada durante as horas de almoço.
Dona Manuela ‘Nela’ Lucas, a melhor amiga, conselheira e mãe de laboratório que alguém podia ter. Obrigado pelas plantas, pelos conselhos e pelo chocolate.
Gostaria também de agradecer a todos os professores e investigadores do laboratório porque também eles ajudaram a que o ambiente de trabalho fosse tão acolhedor.
Numa nota mais privada, gostaria de agradecer aos meus pais e ‘maninha’ por todo o esforço que têm feito para eu conseguir avançar nos estudos. Muitas vezes ficam mais orgulhosos das minhas conquistas do que eu. Não posso também esquecer de agradecer aos meus amigos que também ajudaram a esquecer os momentos de trabalho quando nem tudo estava a correr bem.
A todos,
III
Table of contents
Declaração... I Agradecimentos ... II Resumo ... V Palavras-chave ... VII Summary ... VII Keywords ... VIII Abbreviations ... IX List of tables and figures ... XII1. Introduction ... 1
2. Materials and methods ... 4
2.1. Experiment set-up... 4
2.2. Cell growth rates ... 4
2.3. Oxygen evolution rates ... 4
2.4. Pulse Amplitude Modulated (PAM) Fluorometry ... 5
2.5. Pigment analysis ... 5
2.6. Fatty acid and Lipid classes analysis ... 5
2.6.1. Extraction of Total Fatty Acids ... 5
2.6.2. Gas Chromatography and Thin-layer Chromatography ... 6
2.7. Quantification of lipid peroxidation products ... 6
2.8. Gene expression analysis ... 6
2.8.1. RNA extraction ... 6 2.8.2. cDNA Synthesis ... 7 2.8.3. Real-time PCR analysis ... 7 2.9. Statistical analysis ... 7 3. Results ... 8 3.1. Growth parameters ... 8
3.2. Photosynthetic and respiratory rates ... 8
3.3. PAM fluorometry ... 9
3.4. Pigment analysis ... 10
3.5. Fatty acid and Lipid classes analysis ... 12
3.6. Lipid peroxidation products ... 16
3.7. Gene expression ... 16
IV 5. Conclusions ... 22 6. References ... 23 7. Supplementary data ... 30
V
Resumo
Atividades antropogénicas tais como o consumo de combustíveis fósseis ou a desflorestação induzem a emissão de gases de efeito de estufa para a atmosfera, aumentando a já existente barreira natural à dissipação do calor terrestre para o espaço, que sendo aprisionado leva a um aumento da temperatura média da superfície da terra – o Aquecimento Global. De acordo com o Painel Intergovernamental para as Alterações Climáticas (IPCC), o planeta Terra está a sofrer um aumento no número de eventos térmicos extremos, mais concretamente ondas de calor, que apresentam duração e intensidade cada vez maiores. As ondas de calor, embora tenham a sua maior expressão em termos de subida da temperatura do ar, tendem também a aumentar a temperatura dos oceanos tal como ocorreu em 2005 durante uma onda de calor, em que a água superficial do estuário do Tejo atingiu os 26 ºC.
No que diz respeito à poluição dos oceanos por metais pesados, esta tende a ser igualmente potenciada por atividades antropogénicas como realização crescente de dragagens, atividade industrial, metalúrgica e o uso de pesticidas na agricultura que deixam em suspensão metais pesados como o cobalto, o cobre, o zinco, o mercúrio, o chumbo e o níquel, capazes de atingir facilmente a coluna de água. Estes dois fatores de stress abiótico têm um impacto negativo nos ecossistemas expondo os organismos a condições subótimas.
O fitoplânton marinho é frequentemente dominado por diatomáceas e por esse motivo estas têm uma grande importância como produtores primários nos oceanos. As diatomáceas apresentam uma grande biodiversidade. Sendo na sua maioria dotadas de atividade fotossintética (autotróficas) estão na base da cadeia trófica, estimando-se que sejam responsáveis por 20 % da produção primária global. Entre as moléculas de maior importância produzidas pelas microalgas estão os ácidos gordos essenciais como os ómega-3 e -6, ácidos linoénico e linoleico, que através de sucessivas reações de elongação e dessaturação dão origem a ácidos gordos polinsaturados de cadeia longa. Entre eles estão os ácidos eicosapentaenóico (EPA) e docosa-hexaenóico (DHA), ambos ómega-3, com elevada importância na saúde cardiovascular e cerebral, tal como em várias funções membranares e celulares. Uma vez que nos humanos, tal como em muitos animais, a taxa biossintética de EPA e DHA é pouco eficaz, a obtenção destes ácidos gordos é apenas alcançada através da dieta.
A diatomácea modelo Phaeodactylum tricornutum é uma microalga que pode apresentar quatro morfologias distintas - oval, fusiforme, triradiada e cruciforme. Esta espécie tem a capacidade de uma interconversão de morfologias normalmente induzida por estímulos ambientais. Por ser uma espécie com o genoma já sequenciado, tolerante a inúmeros stresses e capaz de produzir uma quantidade significativa de EPA, o P. tricornutum é um bom modelo para a realização de estudos visando elucidar os mecanismos genéticos, metabólicos e fisiológicos relacionados com a sua capacidade de resistência a stresses ambientais.
O principal objetivo desta dissertação foi avaliar o impacto de uma onda de calor, e da poluição por metais pesados, mais concretamente, por níquel, no crescimento, fotossíntese, metabolismo dos ácidos gordos omega-3 e -6 e expressão de genes em P. tricornutum.
Após a realização de alguns ensaios preliminares visando o estabelecimento do protocolo experimental a seguir, o estudo fez uso de técnicas não-destrutivas como a medição polarográfica da concentração de oxigénio com elétrodo do tipo Clark e fluorometria PAM que avaliam taxas de consumo de oxigénio e fluorescência da clorofila a, respetivamente; e técnicas bioquímicas e moleculares como cromatografia gasosa e de camada fina e PCR quantitativo, permitindo avaliar a composição lipídica e a expressão de genes do metabolismo lipídico e fotossintético.
VI A exposição a níquel não se revelou tão nefasta como o efeito do aumento da temperatura ou o efeito combinado de ambos os stresses. Com o aumento da concentração de Ni, o P. tricornutum apresentou uma taxa de crescimento com menor acumulação de biomassa. Embora as taxas de produção de O2
tenham sido menores, a eficiência do fotossistema II (PSII) e as taxas de transporte eletrónico permaneceram inalteradas na concentração mais elevada do metal. Os conteúdos em pigmentos fotossintéticos e carotenoides, como a clorofila a e a fucoxantina, respetivamente, diminuíram, sugerindo que a taxa fotossintética baixa poderá ter estado relacionada com alterações na concentração de pigmentos. O aumento da temperatura de crescimento para 26 ºC, durante 3 dias após o início da fase exponencial, demonstrou ter consequências severas na taxa fotossintética, diminuindo não só a taxa de produção de O2 mas também a eficiência do PSII. Observou-se uma maior atividade do lado dador do
PSII, onde ocorre a fotólise da água, o que levou a uma absorção excessiva de energia, que não terá sido devidamente transportada através da cadeia transportadora de eletrões, sendo por isso dissipada. De forma a evitar danos causados por espécies reativas de oxigénio e compensar a eficiência baixa do PSII, verificou-se um aumento de carotenoides (fucoxantina, diadinoxantina e diatoxantina) e pigmentos fotossintéticos como a clorofila a. Ao expor a cultura de P. tricornutum simultaneamente aos dois tipos de stress, verificou-se o aumento na intensidade dos danos, assim como alterações mais severas no metabolismo lipídico.
A exposição do P. tricornutum a temperaturas de crescimento elevadas e combinadas com a exposição a concentrações elevadas de Ni levou a uma diminuição na percentagem do ómega-3 ácido eicosapentaenóico (EPA) (~30 % vs ~18 %), que se fez sentir igualmente nas classes lipídicas que compõem as membranas dos tilacoides, principalmente no monogalactosildiacilglicerol (MGDG). O stress combinado levou, por outro lado a um aumento de ácidos gordos saturados (C16:0) e monoinsaturados (C16:1), abundantes nos lípidos de reserva. Como consequência destas alterações o índice de duplas ligações, que é um indicador da fluidez da membrana, tendeu a diminuir e o rácio ómega-6 / ómega-3 a aumentar o que causou uma diminuição do valor nutricional da diatomácea. O conteúdo em ácidos gordos totais aumentou em resposta aos tratamentos testados, sendo esta, uma resposta característica em condições de stress que induzem um desvio do metabolismo fotossintético ótimo, e a respetiva acumulação de açúcares. Enquanto a exposição ao Ni levou a uma diminuição da abundância em MGDG, devido à ação de fosfolipases A com atividade galactolipásica, a exposição à onda de calor, levou a um aumento deste lípido, provavelmente como consequência de uma maior expressão do gene que codifica a MGDG sintetase, responsável pela sua biossíntese. Igualmente, em resposta ao aumento da temperatura, uma diminuição da quantidade de fosfatidilglicerol, foi observada, uma resposta característica de tilacoides senescentes, e uma correspondente compensação em sulfoquinovosildiacilglicerol (ambos aniónicos). O estudo da expressão génica revelou uma maior abundância de transcritos de duas dessaturases de ácidos gordos (Δ6 e Δ5), que se pensa estarem envolvidas nos passos finais das vias biossintéticas do C16:3 e C20:5, respetivamente. Embora a percentagem de C16:3 aumente na classe MGDG, a abundância de C20:5 não, o que pode revelar regulações pós-transcricionais ou inibição da atividade enzimática. A expressão génica da anidrase carbónica, responsável pelo transporte de CO2 para a Rubisco aumentou nos organismos expostos a
26 ºC, possivelmente de forma a favorecer a atividade da Rubisco, inibida a temperaturas crescentes. Comparando os resultados da análise de consumo de oxigénio com os dados referentes à fotobiologia dos organismos, foi possível concluir que a capacidade de oxigenação da água do mar pelo P.- tricornutum será negativamente afetada quando sujeito ao stresses analisados.
A análise integrada de métodos biofísicos, bioquímicos e moleculares permitiu aprofundar o conhecimento sobre os mecanismos de defesa do P. tricornutum quando exposto a stresses térmicos e a metais pesados. Ao longo desta dissertação foram discutidos os prováveis impactos destes stresses mas também propostos possíveis biomarcadores de stress térmico e de exposição ao Ni, tais como a
VII eficiência do PSII, a abundância de ácidos gordos C16:0 e EPA e o rácio ómega-6 / ómega-3. O valor da diatomácea P. tricornutum como espécie sentinela foi mais uma vez confirmado e o seu uso biotecnológico para produção de lípidos para biodiesel ou aquacultura ou fucoxantina para uso farmacêutico e nutricional apresenta um caráter promissor para estudos futuros.
Palavras-chave: Aquecimento global, EPA, Fotossíntese, Níquel, Phaeodactylum tricornutum
Summary
Global warming and heavy metal pollution are being aggravated by anthropogenic activities. The average atmospheric temperature is increasing and the once rare thermal events are becoming more frequent. Since the 1980s, the Mediterranean, more specifically the Iberian Peninsula, has been subject to phenomena such as heat waves that have become increasingly frequent with longer duration and intensity. These events mainly affect air temperature, but the surface of the sea water has slightly increased in recent years, and the surface water of the Tagus estuary reached 26 °C during the particularly hot summer of 2005. In addition to heavy metal pollution, these heat waves can induce stresses with harmful consequences for organisms and ecosystems that are forced to live in sub-optimal conditions.
The objective of this dissertation was to evaluate the impact of a heat wave of similar magnitude of the one felt in 2005 in the Tagus estuary and pollution by heavy metals, more specifically, by nickel, in the growth, photosynthesis, metabolism of omega-3 and -6 fatty acids and gene expression of Phaeodactylum tricornutum, a model diatom that is one of the components of the estuarine ecosystem basis. For this, the physiological performance of Phaeodactylum tricornutum cells at two temperatures - control (18 ° C) and heat wave (26 °C, for 3 days) - and exposure to three concentrations of nickel - 1, 2 and 5 μg L-1 was assessed through nondestructive methods such as PAM fluorometry and biochemical
methods such as gas- and thin layer chromatography and quantitative PCR.
The results suggested that the effect of nickel and a temperature increase differently affected photosynthesis. While nickel did not affect the efficiency of photosystem II at the highest concentrations, there was a decrease in the abundance of the main photosynthetic pigments - chlorophyll a and the carotenoid fucoxanthin, reducing the rate of O2 production. The temperature rise caused a decrease in
the efficiency of photosystem II (PSII) and an increase in the activity of its donor side where the complexes involved in the water photolysis can be found. Also observed was a decrease in the quality of the electron transport, which lead to an increase of absorbed energy dissipation. Moreover, an increased concentration of the photosynthetic pigments, such as chlorophyll a, was observed, as a possible compensation mechanism due to the low efficiency of PSII and an increase of carotenoids such as diatoxanthin involved in the protection against reactive oxygen species. The combined effect of both stresses caused the most severe damage to lipid metabolism. There was a decrease in eicosapentaenoic acid (EPA) abundance, double bond index and an increase in the value of the ratio inversely related to the nutritional value (omega-6 / omega-3 ratio). There were also changes in the abundance of the lipid classes that build thylakoid membranes and in their composition - such as a decrease of EPA in monogalactosyldiacylglycerol (MGDG), decrease of phosphatidylglycerol and variations in abundance of MGDG and digalactosyldiacylglycerol. Those results were supported by gene expression analyses of enzymes related to the synthesis and degradation of lipids via quantitative PCR. The temperature rise induced an increase in the gene expression of MGDG synthase and the desaturase responsible for the
VIII synthesis of C16:3 in MGDG also increased its expression, in agreement with the increasing abundance of this fatty acid in this lipid class.
Possible impacts of metal pollution and heat waves on the ecosystems and trophic chains were proposed. Also, possible biomarkers of thermal stress and heavy metals were identified, such as photosystem II efficiency, abundance of C16:0 and EPA fatty acids and the omega-6 / omega-3 ratio. The value of P. tricornutum as a sentinel species has again been confirmed and its biotechnological value for biodiesel production or fucoxanthin synthesis for pharmaceutical and nutritional purposes showed to be promising features for future studies.
IX
Abbreviations
AOEC – Activated oxygen-evolving complex
ASQ – Acyl-SQDG C14:0 – Myristic acid C16:0 – Palmitic acid C16:1 – Palmitoleic acid C16:2n-4 – Hexadecadienoic acid C16:2n-7 – Hexadecadienoic acid C16:3 – Hexadecatrienoic acid C16:4 – Hexadecatetraenoic acid C18:3 – γ-linolenic acid C18:4 – Stearidonic acid C20:4 – Arachidonic acid C20:5 – Eicosapentaenoic acid C22:6 – Docosahexaenoic acid
CA-7 – Carbonic anhydrase 7
cDNA – Complementary DNA
Chl – Chlorophyll
DAG – Diacylglycerol
DBI – Double bond index
Ddx – Diadinoxanthin
DES – Deepoxidation state
DGAT – Diacylglycerol acyl transferase
DGDG – Digalactosyldiacylglycerol
DHA – Docosahexaenoic acid
Dtx – Diatoxanthin
EFA – Essential fatty acids
Elo – Elongase
EPA – Eicosapentaenoic acid
ER – Endoplasmic Reticulum
X FAD – Fatty Acid Desaturase
FAMEs – Fatty acid methyl esters
FAS – Fatty acid synthase
FCP – Fucoxanthin-chlorophyll protein
Fx – Fucoxanthin
GC-FID – Gas chromatography-flame ionization detection
GPS – Gauss-Peak spectra
IPCC – The Intergovernmental Panel on Climate Change
LC – Light Curve
LC - PUFA – Long Chain - Polyunsaturated fatty acids
MDA – Malondialdehyde
MGDG – Monogalactosyldiacylglycerol
NL – Neutral lipids
NPQ – Non-photochemical quenching
OECD – Organization for Economic Cooperation and Development
PAM Fluorometry – Pulse Amplitude Modulated Fluorometry
PAR – Photon flux density
PC – Phosphatidylcholine
PE – Phosphatidylethanolamine
PG – Phosphatidylglycerol
PI – Phosphatidylinositide
PLA2 – Phospholipase A2
PNPLA 3 – Patatin-like phospholipase domain-containing protein 3
PSII – Photosystem II
QA – Quinone A
QB – Quinone B
qPCR – Quantitative Polymerase chain reaction
RC – Reaction centres
RLC – Rapid light curves
ROS – Reactive oxygen species
XI SQDG – Sulfoquinovosyldiacylglycerol
TAG – Triacylglycerol
TBARS – Thiobarbituric acid reactive substances
TBP – Tata Box binding protein
TCA – Trichloroacetic acid
TLC – Thin layer chromatography
XII
List of tables and figures
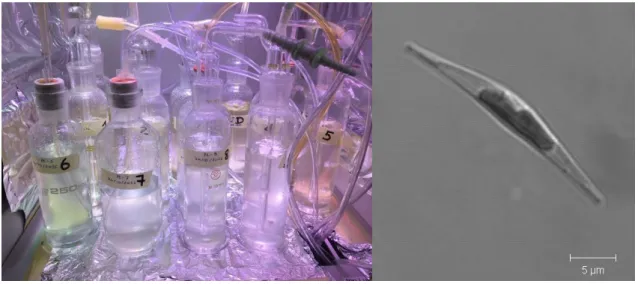
Figure 1.1 – Phaeodactylum tricornutum cell cultures (left) and fusiform morphotype (right).
Fusiform morphotype microscopy image was published on DiatomCyc (v1.0), an online database of P. tricornutum.
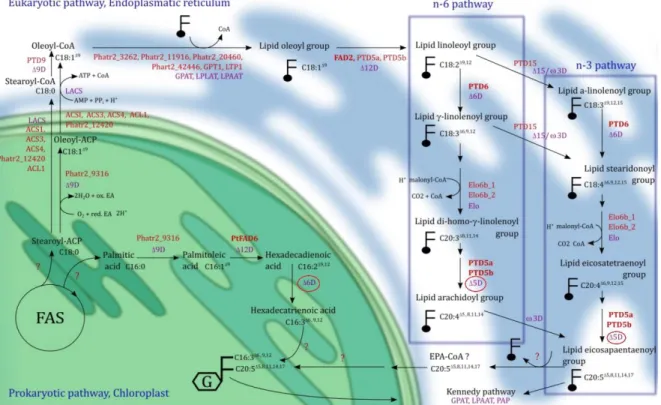
Figure 1.2 – Overview of the metabolic fatty acid synthesis pathways in P. tricornutum. Prokaryotic
and eukaryotic pathways are represented in green and blue, respectively, and the enzymes involved include elongases (Elo) and desaturases (ΔD) which are represented in purple. Putative genes and enzymes encoded by genes already identified are marked in red and bold, respectively. Question marks indicate that the reaction and respective enzymes are not predicted. Red circles mark desaturases analysed in this dissertation. This figure was published by Mühlroth et al. (2013).
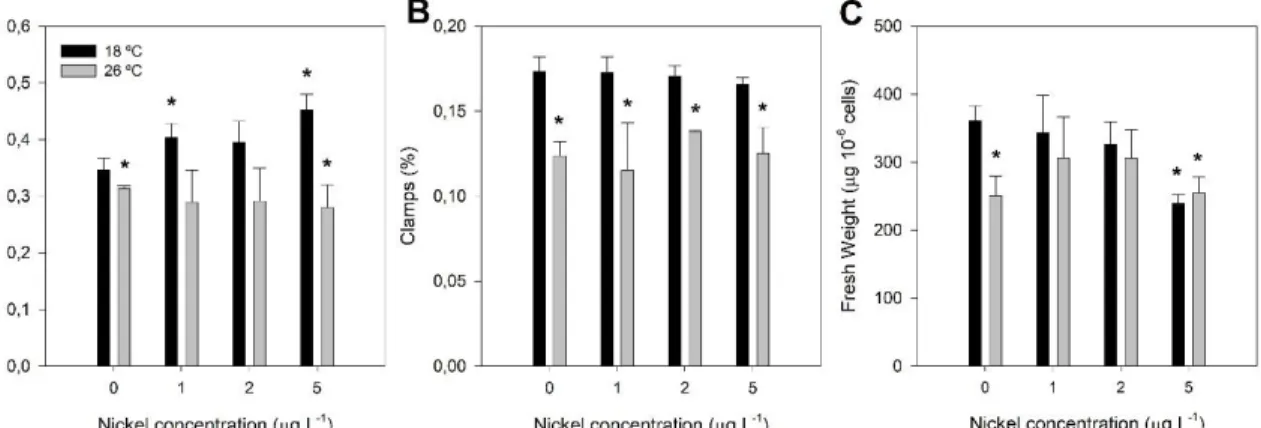
Figure 3.1 – Growth parameters of P. tricornutum grown at 18 °C (black) and exposed to a heat wave treatment (26 °C, for three days) (grey) with increasing nickel concentrations (1, 2 and 5 µg L-1). A) Specific growth rate; B) Relative abundance of clamps (aggregates of more than two cells);
C) Fresh weight. Values correspond to average ± standard errors, n = 3; asterisks indicate significant differences between treatments and control cultures grown at 18 ºC without nickel (p ≤ 0.05).
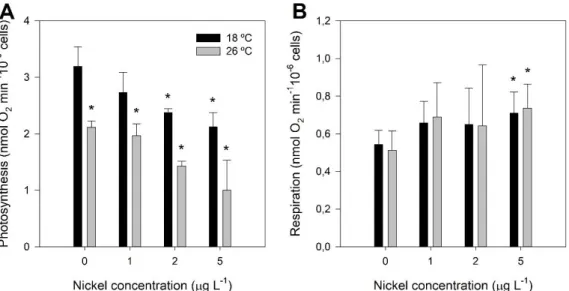
Figure 3.2 – Photosynthetic and respiratory O2 flux rates of P. tricornutum grown at 18 °C (black)
and exposed to a heat wave treatment (26 °C, for three days) (grey) with increasing nickel concentrations (1, 2 and 5 µg L-1). A) Photosynthetic rate; B) Respiration rate. Values correspond to
average ± standard error, n = 3; asterisks indicate significant differences between treatments and control cultures grown at 18 °C without nickel (p ≤ 0.05).
Table 3.1 – Rapid Light Curves (RLC) and JIP- derived parameters in samples of P. tricornutum grown at 18 °C and exposed to a heat wave (26 °C, for three days) with increasing nickel concentrations (1, 2 and 5 µg L-1). Values correspond to average of n = 3 samples; Bold values indicate
significant differences between treatments and control cultures grown at 18 ºC without nickel exposure (p ≤ 0.05). Abbreviations in appearance order include: α (photosystem II efficiency), ETRmax (maximum
relative electron transport), β (photoinhibition parameter); AOECs (activated oxygen-evolving complexes), Area (pool of oxidized quinones), N (Number of electrons transferred into the electron transport chain), SM (energy needed to close all reaction centres), PG (grouping probability, a direct
measure of the connectivity between PSII antennae). Other meanings to each parameter can be found in supplemental Table S1.
Figure 3.3 – Phenomenological energy fluxes in samples of P. tricornutum. A) Cultures grown at
18 ºC; B) Cultures grown at 26 °C for three days with final nickel concentrations of 1, 2 and 5 µg L-1.
Parameters include absorbed energy flux per section (ABS/CS); Trapped energy flux per cross-section (TRO/CS); Electron transport energy flux per cross-section (ETO/CS); Dissipated energy flux per
cross-section (DIO/CS) and number or reaction centres per cross-section (RC/CS). Values correspond to
average of n = 3.
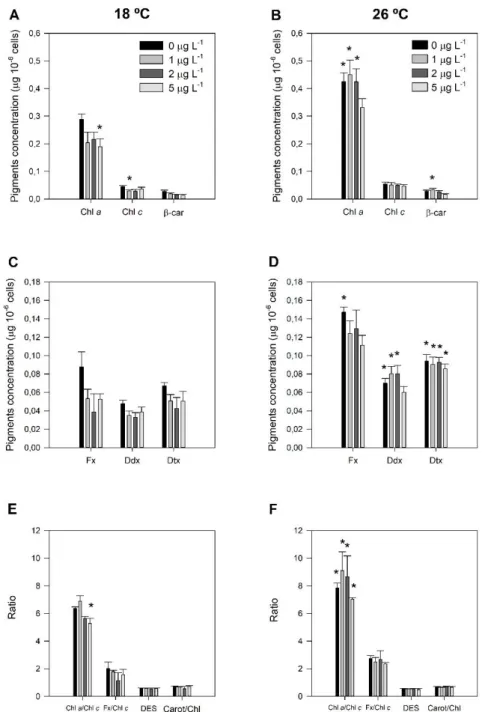
Figure 3.4 – Pigment composition of P. tricornutum grown at 18 °C (left) and exposed to a heat wave treatment (26 °C, for three days) (right) with increasing nickel concentrations (1, 2 and 5 µg L-1). A - B) Concentration of chlorophyll a (Chl a), chlorophyll c (Chl c) and β-carotene (β-car);
C - D) Concentration of fucoxanthin (Fx), diadinoxanthin (Ddx) and diatoxanthin (Dtx); E - F) Ratio of chlorophyll a and c, ratio of fucoxanthin and chlorophyll c, de-epoxidation state (DES) and ratio between carotenoids and chlorophylls. Values correspond to average ± standard errors, n = 3; asterisks
XIII indicate significant differences between treatments and control cultures grown at 18 °C without nickel exposure (p ≤ 0.05).
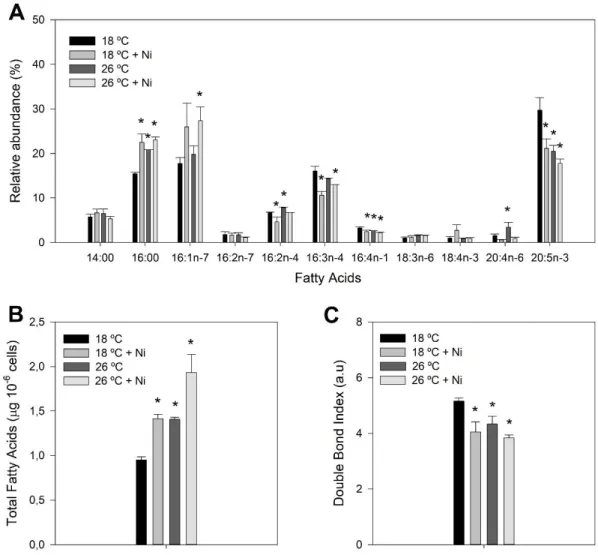
Figure 3.5 – Fatty acid composition of P. tricornutum samples grown at 18 °C (black) and exposed to a heat wave treatment (26 °C, for three days) (dark grey) with nickel exposure (5 µg L-1, medium
and light grey). A) Relative abundance of fatty acids; B) Total fatty acids; C) Double bond index (DBI).
Values correspond to average ± standard error, n = 3; asterisks indicate significant differences between treatments and control cultures grown at 18 °C without nickel exposure (p ≤ 0.05).
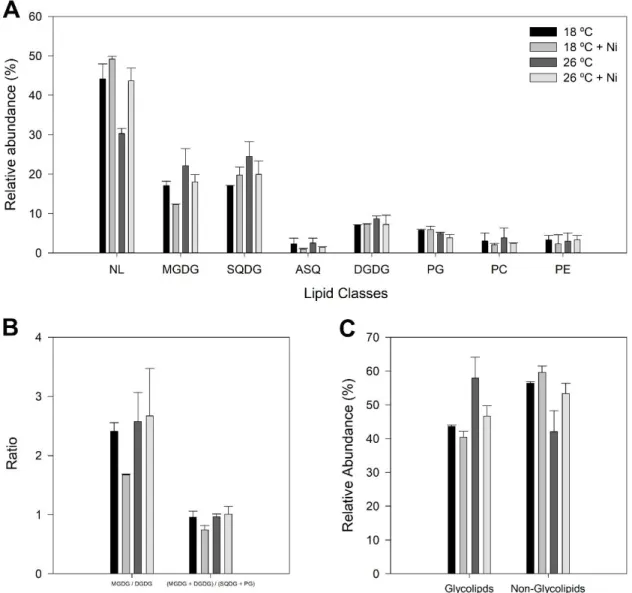
Figure 3.6 – Lipid class analysis and derived parameters of P. tricornutum samples grown at 18 °C (black) and exposed to a heat wave treatment (26 °C, for three days) (dark grey) with nickel exposure (5 µg L-1, medium and light grey). A) Relative abundance of lipid classes; B) Ratio between
MGDG and DGDG and ratio between the neutral and negatively charged lipid classes composing the thylakoid membrane; C) Relative abundance of glycolipids and non-glycolipids. Lipid classes identified included neutral lipids (NL), monogalactosyldiacylglycerol (MGDG), sulfoquinovosyldiacylglycerol (SQDG), acylSQDG (ASQ), digalactosyldiacylglycerol (DGDG), phosphatidylglycerol (PG), phosph-atidylcholine (PC) and phosphatidylethanolamine (PE). Values correspond to average ± standard error, n = 2.
Figure 3.7 – Composition and relative abundance of fatty acids in neutral lipids (NL) of P. tricornutum samples grown at 18 °C (black) and exposed to a heat wave treatment (26 °C, for three days) (dark grey) with nickel exposure (5 µg L-1, medium and light grey). Values correspond
to average relative percentage ± standard error, n = 2.
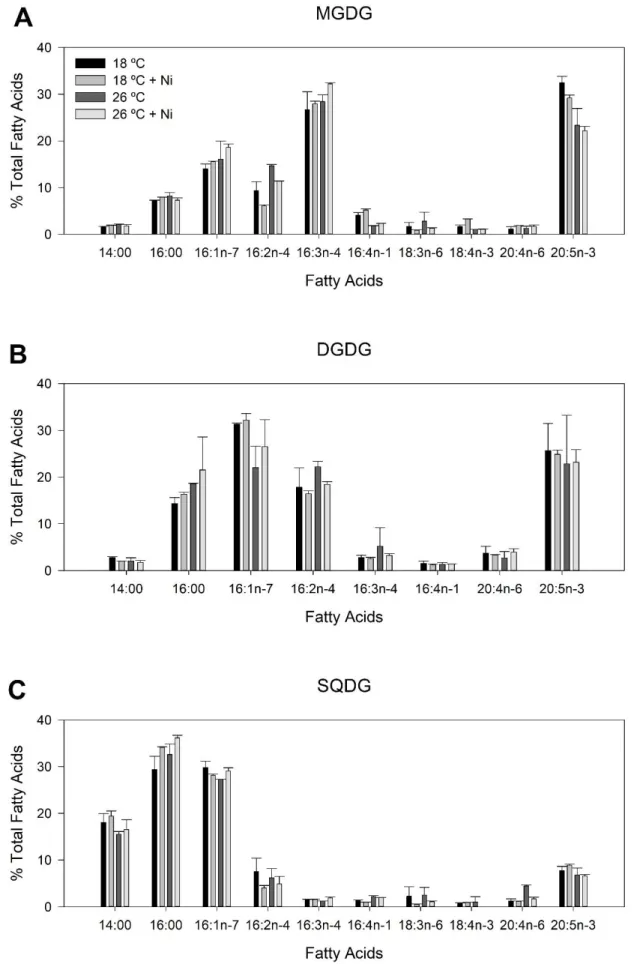
Figure 3.8 – Fatty acid composition of lipid classes of P. tricornutum samples grown at 18 °C (black) and 26 °C (for three days) (dark grey) with nickel exposure (5 µg L-1, medium and light
grey). A) MGDG; B) DGDG; C) SQDG. Values correspond to average ± standard error, n = 2;
Figure 3.9 – Lipid peroxidation products of P. tricornutum samples grown at 18 °C (black) and exposed to a heat wave treatment (26 °C, for three days) (grey) with increasing nickel concentrations (1, 2 and 5 µg L-1). Values correspond to average ± standard error, n = 3; asterisks
indicate significant differences between treatments and control cultures grown at 18 °C without nickel exposure (p ≤ 0.05).
Figure 3.10 – Fold change in the expression of lipid metabolism and photosynthetic genes of P. tricornutum samples grown at 18 °C and exposed to a heat wave treatment (26 °C, for three days) (grey) with nickel exposure (5 µg L-1, black and medium grey). Data obtained by qPCR
analysis and expressed according to the Livak method. Tested genes encoded the endoplasmic reticulum Δ5 fatty acid desaturase (Δ5FAD), the plastidΔ6 fatty acid desaturase (Δ6FAD), the diacylglycerol acyl transferase (DGAT), patatin-like phospholipase domain- containing protein 3 (PNPLA3), the phospho-lipase A2 (PLA2), the monogalactosyldiacylglycerol synthase (MGDG synth), the carbonic anhydrase 7
(AC-7) and urease α-subunit (Ur α-subunit). Positive values correspond to upregulation and negative values correspond to downregulation. Values correspond to average ± standard error, n = 3; asterisks indicate significant differences between treatments and control cultures grown at 18 °C without nickel exposure (p ≤ 0.05).
Figure 4.1 – Carotenoid biosynthesis pathways in P. tricornutum. Blue and green define alternative
pathways. Bold marks the carotenoids analysed in this study. Adapted from Kuczynska et al. (2015).
XIV
Supplemental Figure S1 – Fatty acid distribution in P. tricornutum samples grown at 18 ºC and exposed to a heat wave treatment (26 ºC, for three days) and increasing nickel concentrations (1, 2 and 5 µg L-1). Results were obtained through direct methylation of 8 mL pellets; Shades of green,
orange, blue and purple mark samples without Ni exposure and exposure to final Ni concentrations of 1, 2 and 5 µg L-1, respectively; Shades of each colour mark exposure to stress conditions in a period of
24, 48 and 72 hours; n = 1.
Supplemental Figure S2 – Total fatty acid content and DBI of P. tricornutum samples grown at 18 ºC and exposed to a heat wave treatment (26 ºC, for three days) and increasing nickel concentrations (1, 2 and 5 µg L-1). Results were obtained through direct methylation of 10 mL pellets;
Shades of green, orange, blue and purple mark samples without Ni exposure and exposure to final Ni concentrations of 1, 2 and 5 µg L-1, respectively; Shades of each colour mark exposure to stress
1
1. Introduction
Fossil fuel combustion, agriculture and industrial activity have been altering the chemistry of the oceans, not only on coastal waters but also in the open ocean (Doney, 2010). Climate change is mainly caused by changes in the atmospheric composition due to these activities (Herring et al., 2015; Karl and Trenberth, 2003; Khandekar et al., 2005) and often induces multiple stresses on marine ecosystems, from gradual acidification and salinity alterations to ocean warming (Doney et al., 2012). According to The Intergovernmental Panel on Climate Change (IPCC) WG2 5th Assessment Report (IPCC, 2014),
Earth is suffering an enhancement of global air temperature and an increase in the frequency and duration of extreme heat events such as heat waves. These phenomena last at least five consecutive days, with maximum daily temperature exceeding the average maximum temperature by 5 °C (World Meteorological Organization, WMO). This enhancement in the global air temperature is occurring at a much greater rate per decade than previous observations. For example, in the last 45 years the average increase of temperature hit 0.17 ºC per decade (Dahlman, 2017). Although this effect is mostly felt in terms of air temperature, there is also a rise in the average ocean temperature (approximately 0.06 ºC per decade) (Dahlman, 2017). Western Europe but mostly the Iberian Peninsula have faced a stronger warming since the 1980s, mostly during the summer (Baldi et al., 2005; Dasari et al., 2014; EEA, 2012) and surface water temperature has reached 26 ºC in the Tagus estuary in 2005 (Gameiro et al., 2007).
Metal pollution is also a result of anthropogenic activity such as sediment removal at the bottom of water bodies (dredging) which leaves contaminated sediments that can contain several toxic elements such as cobalt, copper, zinc, mercury, lead and nickel (Ni) capable of reaching the water column in elevated concentrations (Eggleton and Thomas, 2004). Nickel is the 24th most abundant element in the Earth’s
crust (Bencko, 1983) and is classified as an essential trace metal for several species playing key roles in metabolic processes as a cofactor of numerous metalloenzymes such as glyoxalase I or urease, the latter being involved in nitrogen uptake through urea assimilation (Boer et al., 2014; Seregin and Kozhevnikova, 2006; Thauer et al., 1980). This means that variations in the concentration of this trace metal can induce deficit or toxicity problems (Bencko, 1983) via disruption of the homeostasis of divalent cations such as Ca2+ and Mg2+ and damage to cell components through the formation of reactive
oxygen species (ROS) (Brix et al., 2017). Therefore, heat waves and metal pollution, alone or combined, can dramatically change the structure of marine ecosystems but also the quality and composition of the primary production at the marine food webs and affect the organisms relying on its unique metabolites (Galloway and Winder, 2015; Maazouzi et al., 2008).
Diatoms are a major group of microalgae at the base of the marine food webs responsible for approximately 20 % of the global primary photosynthetic production (Domingues et al., 2012). The pennate diatom Phaeodactylum tricornutum is a photosynthetic unicellular alga with a fully sequenced genome (Bowler et al., 2008) capable of producing up to 35 % of eicosapentaenoic acid (EPA, C20:5) (Hamilton et al., 2014) and face multiple stresses (Cabrita et al., 2016; Jiang and Gao, 2004; Kudo et al., 2000; Sigaud and Aidar, 1993). It has been described to present three different morphologies – oval, fusiform and triradiate – and a recently reported cruciform morphology, that can be interconverted when stimulated by stress (He et al., 2014). The fusiform morphotype is the most common in laboratory experiments (Figure 1.1) and the oval morphotype mostly occurs when P. tricornutum leaves the water column and therefore is considered a benthic morphotype (Tesson et al., 2009). These features make it
2 a powerful tool to study the impact of stressors on metabolic processes and their regulation through gene expression and predict possible consequences on the food web and marine ecosystems.
Figure 1.1 – Phaeodactylum tricornutum cell cultures (left) and fusiform morphotype (right). Fusiform morphotype
microscopy image was published on DiatomCyc (v1.0), an online database of P. tricornutum.
The de novo fatty acid biosynthesis begins with acetyl-CoA and malonyl-CoA precursors and the activity of fatty acid synthases (FAS). In P. tricornutum it has been described to follow two main pathways, as in higher plants (Dolch and Maréchal, 2015). The prokaryotic pathway takes place inside the chloroplast stroma where usually four enzymatic processes lead to incorporation of two carbons each cycle forming fatty acids from 14 carbons up to 18 carbons. Fatty acids with more than 18 carbons are elongated by elongases in the eukaryotic pathway which occurs in the endoplasmic reticulum. The synthesised fatty acids are then used to build membrane lipids such as glycerolipids and other products. From FA incorporation results thylakoid membrane lipids such as monogalactosyldiacylglycerol (MGDG) and digalactosyldiacylglycerol (DGDG) but also the negatively charged phosphatidylglycerol (PG), sulfoquinovosyldiacylglycerol (SQDG) and the acyl-SQDG (Seiwert et al., 2017). Other lipid classes include phosphatidylcholine (PC), phosphatidylethanolamine (PE) and phosphatidylinositide (PI) which are likely synthesised at extraplastidic membranes (Abida et al., 2015). These lipid classes and mostly MGDG, possess a high percentage of the long-chain polyunsaturated fatty acid (LC-PUFA), EPA (Abida et al., 2015) the synthesis of which has not been well elucidated and is believed to be a result from a combination of an omega 6 (ɷ-6) and omega-3 (ɷ-3) pathways in which essential fatty acids (EFA) such as the ɷ-6 linoleic acid (C18:2) and ɷ-3 linolenic acid (C18:3) through consecutive elongation and desaturation lead to EPA synthesis being the last step possibly catalyzed by activity of two fatty acid desaturases - ERΔ5FAD.1 and ERΔ5FAD.2 (Arao and Yamada, 1994; Domergue et al., 2002; Mühlroth et al., 2013) (Figure 1.2). The benefits of EPA and docosahexaenoic acid (DHA, C22:6), another ɷ-3 fatty acid, are well established in animals and involve stabilization of blood pressure, membrane fluidity regulation, anti-inflammatory properties and good neurological development (Wiktorowska-Owczarek et al., 2015).
3
Figure 1.2 – Overview of the metabolic fatty acid synthesis pathways in P. tricornutum. Prokaryotic and eukaryotic pathways are represented in green and blue, respectively, and the involved enzymes include elongases (Elo) and desaturases (ΔD) which are represented in purple. Putative genes and enzymes encoded by genes already identified are marked in red and bold, respectively. Question marks indicate that the reaction and respective enzymes are not predicted. Red circles mark desaturases analysed in this dissertation. This figure was published by Mühlroth et al. (2013).
The objective of this dissertation was to evaluate the impact of a heat wave of similar magnitude of the one felt in the Tagus estuary in 2005 and pollution by heavy metals, more specifically, by nickel (Ni2+)
on growth, photosynthesis, metabolism of omega-3 and -6 fatty acids and gene expression of Phaeodactylum tricornutum, which is one of the components of the ecosystem basis of the estuary (Gameiro and Brotas, 2010). For this, the performance at two temperatures - control (18 °C) and heat wave (26 °C, for 3 days) - and exposure to three concentrations of nickel - 1, 2 and 5 μg L-1 was assessed.
To assess possible changes in the photochemistry of P. tricornutum, non-destructive methods such as Pulse Amplitude Modulation (PAM) Fluorometry and Clark-type oxygen electrode were used. PAM fluorometry evaluates the photonic energy harvest and consequent transformation into electronic energy using chlorophyll a (Chl a) fluorescence, giving important insights on photon capture, energy transduction and dissipation (Anjum et al., 2016) while Clark-type electrode measures O2 production
and consumption rates (Armstrong, 1994). Thin Layer Chromatography (TLC) and Gas Chromatography-flame ionization detection (GC-FID) are methods that separate lipids into individual classes and allow a precise identification and quantification of fatty acids present in those classes (Abida et al., 2015; Popko et al., 2016; Shen et al., 2016) which have distinct fatty acid signatures. Real-Time PCR or quantitative PCR (qPCR) was used to detect changes in the expression of genes related to lipid metabolism and photosynthesis and allow a molecular integration of the biochemical and physiological parameters.
4
2. Materials and methods
2.1. Experiment set-up
Control axenic cultures of the diatom Phaeodactylum tricornutum Bohlin, 1898 (Bacillariophyceae) (IO 108-01, IPMA) were maintained in 250 mL flasks containing f/2 medium (Guillard and Ryther, 1962), in a growth chamber (Fytoscope FS130), at temperature-controlled conditions (18 ± 1 °C), with constant aeration, during 5 days. The chamber was programmed with a sinusoidal function simulating sunrise and sunset, with a light intensity at noon to simulate a natural light environment (RGB 1:1:1, Maximum PAR 80 µmol photons m-2 s-1, 14/10 h day/night rhythm). Initial cell concentration was approximately
2.7x10⁵ cells mL-1, following the Organization for Economic Cooperation and Development (OECD)
guidelines for algae bioassays (OECD, 2002) and the therein recommended initial cell density for microalgae cells with similar size to P. tricornutum. In parallel, P. tricornutum cultures at the beginning of the exponential phase (48 hours later) were grown as the control cultures, but subjected to a temperature of 26 ± 1 °C, mimicking the maximum water temperature registered by Gameiro et al. (2007) in the Tagus Estuary, during the 2005 heat wave. For both temperatures, three concentrations of Ni were tested through addiction of NiCl2 to a final concentration of 1, 2 and 5 µg L-1. Concentrations
were chosen to match the Ni concentration determined during dredging in the Tagus estuary (1 µg L-1)
(Cabrita, 2014) and plausible higher concentrations (2 and 5 µg L-1). All materials used were cleaned
with HNO3 (20 %) for two days and rinsed thoroughly with Milli-Q water (18.2 M cm) and autoclaved
to avoid contamination. Culture manipulations were performed in a laminar air flow chamber.
2.2. Cell growth rates
Samples of P. tricornutum of both control and stresses (temperature and/or Ni exposed) experiments were taken for cell counting on a Neubauer improved counting chamber, under an Olympus BX50 (Tokyo, Japan) inverted microscope, at 400 ampliation. Growth was estimated as the mean specific growth rate per day, calculated from the difference between initial and final logarithmic cell densities divided by the exposure period, as proposed by Santos-Ballardo et al. (2015). The number of cells aggregated in pairs or in groups of more than two (clamps) was also registered, in order to calculate their relative abundance. For determination of fresh weight and collection of samples for biochemical and molecular analyses, cells were collected at the end of the experiments, centrifuged at 4000 g for 15 min at 4 °C and after supernatant removal, immediately frozen in liquid nitrogen and stored at -80 °C. Three biological replicates for each analysis were used.
2.3. Oxygen evolution rates
At the end of the experiments, the photosynthetic and respiratory oxygen production and consumption, were assessed, respectively, using 1 mL culture samples exposed to white light (LS2 light source) emitting 100 µmol photons m-2 s-1 using a Clark-type electrode (S1 Electrode Disc, Hansatech
Instruments, England) with constant mixing (Matos et al., 2009). Temperature was maintained at experimental growth conditions (18 °C and 26 °C) by a circulating water bath directly connected to the electrode chamber. Data analysis was made with OxygraphPlus software.
5
2.4. Pulse Amplitude Modulated (PAM) Fluorometry
Pulse amplitude modulated (PAM) chlorophyll fluorescence measurements were performed using a FluoroPen FP100 (Photo System Instruments, Czech Republic), on samples using a 1 mL cuvette. All fluorometric analyses were carried out at the end of the experimental period in dark-adapted samples. Rapid Light Curves (RLC) were achieved using the pre-programmed light curve (LC1) protocol which performs successive measurements of the sample photosystem II efficiency (ɸPSII) under various light intensities (20, 50, 100, 200, 300 and 500 µmol photons m-2 s-1) of continuous illumination relating the
rate of photosynthesis to photon flux density (PAR). Chlorophyll transient light curves were also assessed by the OJIP test. In short, the level O represents all the open reaction centres (RC) at the onset of illumination with no reduction of quinone a (QA) (fluorescence intensity lasts for 10 ms). The rise of
transient fluorescence from O to J indicates the net photochemical reduction of QA (the stable primary
electron acceptor of PSII) to QA- (lasts for 2 ms). The phase from J to I was due to all reduced states of
closed RCs such as QA- QB-, QA QB2- and QA- QB H2 (lasts for 2-30 ms). The level P (300 ms) coincides
with maximum concentration of QA- QB2 with plastoquinol pool maximally reduced. The phase P also
reflects a balance between light incident at the PSII side and the rate of utilization of the chemical (potential) energy and the rate of heat dissipation (Zhu et al., 2005). Supplemental Table S1 summarizes all the parameters that were computed from the fluorometric data.
2.5. Pigment analysis
Pigments were extracted with 100 % acetone and maintained in a cold ultra-sound bath for 2 min to ensure complete disaggregation of the cell material. Pigments were extracted at -20 °C for 24 h in the dark to prevent degradation (Cabrita et al., 2016) and then centrifuged for 15 min at 4000 g at 4 °C. The supernatants were scanned in a dual beam spectrophotometer from 350 nm to 750 nm at 0.5 nm steps. The absorbance spectrum was introduced in the Gauss-Peak Spectra (GPS) fitting library, using SigmaPlot Software. Pigment concentrations were determined using the algorithm developed by Küpper et al. (2007). Thus, Chlorophyll a and c, Pheophytin a, β-carotene, Fucoxanthin (Fx), Diadinoxanthin (Ddx) and Diatoxanthin (Dtx) were detected. The De-Epoxidation State (DES) was calculated as:
2.1 DES = ([Dtx] / ([Dtx] + [Ddx])
2.6. Fatty acid and Lipid classes analysis
2.6.1. Extraction of Total Fatty Acids
Samples were boiled in 1 mL of Milli-Q water (18.2 M cm) for 3 min to inactivate lipases and then sonicated to assure complete cell disruption. Lipophilic compounds were extracted with chloroform: methanol: water (7:7:7, v/v/v), on a mortar and pestle to ensure cell disruption and maximum lipid extraction. After homogenization through vortex, extraction samples were centrifuged at 4000 g for 5 min at room temperature. The lower phase was collected, the solvent evaporated under a N2 flow in a
6
2.6.2. Gas Chromatography and Thin-layer Chromatography
Trans-esterification of 100 µL of the lipid extract solution was performed, in freshly prepared methanol-sulfuric acid (97.5:2.5, v/v), at 70 °C for 60 min, as previously described for higher plants leaves (Gameiro et al., 2016; Duarte et al., 2017) using pentadecanoic acid (C15:0) as an internal standard. Fatty acids methyl esters (FAMEs) were rescued using petroleum ether, dried under a N2 flow and
re-suspended in an appropriate amount of hexane. One microlitre of the FAME solution was analysed in a gas chromatograph (Varian 430-GC gas chromatograph) equipped with a hydrogen flame ionization detector set at 300 °C. The temperature of the injector was set to 270 °C, with a split ratio of 50. The fused-silica capillary column (50 m x 0.25 mm; WCOT Fused Silica, CP-Sil 88 for FAME; Varian) was maintained at a constant nitrogen flow of 2.0 mL min-1 and the oven temperature set at 190 °C. Fatty
acids were identified by comparison of their retention times with standards (Sigma-Aldrich) and chromatograms analysed by the peak surface method, using the Galaxy software. The double bond index (DBI) and the ɷ-6 / ɷ-3 ratios were calculated as follows:
2.2 . DBI = 2 [(% monoenes) + (2 x % dienes) + (3 x % trienes) + (4 x % tetraenes) + (5 x %
pentaenes)] / 100
2.3 . ɷ-6 / ɷ-3 = (C18:3 + C20:4) / (C18:4 + C20:5)
Separation of lipids into various classes was performed using one-dimensional TLC on silica gel plates (G-60, Merck, VWR, Fontenay-sous-bois, France) with a solvent system developed by Lepage (1967). The various lipid classes were observed under UV light after the silica gel plate was sprayed with primulin (0.01 % in 80 % acetone). The bands were scrapped off and methylated as described above and analyzed through GC to determine the fatty acid composition and content. Triplicate total lipid samples of P. tricornutum were pooled into one combined extract treatment and TLC analysis was performed in duplicate.
2.7. Quantification of lipid peroxidation products
Quantification of the lipid peroxidation products was performed as described before (Duarte et al., 2015), with minor modifications, such as homogenization in 10 % (v/v) Trichloroacetic acid (TCA) and brief sonication. Absorbance values at 532 nm and 600 nm were registered and the concentration of TBARS was calculated using the molar extinction coefficient, 155 mM-1 cm-1 (Heath and Packer, 1968).
2.8. Gene expression analysis
2.8.1. RNA extraction
Samples of P. tricornutum previously collected for gene expression analysis were frozen in liquid N2
after being taken out of storage. Extraction of RNA was performed using the Qiagen RNeasy Mini Kit according to manufacturer’s instructions with small modifications which included a 5 min sonication of the samples to disrupt diatom cells. The used buffer was RLT with 1% (v/v) freshly added β-mercaptoethanol. To eliminate remaining DNA, digestion “on column” was performed with DNase (RNase-Free DNase Set by Qiagen) for 15 min at room temperature. RNA concentration was determined in a Nanodrop analyzer (Thermo Fisher Scientific NanoDrop 1000). The ratios A260/280 and A260/230 were
7 by electrophoresis in a 1 % Agarose gel with 0.005% (v/v) ethidium bromide (Mini-Sub Cell-GT and PowerPack Basic, BioRad). After migration, results were observed under UV light in a Bio-Rad Molecular Imager Gel Doc XR Imaging System.
2.8.2. cDNA Synthesis
The cDNA synthesis was performed following the protocol proposed by the NZY M-MuLV First-Strand cDNA Synthesis Kit (NZYTech) using 1 µg of RNA in a final volume of 20 µL. Incubations steps at 25 and 37 ºC for 10 and 50 min, respectively. Inactivation of the reaction by heating at 85 ºC for 5 min and cooling on ice. One microlitre of NZY RNase H (E. coli) was added and samples were incubated at 37 ºC for 20 min. Samples were then stored at -20 ºC. This was performed on a Bio-Rad MJ Mini Personal Thermal Cycler.
2.8.3. Real-time PCR analysis
The gene expression analysis was performed in a Bio-Rad MiniOpticon Real-Time PCR System with an initial 3 min heating phase at 95 ºC, 40 cycles of denaturation and annealing/extension, 10 s at 95 ºC and 30 s at 60 ºC, respectively, and a melting curve phase of 0.5 ºC increases from 55 to 95 ºC. The kit used was the iTaq Universal SYBR Green Supermix (Bio-Rad). Final volume used was 10 µL (2.5 µL of 40x fold diluted cDNA, 1 µL of primers (forward and reverse, from a primer dilution of 10 pmol µL- 1), 5 µL of enzyme Mix and 1.5 µL of DEPC-treated H
2O). The genes tested encode
enzymes of the lipid metabolism and photosynthesis in P. tricornutum previously described to have altered expression under various stresses, like N deprivation or changes in pH. Protein IDs and the respective sequences were identified according to the database present in http://genome.jgi-psf.org/Phatr2/Phatr2.home.html and sequence alignments were performed through the online program Clustal Omega. Genes tested encoded enzymes such as diacylglycerol acyl transferase (DGAT, 43469), patatin-like phospholipase domain- containing protein 3 (PNPLA3, 46570), monogalactosyldiacylgly-cerol synthase (MGDG synthase, 14125), phospholipase A2 (PLA2, 39425), PlastidΔ6FAD (50443),
ERΔ5FAD.1 (46830), ERΔ5FAD.2 (22459), carbonic anhydrase-7 (CA-7, 42574) and urease α-subunit (Ur α-subunit, 29702). The housekeeping gene used was the TBP (TATA Box binding protein, 10199). Most of the primers used in this study were previously described in the literature (Mus et al., 2013; Wang et al., 2015). The pairs of primers not found in the literature were designed, using the DNAStar Lasergene 11.0, to amplify regions of 80 to 200 nucleotides, having melting temperatures of ~60 ºC and GC contents between 50 – 60 %. Primers were synthesised by STABVIDA. Detailed information for each pair of primers used in this study is described in supplemental Table S2. Each analysis was performed in triplicate with results analysed according to the 2−ΔΔCT method and presented as fold-change (Livak and Schmittgen, 2001; Schmittgen and Livak, 2008).
2.9. Statistical analysis
Due to a lack of normality and homogeneity, the statistical analysis of the data was performed with a non-parametric test. Using the IBM SPSS Statistics 23 software to compare the effects of each treatment (temperature and Ni exposure), the Mann-Whitney test evaluated significant differences between each treatment and the control samples grown at 18 ºC without Ni exposure. Significance was assumed when p value ≤ 0.05.
8
3. Results
3.1. Growth parameters
Control cultures, grown at 18 ºC without Ni exposure, presented a specific growth rate of 0.35 ± 0.02. When exposed to the highest concentration of Ni, P. tricornutum grew 1.3 times faster (0.45 ± 0.03). The temperature shift to 26 ºC caused a decrease in the specific growth rate to 0.31 but the combined effect of both stresses did not change it (Figure 3.1A). The percentage of clamps (aggregates of more than 2 cells) did not change when Ni was introduced in the medium at regular growth temperature, however, the increase in temperature alone, significantly changed it from 17.33 % to 12.38 % (Figure 3.1B). The P. tricornutum cells fresh weight showed a tendency to decrease at 18 ºC with increasing Ni concentrations. At 26 ºC the fresh weight of the samples also significantly decreased but mostly due to the temperature shift (Figure 3.1C).
Figure 3.1 – Growth parameters of P. tricornutum grown at 18 °C (black) and exposed to a heat wave treatment (26 °C, for three days) (grey) with increasing nickel concentrations (1, 2 and 5 µg L-1). A) Specific growth rate; B) Relative abundance of clamps (aggregates of more than two cells); C) Fresh weight. Values correspond to average ± standard errors, n = 3; asterisks indicate significant differences between treatments and control cultures grown at 18 ºC without nickel (p ≤ 0.05).
3.2. Photosynthetic and respiratory rates
The photosynthesis rates measured in a Clark-type oxygen electrode showed a clear decrease in samples exposed to Ni and/or heat wave conditions being the lowest photosynthetic rate registered in samples exposed to 26 ºC and to a Ni concentration of 5 µg L-1 (Figure 3.2A). Respiration rates only showed
statistically significant differences in samples exposed to the highest concentration of Ni, for both growth temperatures (Figure 3.2B).
9 Figure 3.2 – Photosynthetic and respiratory O2 flux rates of P. tricornutum grown at 18 °C (black) and exposed to a heat
wave treatment (26 °C, for three days) (grey) with increasing nickel concentrations (1, 2 and 5 µg L-1). A) Photosynthetic rate; B) Respiration rate. Values correspond to average ± standard error, n = 3; asterisks indicate significant differences between treatments and control cultures grown at 18 °C without nickel (p ≤ 0.05).
3.3. PAM fluorometry
The PAM-derived parameters of P. tricornutum samples grown at 18 and 26 ºC with and without exposure to increasing Ni concentrations are presented in Table 3.1.
Table 3.1 – Rapid Light Curves (RLC) and JIP- derived parameters in samples of P. tricornutum grown at 18 °C and exposed to a heat wave (26 °C, for three days) with increasing nickel concentrations (1, 2 and 5 µg L-1). Values correspond to average of n = 3 samples; Bold values indicate significant differences between treatments and control cultures grown at 18 ºC without nickel exposure (p ≤ 0.05). Abbreviations in appearance order include: α (photosystem II efficiency), ETRmax
(maximum relative electron transport), β (photoinhibition parameter); AOECs (activated oxygen-evolving complexes), Area (pool of oxidized quinones), N (Number of electrons transferred into the electron transport chain), SM (energy needed to close
all reaction centres), PG (grouping probability, a direct measure of the connectivity between PSII antennae). Other meanings to
each parameter can be found in supplemental Table S1.
18 °C 26 °C 0 µg L-1 1 µg L-1 2 µg L-1 5 µg L-1 0 µg L-1 1 µg L-1 2 µg L-1 5 µg L-1 α 0.16 0.15 0.15 0.16 0.12 0.11 0.12 0.12 ETRmax 34.67 33.33 32.67 34.33 28.33 27.00 28.00 28.33 β 0.11 0.11 0.06 0.05 0.09 0.09 0.05 0.05 AOECS 0.26 0.29 0.27 0.28 0.30 0.32 0.32 0.33 Area 1.20x10⁶ 8.91x10⁵ 9.93x10⁵ 9.30x10⁵ 4.62x10⁶ 4.16x10⁶ 2.80x10⁶ 2.70x10⁶ N 1459.55 1207.81 1000.38 985.33 4272.27 3864.75 2474.97 2010.53 SM 501.19 439.67 349.46 348.36 1567.17 1434.04 917.19 760.90 PG 1.11 1.02 1.04 0.99 1.13 1.09 1.061 1.06
10 Cell exposure to increasing Ni concentrations caused similar results at 18 and 26 ºC. Overall at the highest concentration Ni tended not to change the efficiency of the PSII or ETRmax and most changes in
the phenomenological parameters were also observed at the highest concentration. Those included a small increase in activated oxygen-evolving complexes, slight but not statistically significant differences in the oxidized quinone pool (area), a decrease in the number of electrons transferred to the electron transport chain (N) and lower energy needed to close the reaction centres (SM). Significant changes in
the amount of energy absorbed per cross section (ABS/CS) or trapped energy (TRO/CS) were not
observed, however the electron transport flux from QA to QB per PSII (ETO/CS) slightly decreased
(Figure 3.3A). The effect of the temperature shift to 26 ºC caused the most severe changes in the P. tricornutum cells. Comparing cells grown at 18 ºC to cells grown at 26 ºC without exposure to Ni it is possible to observe that PSII efficiency drastically decreased (0.16 ± 0.00 vs 0.12 ± 0.00, respectively) and the ETRmax was lower. The activated OECS, area, N and SM registered higher values. In terms of
absorbed energy, entrapment, and dissipation of energy an increase was observed, however, no significant difference was found in the ETO/CS when compared to control cultures (Figure 3.3B). The
number of reaction centres increased at the highest Ni concentration in each temperature but the grouping probability (PG) tended to not change.
Figure 3.3 – Phenomenological energy fluxes in samples of P. tricornutum. A) Cultures grown at 18 ºC; B) Cultures grown
at 26 °C for three days with final nickel concentrations of 1, 2 and 5 µg L-1. Parameters include absorbed energy flux per
cross-section (ABS/CS); Trapped energy flux per cross-cross-section (TRO/CS); Electron transport energy flux per cross-section (ETO/CS);
Dissipated energy flux per cross-section (DIO/CS) and number or reaction centres per cross-section (RC/CS). Values
correspond to average of n = 3.
3.4. Pigment analysis
The changes in the concentration of the main pigments of P. tricornutum exposed to a higher temperature and increasing Ni concentrations are shown in Figure 3.4. The main pigments found in P. tricornutum were Chl a and Chl c, Fx, β-carotene, and the pigments involved in the xanthophyll cycle – Ddx and Dtx. When exposed to Ni a decrease in the concentration of the light harvesting pigments,
11 such as Chl a and the carotenoid Fx, was observed at both temperatures. However, a rise in temperature alone, increased the concentration of these pigments (Figure 3.4A-D). The de-epoxidation state (DES), the Fx / chl c and carotenoids / chlorophyll ratios did not show any statistically significant differences, however the chlorophyll a / chlorophyll c ratio was highly influenced by stress, decreasing with Ni but increasing at the highest temperature (Figure 3.4E-F).
Figure 3.4 – Pigment composition of P. tricornutum grown at 18 °C (left) and exposed to a heat wave treatment (26 °C, for three days) (right) with increasing nickel concentrations (1, 2 and 5 µg L-1). A - B) Concentration of chlorophyll a
(Chl a), chlorophyll c (Chl c) and β-carotene (β-car); C - D) Concentration of fucoxanthin (Fx), diadinoxanthin (Ddx) and diatoxanthin (Dtx); E - F) Ratio of chlorophyll a and c, ratio of fucoxanthin and chlorophyll c, de-epoxidation state (DES) and ratio between carotenoids and chlorophylls. Values correspond to average ± standard errors, n = 3; asterisks indicate significant differences between treatments and control cultures grown at 18 °C without nickel exposure (p ≤ 0.05).
12
3.5. Fatty acid and Lipid classes analysis
Preliminary results of fatty acid distribution in P. tricornutum samples exposed to each Ni concentration, during the culture days, indicated that the strongest impact occurred for the highest concentration tested (Supplemental Figure S1 and S2). Therefore, fatty acid composition and contents of P. tricornutum cells were analysed in samples grown at 18 and 26 ºC and with exposure to a final concentration of Ni of 5 µg L-1. The major fatty acids identified in P. tricornutum cells were the saturated myristic (C14:0) and
palmitic (C16:0) acids, the monounsaturated palmitoleic acid (C16:1), the di-unsaturated hexadecadienoic acid (C16:2n-4), the tri-unsaturated hexadecatrienoic acid (C16:3) and the LC-PUFA EPA. Smaller amounts of hexadecatetraenoic acid (C16:4), γ-linolenic acid (C18:3), stearidonic acid (C18:4), arachidonic acid (C20:4), as well as another hexadecadienoic acid (C16:2n-7) were also detected (Figure 3.5). The observed trend was a decrease in the percentage of EPA (~18 %) at 26 ºC with Ni exposure when compared to control conditions at 18 ºC without metal exposure (~30 %). A decrease in the abundance of the chloroplastidial PUFAs C16:4n-1 and C16:3n-4 was also observed, mainly in Ni-treated cells, whereas the opposite trend was observed for C16:2n-4. In contrast, the proportion of the saturated C16:0 increased for all stress conditions and the ɷ-6 fatty acid C20:4 increased in heat wave exposed samples (Figure 3.5A).
Figure 3.5 – Fatty acid composition of P. tricornutum samples grown at 18 °C (black) and exposed to a heat wave treatment (26 °C, for three days) (dark grey) with nickel exposure (5 µg L-1, medium and light grey). A) Relative abundance of fatty acids; B) Total fatty acids; C) Double bond index (DBI). Values correspond to average ± standard error, n = 3; asterisks indicate significant differences between treatments and control cultures grown at 18 °C without nickel exposure (p ≤ 0.05).
13 The total fatty acid content increased with both stresses (Figure 3.5B) while the DBI decreased when samples were exposed to a higher growth temperature and a final Ni concentration of 5µg L-1
(Figure 3.5C).
The identification of lipid classes and their respective fatty acid composition were assessed by TLC coupled to GC. The main lipid classes identified were the neutral lipids (NL) which include free fatty acids (FFA), diacylglycerol (DAG) and triacylglycerol (TAG), the non-ionic MGDG and DGDG and the negatively charged lipids PG and SQDG (Figure 3.6). Other lipid classes identified were PC, PE and ASQ.
Figure 3.6 – Lipid class analysis and derived parameters of P. tricornutum samples grown at 18 °C (black) and exposed to a heat wave treatment (26 °C, for three days) (dark grey) with nickel exposure (5 µg L-1, medium and light grey). A) Relative abundance of lipid classes; B) Ratio between MGDG and DGDG and ratio between the neutral and negatively charged lipid classes composing the thylakoid membrane; C) Relative abundance of glycolipids and non-glycolipids. Lipid classes identified included neutral lipids (NL), monogalactosyldiacylglycerol (MGDG), sulfoquinovosyldiacylglycerol (SQDG), acyl-SQDG (ASQ), digalactosyldiacylglycerol (DGDG), phosphatidylglycerol (PG), phosphatidylcholine (PC) and phosphatidyle-thanolamine (PE). Values correspond to average ± standard error, n = 2.
Overall the heat wave exposure decreased the percentage of neutral lipids but increased the relative amounts of MGDG, DGDG and SQDG, while metal exposure at 18 ºC induced a decrease in MGDG with no significant changes in the other plastidial lipids. The combined effects of both stresses presented, or attenuated, the profiles of each stress when applied alone (Figure 3.6A). Exposure to Ni at 18 ºC had an influence in the galactolipid MGDG / DGDG ratio and also on the ratio between the neutrally and
14 negatively charged lipids forming the thylakoid membrane (Figure 3.6B). The shift of growth temperature to 26 ºC caused a decrease in glycolipids and a consequent increase in non-glycolipids (Figure 3.6C).
The relative abundance and composition in fatty acids of the main lipid classes is shown in Figures 3.7 and 3.8. The NL fraction was composed mostly by C16:0, C16:1 and C16:3 fatty acids. The temperature shift to 26 ºC caused a decrease in C16:3 together with a slight increase in C16:2n-4, while exposure to Ni markedly increased the percentages of C16:0 and C16:1n-7, with the opposite effect on C16:3n-4 and C16:4n-1 regardless of the growth temperature (Figure 3.7). These stress-induced changes are similar to the ones obtained in the figure 3.6 since NL is the most abundant lipid class.
Figure 3.7 – Composition and relative abundance of fatty acids in neutral lipids (NL) of P. tricornutum samples grown at 18 °C (black) and exposed to a heat wave treatment (26 °C, for three days) (dark grey) with nickel exposure (5 µg L- 1, medium and light grey). Values correspond to average relative percentage ± standard error, n = 2.
The galactolipids were essentially composed of EPA and C16 fatty acids. In control conditions, MGDG presented a higher EPA content of more than 30 %. The second most abundant fatty acid was C16:3. When P. tricornutum was grown at 26 ºC and exposed to Ni, the EPA percentage decreased while the percentage of C16:3 increased. It was also observed that the content of C16:1 and C16:4 increased and decreased, respectively (Figure 3.8A). The fatty acid profile of DGDG was mostly built of C16:0, C16:1, C16:2n-4 and EPA (Figure 3.8B). Exposure to both stresses had a tendency to increase the C16:0 content. The fatty acids found in SQDG were C14:0, C16:0, C16:1 and EPA (Figure 3.8C). While EPA content only registered a small decrease in samples exposed to both stresses, the abundance of C16:0 increased, accounting for more than 35 %.
15 Figure 3.8 – Fatty acid composition of lipid classes of P. tricornutum samples grown at 18 °C (black) and 26 °C (for three days) (dark grey) with nickel exposure (5 µg L-1, medium and light grey). A) MGDG; B) DGDG; C) SQDG. Values
16
3.6. Lipid peroxidation products
The formation of lipid peroxidation products is shown in Figure 3.9. It is possible to observe that the lipid peroxidation contents decreased when P. tricornutum was exposed to increasing Ni concentrations at control temperature. However, the results obtained at 26 ºC showed that the strongest impact was caused by the temperature rise since exposing heat wave treated cells to increasing Ni concentrations did not change the MDA.
Figure 3.9 – Lipid peroxidation products of P. tricornutum samples grown at 18 °C (black) and exposed to a heat wave
treatment (26 °C, for three days) (grey) with increasing nickel concentrations (1, 2 and 5 µg L-1). Values correspond to
average ± standard error, n = 3; asterisks indicate significant differences between treatments and control cultures grown at 18 °C without nickel exposure (p ≤ 0.05).
3.7. Gene expression
The expression of genes encoding enzymes of the lipid and photosynthetic metabolism is presented as fold-change, from control values, in Figure 3.10. The expression of the two desaturases tested tended to increase in the heat wave exposed samples. The ERΔ5FAD had a tendency to be upregulated under both stresses, however, statistically significant changes were only detected in samples exposed to 26 ºC with Ni exposure. The expression of the PlastidΔ6FAD increased the most in samples exposed to the combined stresses. The TAG synthesis related genes showed different results. While DGAT tended to be downregulated PNPLA3 was slightly upregulated in samples exposed to heat wave conditions with and without Ni. The expression of PLA2 which removes fatty acids from membrane lipids did not show
statistically significant differences, but was slightly upregulated in heat wave exposed samples. The gene encoding MGDG synthase was heavily upregulated in each stress and the highest fold-change value was registered in samples grown at 26 ºC. The CO2 uptake related gene, CA-7, was downregulated
in samples exposed to Ni but upregulated with the temperature shift. The gene which encodes the urease α-subunit tended to be downregulated when cells were exposed to Ni, but was significantly upregulated when P. tricornutum was exposed to 26 ºC without Ni.