FUNDAÇÃO GETULIO VARGAS
ESCOLA BRASILEIRA DE ADMINISTRAÇÃO PÚBLICA E DE EMPRESAS DOUTORADO EM ADMINISTRAÇÃO
IMPRESSION MANAGEMENT STRATEGIES: THE
EFFECTS OF ATTRIBUTION AND
PRESENTANTION ORDER
RAFAEL DE LACERDA MOREIRA
Rio de Janeiro - 2018
TESE APRESENTADA À ESCOLA BRASILEIRA DE ADMINISTRAÇÃO PÚBLICA E DE
FUNDAÇÃO GETÚLIO VARGAS
ESCOLA BRASILEIRA DE ADMINISTRAÇÃO PÚBLICA E DE EMPRESAS
RAFAEL DE LACERDA MOREIRA
IMPRESSION MANAGEMENT STRATEGIES: THE EFFECTS OF ATTRIBUTION AND PRESENTANTION ORDER
Tese apresentada à Escola Brasileira de Administração Pública e de Empresas (EBAPE) da Fundação Getúlio Vargas (FGV) como parte dos requisitos para obtenção do grau de Doutor em Administração.
Orientador: Prof. Dr. Ricardo Lopes Cardoso
Rio de Janeiro 2018
Ficha catalográfica elaborada pela Biblioteca Mario Henrique Simonsen/FGV
Moreira, Rafael de Lacerda
Impression management strategies: the effects of attribution and presentation order / Rafael de Lacerda Moreira. - 2018.
73 f.
Tese (doutorado) - Escola Brasileira de Administração Pública e de Empresas, Centro de Formação Acadêmica e Pesquisa.
Orientador: Ricardo Lopes Cardoso. Inclui bibliografia.
1. Contabilidade gerencial. 2. Formação de impressões (Psicologia). 3. Atribuição (Psicologia social). 4. Efeito halo (Escolha de marca). 5. Percepção social. 6. Autoprojeção. I. Cardoso, Ricardo Lopes. II. Escola Brasileira de
Administração Pública e de Empresas. Centro de Formação Acadêmica e Pesquisa. III. Título.
Aos meus pais Jacimar e Lúcia, que nunca mediram esforços para guiar a mim e minhas irmãs e sempre nos apoiaram em nossas caminhadas. À minha esposa Thayná, por todo seu amor, amizade e companheirismo. Estar ao seu lado
deixa tudo mais fácil. Aos meus filhos Valentina e Arthur, que são minha fonte de alegria e razão de viver.
AGRADECIMENTOS
Aos meus filhos Valentina e Arthur, à minha esposa Thayná, aos meus pais, às minhas irmãs, aos meus sogros e cunhada. Obrigado pelo apoio incondicional.
Ao Professor Ricardo Lopes Cardoso, que é para mim um exemplo de competência e dedicação à academia. Agradeço pela confiança, pelas horas de debate sobre o trabalho e pelos quadros riscados na busca do melhor design de pesquisa. Agradeço também pelo esforço, como coordenador do programa, de estabelecer esse convênio com a UFES e ter possibilitado, a mim e aos meus colegas, essa oportunidade. Fico muito feliz em saber que além de um orientador ganhei um amigo.
Aos professores Gerlando Lima, Jeffrey Hales, Ishani Aggarwal e Alexandre Linhares por participarem de minha banca e contribuírem tão significativamente para a realização desse trabalho.
Agradeço ao amigo e professor José Elias Feres de Almeida, um dos principais responsáveis pelo sucesso do programa. Atitudes como essa mostram generosidade. Acredito que melhor que agradecê-lo é me comprometer a passar essa generosidade adiante.
Agradeço aos meus amigos de turma (o famoso G7): André Abreu, André Fernandes, Arrigoni, Mirian, Vallim e Jhonathan. Obrigado pelo apoio, parceria nos estudos e principalmente pela desconcentração e risadas.
Aos amigos da Ebape, UFRJ e UERJ, em especial: Ricardo Dias, Rodrigo Donini, Luiz Sacramento, Rodrigo Leite, Thiago Matos, Juliana Molina, Paulo Souza e Flávia Lindgren. Aos professores e direção da EBAPE/FGV-RJ. Em especial a Fernando Guilherme Tenório, Rafael Goldszmdt, Fátima Bayma de Oliveira, Patrick Gottfried Behr, Ronaldo Couto Parente, Ricardo Lopes Cardoso, Sonia Fleury, Hermano Roberto Thiry-Cherques, Deborah Moraes Zouain e Ishani Aggarwal, pelo convívio, momentos de estudos e debates.
À Celene Silva Melo, pelo carinho, apoio e profissionalismo em todos os momentos que precisávamos.
Aos amigos e professores do Departamento de Ciências Contábeis - DCC/UFES e Programa de Pós-graduação de Ciências Contábeis - PPGCON/CCJE/UFES.
Ao CFC pelo apoio indispensável na coleta de dados.
Pelo apoio da Coordenação de Aperfeiçoamento de Pessoal de nível Superior (CAPES), entidade do Governo Brasileiro voltada para a formação de recursos humanos.
“So you see, it is not we alone that create reality. Everyone does it. But as official Communicators of Reality, we [accountants] have more power than most” (Hines, 1988, 255).
ABSTRACT
Purpose - This research analyzes how corporate narrative disclosure can be manipulated by preparers of accounting information to create a favorable impression of the company through an examination of two different impression-management (IM) strategies: (i) attribution, and (ii) ordering or physical location of information.
Design/Methodology - We conducted a 4×2 mixed-design experiment to examine the impact of attribution and optimal direction of information order on earnings forecast and the impression created about the company.
Findings - Results show that the favorable report read first, without attribution, positively affects the investor, and that the favorable information read first, with attribution, undermines the positive effect. Conversely, presenting unfavorable information, with attribution, first, minimizes the impact of this information. Our findings confirm self-promoter’s paradox idea. We also tested a sandwich and an interspersed ordering (control) group; these had the worst results. In a mediation analysis, we found that perceived impression about the company mediates the relationship between information and decision-making. In addition, our results show a significant difference in decision-making influenced by users’ characteristics. In a robustness test, we tested credibility of information as an alternative explanation, finding that credibility was not an alternative explanation for investors’ decision found in the experiment. We conclude by offering suggestions for further study of IM.
Originality – To our knowledge, this is the first study that analyses the effects of both attribution and ordering strategies at the same time. Literature has addressed both strategies separately but has not discussed their interactive effect. This research addresses this gap.
Keywords: impression management, attribution, presentation order, ordering information, halo effect, credibility, users’ characteristics, self-promoters’ paradox.
LIST OF FIGURES
Figure 1. Prospect Theory Graph (Kahneman and Tversy [1979]) ... 16
Figure 2. Managerial impression-management strategies in corporate narrative documents .. 20
Figure 3. Interaction effect hypotheses for Favorable First and Unfavorable First groups ... 32
Figure 4. Predictive validity model as applied to the hypotheses ... 40
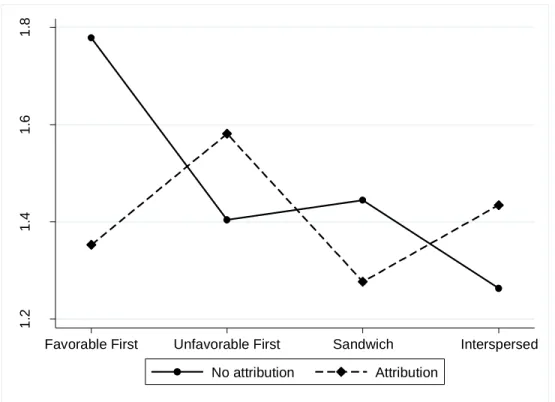
Figure 5. Simple main effects (Conditions compared) ... 48
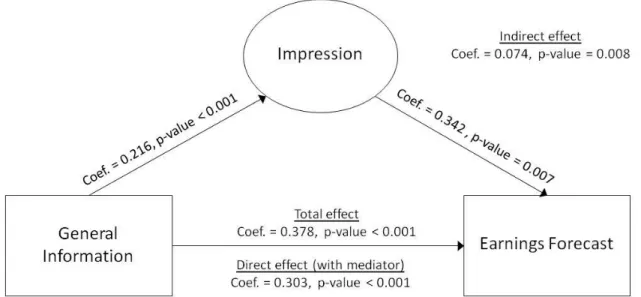
Figure 6. Mediation analysis with perceived impression as the mediator ... 52
LIST OF TABLES
Table 1. Sample selection ... 38
Table 2. Perceptions of (un)favorability of each piece of information in the third pilot test ... 42
Table 3. Perceptions of (un)favorability of each piece of information received. ... 45
Table 4. Hypotheses test: Earnings forecasts (R$/Share) ... 46
Table 5. Characteristics analysis... 50
Table 6. Descriptive statistics and correlation matrix of participant characteristics ... 56
Table 7. Credibility of information ... 59
CONTENTS
1. INTRODUCTION ... 10
2. BACKGROUND AND HYPOTHESES... 15
2.1. Favorable or unfavorable accounting information ... 15
2.2. Impression Management ... 17
2.2.1. Attribution of performance ... 22
2.2.2. Visual and structural manipulation: Presentation Order (PO) ... 25
2.3. User characteristics ... 33
2.3.1 Cognitive Reflection Test ... 34
2.3.2 Ten Item Personality Measure ... 35
2.3.3 Optimism (LOT-R) ... 36
2.3.4. Object-Spatial Imagery and Verbal Questionnaire ... 36
3. EXPERIMENT ... 37
3.1 Design and sample... 37
3.2 Tasks ... 39 3.3 Definition of variables ... 41 3.4 CRT Score ... 44 3.5 Results ... 44 3.5.1 Mediation analysis ... 51 3.5.2 Users’ characteristics ... 53 4. ROBUSTNESS ANALYSIS ... 57
4.1 Design and sample... 57
4.2 Results ... 58
5. DISCUSSION AND CONCLUDING REMARKS... 60
Appendix — Pieces of information from MD&A ... 64
10
1. INTRODUCTION
This research analyzes how corporate narrative disclosure can be manipulated by preparers of accounting information to create a favorable impression of the company. We examine two different impression-management (IM) strategies: (i) attribution and (ii) ordering, or physical location of information. Literature has addressed both strategies separately, and presented consolidated results; however, we did not find any research that has investigated the interaction between these two strategies via an experimental approach.
We address this gap by considering that the effect of one strategy can be either increased or decreased by the effect of the other. Additionally, analyzing these effects together enhances the research’s external validity because the information disclosed in the
market is broad and these IM strategies can be easily used together. Accounting can combine, define, add, and subtract data from the image created of a company. It follows that “a single number creates the appearance of certainty when it does not exist” (Beaver [1991, 126]).
IM is a branch of social psychology that studies how individuals present themselves to others so as to be perceived favorably by them (Hooghiemstra [2000, 2010]). Accounting researchers have treated IM as a mechanism used by managers to manipulate impressions that investors have about their companies. Three aspects are motivators for preparers engaging in IM strategies. First, favorable and unfavorable information has different weights in the decision-making process, and people are more sensitive to unfavorable than to favorable information (Kahneman and Tversky [1979]). Second, as a consequence of loss aversion people are driven by avoidance of losses more strongly than they are driven towards gains (Heath, Larrick, and Wu [1999]; Heath, Huddart, and Lang [1999]; Meng and Weng [2017]). Third, accountants deal with uncertainty daily (Bonner [2008]; Belkaoui [1989]). Consequently, the combination of preparer’s motivation and investors’ loss aversion makes utilization of IM strategies useful; these have been used to mitigate the unfavorable
11
information effect (Aerts [2005], Bolino, Kacmar, Turnley, and Gilstrap [2008], Merkl-Davies and Brennan [2007], Merkl‐Merkl-Davies, Brennan, and McLeay [2011]; Aerts and Yan
[2017]; Diouf and Boiral [2017]).
Attribution is a “self-serving bias involving individuals perceptions and explanations
of events that manifest itself in a tendency to claim more responsibility for successes than for failures” (Merkl-Davies and Brennan [2007, 12]). Attributing positive outcomes to internal
reasons and negative outcomes to external reasons fits traditional IM procedures. However, depending on how information is presented, attribution strategies could have different consequences on information users—e.g., exaggerating companies’ achievements tends to undermine the effectiveness of self-promotion because positive outcomes already offer a positive signal of managerial capability and skeptical investors can discount this impression when making decisions (self-promoters’ paradox). Conversely, blame-avoiding attribution strategies seem to mitigate bad news because investors believe in an optimistic disclosure rather than a realistic one when a company performs badly (Emett [2013])
Can the order in which financial information is disclosed change an investor’s
decision? Baird, and Zelin (2000) investigated how information from presidents’ letters influences subjects, finding that order matters: disclosing positive information at the beginning of financial reports generates better responses from investors. Asch [1946] considered the primacy effect as resulting from the halo effect, wherein the first impression is more impactful than the last. Thus, delivering favorable before unfavorable financial information is the optimal direction.
There is no prior evidence regarding how investors behave facing attribution in a different ordering of information. We hypothesize on this interaction by considering four logical assumptions of IM theory: (i) disclosure order matters and information disclosed at the beginning is more impactful than that disclosed later; (ii) self-promotion behavior can
12
undermine company image when positive information is disclosed (self-promoters’ paradox); (iii) literature has shown that attribution can minimize the negative impact of unfavorable information; and (iv) investors prefer optimistic disclosure when companies perform badly, and realistic disclosure otherwise. Therefore, we hypothesize that favorable information read first, without attribution, will affect investors positively and that favorable information read first, with attribution, can undermine the positive effect. Conversely, unfavorable information read first, with attribution, has minimal impacts.
Our study attempts to provide more relevant evidence for accounting and finance settings compared to previous studies; hence, we used a sample composed of professional accountants who use to invest on the capital market. We also investigate whether intrinsic characteristics of the individual alter the interpretation of different ways of disclosing information. We focus on cognitive processes, personality traits, biases, and cognitive styles.
Based on a 4×2 mixed design, the experiment provides empirical evidence from 583 professional accountants, who are real investors in the capital market, that different ways of disclosing the same information can change judgment and decision-making. Although main effects did not influence earnings forecasts (EFs), the interaction showed some significant results. The interaction between Attribution and Presentation Order (PO) differently affected both EF and perceived impression about the company.
Results confirm our hypothesis that favorable information presented at the beginning of the report enhances the positive impact of that information when presented without attribution. When favorable is presented before unfavorable information, attribution undermines the positive effect. This investors' behavior originates from the idea of the self-promoter paradox, which determines that positive outcome already offers a positive signal about managers' ability and that self-promotion behavior ends up reducing the good news effect. We also tested a sandwich and an interspersed ordering (control) group, finding that
13
these had the worst results. Finally, we found that perceived impression, which was measured by a set of characteristics about the company in a Confirmatory Factor Analysis (CFA), mediates the relationship between information and decision-making.
A robustness test investigated credibility as a possible alternative explanation. Results show that there is no difference in credibility between the No Attribution and Attribution groups, and that credibility was not an alternative explanation for investors’ decision in
experiment one. The results provide considerable evidence for the impact of IM strategies on investors’ decision-making.
Our results also show a significant difference in decision-making influenced by users’ characteristics. EFs of reflexive people were lower than those of impulsive people. It may have happened because reflexive people can have scrutinized better all pieces of information from MD&A and financial reports. In fact, the company's most recent financial statements showed a slight financial deterioration compared to previous statements, then reflexive people can have perceived it better. The extraversion trait and the object imagery cognitive style also were relevant, and their effects were similar for impulsive people, who made higher EFs. This research contributes to both accounting and psychology literature through findings on the presentation of financial reporting and the influence of investor biases on information acquisition and evaluation of accounting information.
Our results indicate certain disclosure strategies used by preparers to minimize unfavorable information. Although auditors do not audit Management’s Discussion and
Analysis (MD&A), they are required to read this section and report material misstatements in the financial report, so that regulators can monitor how information is disclosed (IAASB [2015]). Investors may consider the research results as self-critical concerning their decisions. As a result, they can create mechanisms to monitor themselves against biases that can lead them to make unwise decisions.
14
The next section presents the literature review and hypotheses development. Section 3 describes the experiment design, data collection process, and methods to test hypotheses. Section 4 presents and discusses the hypothesis results. Section 5 presents final remarks and suggestions for further research.
15
2. BACKGROUND AND HYPOTHESES
2.1. Favorable or unfavorable accounting information
Psychological and organizational behavior research has shown that people respond differentially to positive versus negative stimuli, where negative events tend to generate stronger behavioral responses than positive events (Barsade [2002], Cacioppo, Gardner, and Berntson [1997], Rozin and Royzman [2001], Hsu, Wiklund and Cotton [2017], Meng and Weng [2017]). A negative event is defined as one that has the potential or actual ability to create adverse outcomes for the individual, regardless of whether the event has occurred (Taylor [1991]).
Kahneman and Tversky [1979] described several classes of choice problems in which preferences systemically violate the axioms of expected utility theory, and proposed an alternative account of choice under risk that they called the “reflect effect” (wherein, e.g., a loss of $900 has a subjective value greater than 90% chances to lose $1,000). The sure loss is very aversive, and this drives us to take the risk. In general, people favor risk when all other options are worse.
The main element of prospect theory is an S-shaped value function (see Figure 1) (Grinblatt and Han [2005]). The graph shows the psychological value of gains and losses, where the S-curve is not symmetrical. The slope of the function changes abruptly at the neutral reference point, where the reaction to losses is stronger than that to corresponding gains. In other words, this abrupt change corresponds to the loss aversion.
Loss aversion can be said to have two motivations. First, we are driven by avoidance of losses more strongly than we are driven towards gains. Second, a future target can also drive us. Thus, not reaching a target is a loss, while doing so is a gain. Considering loss aversion, not reaching a target is much more powerful than expectations to overcome it (Heath, Larrick, and Wu [1999]). An example of this is what researchers have called
16
“disposition effect,” wherein investors tend to hold on to losing stocks too long and sell gains
too soon (Beattie and Jones [2000], Chang, Solomon, and Westerfield [2016], Grinblatt and Han [2005], Li and Yang [2013], Shefrin and Statman [1985], Ploner [2017], Fischbacher, Hoffmann, and Schudy [2017]). This is because when a stock is traded at a gain, the investor is in a risk-averse domain and is inclined to sell the stock; if a stock is traded at a loss, the investor is in a risk-seeking domain and tends to hold on to the stock (Li and Yang [2013]).
Figure 1. Prospect Theory Graph (Kahneman and Tversy [1979])
Psychological literature on motivated reasoning has shown that directional preferences influence not only the decisions people make but also how information is processed. Individuals often accept information that is consistent with their preferences, tending to accept information without thinking about it deeply, while they spend more cognitive effort scrutinizing information that is inconsistent with their preferences (Ditto and Lopez [1992], Hales, Kuang, and Venkataraman [2011]).
Kahneman [2011] claimed that there are blind spots in prospect theory. First, in prospect theory human beings are guided by short-term time perspective impacts of emotion, rather than by long-term time perspectives. Second, prospect theory does not deal with emotions such as disappointment and regret. Thus, decision-makers anticipate future regret
17
when they make choices, and this anticipation causes them to think more elaborately before making decisions (Janis and Mann [1977], Tzini and Jain [2018]).
2.2. Impression Management
IM (also called self-presentation) has long been studied in the psychological field (Felson [1978], Gergen [1965], Quattrone and Jones [1978]). According to Leary and Kowalski [1990], people regularly monitor their impact on others and try to gauge others’ impressions of them to ensure their public persona is intact. Additionally, under certain circumstances, people become motivated to control how others see them; such motivation is key within IM.
Scholars have studied IM in organizations in at least three key areas: (i) at the individual level of analysis; (ii) in relation to management theory, concepts, and thinking to better understand organizational phenomena; and (iii) at the organizational level (Bolino, Kacmar, Turnley, and Gilstrap [2008]).
Our focus is on the organizational level. Most researchers define IM in organizations as behaviors actors use to shape how others see them, trying to create a new, desired image or maintain and protect a current image (Bolino, Long, and Turnley [2016], Bozeman and Kacmar [1997]).
Accounting researchers have treated IM as a mechanism used by managers to manipulate impressions stakeholders have about their companies. According to Jones [2010], IM involves managers influencing financial reporting in their favor. It does not imply fraud, and is normally associated with presentational aspects of reporting, such as narratives, graphs, and photographs.
Accounting narratives are an increasingly important medium of financial communication, playing a crucial role in the corporate annual report because they allow management to present annual performance information to users in an accessible manner
18
(Clatworthy and Jones [2003]). Policymakers have long highlighted the importance of narrative disclosures in helping investors understand a company’s financial performance and
risks, since numerical presentation and brief accompanying notes alone may be insufficient for investors to judge earnings quality (Leung, Parker, and Courtis [2015]).
Accounting narratives literature has assumed that discretionary disclosures are used either for useful incremental information or IM. On this subject, Merkl-Davies and Brennan (2007) addressed the difference between incremental information and IM. The former contributes to useful decision-making by overcoming information asymmetries between managers and firm outsiders, while the latter constitutes opportunistic behavior whereby managers exploit information asymmetries between them and firm outsiders. In financial reporting, IM is viewed as attempts to manipulate the impression conveyed to users of accounting information (Clatworthy and Jones [2001]).
Narrative disclosures have become longer1 and more sophisticated over recent years and have increased opportunities for IM in the financial report (Merkl-Davies and Brennan [2007]). Further, IM is more easily implemented in corporate narratives because they are largely unregulated.
We focus our research on MD&A, which, because it is not audited, allows preparers to use different tones, scales on graphs, and approaches to present good or bad news freely. In other words, the MD&A can be used by managers to present news selectively, skewing the accounting narratives or using graphs to promote favorable and downplay unfavorable results. Note, however, that financial statements and notes, although audited, are not necessarily free from IM.
Jones [2010] explained that accounting narratives, graphs, and photographs can be used in IM. Several researchers have concentrated on graph distortion analysis (Beattie and
1 “Narratives sections of the annual report provide almost twice the amount of quoted information as do the
19
Jones [1992, 1999, 2000], Cardoso, Leite, and Aquino [2016], Cho, Michelon, and Patten [2012], Godfrey, Mather, and Ramsay [2003], Tang, Hess, Valacich, and Sweeney [2014]) or photographs (Bernardi, Bean, and Weippert [2002], McKinstry [1996]). In addition, Jones [2010] classified IM of narratives into four types: (i) stress the positive (good news) and downplay the negative (bad news); (ii) baffle readers by conveying good news in a more easy-to-read way than bad news; (iii) report strategies differently; and (iv) attribute good news to the company, but bad news to the environment.
Merkl-Davies and Brennan [2007] identified seven different strategies of IM that preparers of accounting information are presumed to engage in (see Figure 2). Managerial self-serving motives can be classified into concealment and attribution. Concealment can be achieved in two ways: by either (1a in Figure 2) obfuscating negative outcomes (“bad news”) or (1b in Figure 2) emphasizing positive organizational outcomes (“good news”). Attribution
can be understood as a defensive framing tactic that shifts blame for negative outcomes away from managers by attributing such outcomes to the external environment.
Six strategies are related to concealment. Two of these obfuscate unfavorable results by manipulating verbal information by either (i) reading-ease manipulation (i.e., making the text more difficult to read) or (ii) rhetorical manipulation (i.e., using persuasive language). The other four strategies emphasize favorable information through (iii) thematic manipulation (i.e., emphasizing positive words or positive financial performance); (iv) visual and structural manipulation (i.e., using visual emphasis or ordering information); (v) performance comparison (i.e., choosing benchmarks that portray good current performance); or (vi) choosing the earnings number (i.e. choosing only the best indexes to favorably portray performance). An additional (seventh) strategy is the attribution (Borges [2011], Merkl-Davies and Brennan [2007]).
20 Figure 2. Managerial impression-management strategies in corporate narrative documents
21
IM strategies have been extensively studied in recent years. Deegan and Gordon [1996] found that Australian companies used, on average, six times more positive words than negative ones, while Nelson and Rupar [2015] evidenced that investors’ risk judgments are affected by the numerical format used to describe outcomes within accounting disclosures—i.e., investors assess higher risk in response to dollar-formatted disclosures compared to equivalent percentage-formatted disclosures.
Hales, Wang, and Williamson [2015] investigated the effect of vivid (pallid) language on investor judgments, finding that vivid language significantly influences the judgment of investors who hold contrarian positions (short- or long-term investors). Huang, Teoh, and Zhang [2014] investigated whether and when firms manage the tone of words in earnings press releases, and how investors react to tone management; overall, the evidence is consistent with managers using strategic tone management to mislead investors about the firm’s outcomes. Talbot and Boiral [2018] analyzed the quality of climate information
disclosed by companies and the impression management strategies they have developed to justify or conceal negative aspects of their performance; they identified four impression management strategies being applied by companies.
Hayward and Fitza [2016] examined earnings guidance precision as a mechanism of organizational IM. This mechanism can be used to convey a greater sense of authority and control over organizational performance following material organizational setbacks. According to Hayward and Fitza [2016], investors generally respond favorably to this tactic. Additionally, Tan, Ying Wang, and Zhou [2014] examined how the effect of language sentiment differs with readability and investor sophistication level. Their findings show that language sentiment influences investors’ judgments when readability is low, but not when readability is high.
22
In this study, we examine the relationship between IM in the MD&A and investors’
decision-making. Specifically, we examine only two IM strategies from an information-user perspective: (i) attribution of performance and (ii) visual and structural manipulation. We explore these two strategies more deeply below.
2.2.1. Attribution of performance
The main assumption of attribution is that actions are informative to the extent that they have emerged from a context of choice and reflect the selection of one among a set of alternatives (Jones and Davis [1965]). Consequently, the effect of the selected alternative determines the likelihood that information about the actor is extracted from his/her action.
From a preparer perspective, Aerts [1994] explored the relative use of performance explanations regarding the internal logic of the financial accounting model in annual report narratives. The sample comprised narrative parts of the Report of the Board Directors of 50 Belgian companies. Aerts’ results show that accounting narratives are biased, with success
being claimed but negative factors being blamed on uncontrollable external factors.
Clatworthy and Jones [2003, 2006] investigated differences in reporting between good and bad news, finding that companies with improving performance concentrate on good news rather than bad, while unprofitable companies do not discuss the nature of, or reasons for, their poor performance. Furthermore, the authors found that unprofitable companies tend to overlook strategic financial performance indicators in discretionary reports and instead direct readers’ attention to future planning.
The effectiveness of IM depends on which explanations are plausible (Aerts [2005], Barton and Mercer [2005]). In this sense, self-serving attribution bias is not just a generic
23
phenomenon decoupled from the topical content of attributional statements and organizational environment (Aerts [2005]).
Attributing positive outcomes to internal reasons and negative outcomes to external one fits with traditional procedures of IM. However, explanations used as attribution strategies to minimize negative outcomes can be identified as excuses, causality denials, and justifications (Aerts [2005], Scott and Lyman [1968]). Conversely, both attributing entitlements and attributional enhancements are classifications for positive attribution strategies (Aerts [2005]).
Attributional excuses deny responsibility for adverse events by pointing to external determining factors. Internal causality denials dissociate the actor from performance outcomes to reduce responsibility for negative outcomes. Justification entails one accepting responsibility for a negative outcome but reducing its negative repercussions by positing it as a necessary step to achieve other goals. Attributing entitlements occurs when companies claim responsibility for positive outcomes, and attributional enhancements is the idea of portraying positive outcomes within the context of negative external influences (Aerts [2005]).
The consequences of valence of attribution strategies for information users vary. Positive outcomes offer a powerful signal of managerial capability and do not necessarily require further explanation to be consistent with desired organizational image (Aerts [2005]). Self-promotion behavior that exaggerates companies’ achievements tends to undermine the effectiveness of self-promotion, which scholars call the self-promoters’ paradox (Abrahamson and Amir [1996], Berman, Levine, Barasch, and Small [2015], Jones and Pittman [1982], Juusola and Rensimer [2018]).
24
The self-promoters’ paradox “occurs because people who are truly competent need not explicitly promote themselves as being competent” (Holoien and Fiske [2013, 41]. Then, “the conspicuous promotion of good deeds is likely to backfire and evoke skepticism” (Pomering and Johnson [2009, 427])
Companies have incentives to engage in blame-avoiding attributional behavior to mitigate the impact of bad news on the company’s image. However, when analysts do not
believe in the narrative report’s explanations, they draw negative conclusions about the firm’s prospects, resulting in more pessimistic EFs than if the explanation had not been
provided (Barton and Mercer [2005]). “This suggests that only verifiable statements that are perceived to be inconsistent with managers’ personal incentives are credible”
(Merkl-Davies and Brennan [2007, 48]). Additionally, Emett [2013] stated that when a firm performs badly, investors will believe an optimist disclosure rather than a realistic one. Conversely, investors will prefer a realistic disclosure when the firm performs well.
Aerts [2005] argued that the nature of attributed content also needs to be considered on the exhibited attributional tendencies. He categorized the explained accounting outcomes into cost effects, revenue effects, and earnings effects. He suggested that attributional effects could be impacted by the reference characteristics of the accounting outcomes to be explained.
Finally, we highlight other results about attribution strategies regarding IM. Attribution strategies are associated with stock price improvements (Staw, McKechnie, and Puffer [1983]). Attribution strategies for negative events have been found to cause higher stock prices one year later (Lee, Peterson, and Tiedens [2004]). Managers may engage in IM, using persuasive language in pre-equity-offering communications, to drive up stock price in advance of planned equity offerings (Hemmings, Brennan, and Merkl-Davies
25
[2017]). Attribution is used to enhance forecast precision or credibility (Baginski, Hassell, and Hillison [2000]). Attributions are associated with greater absolute price reactions to management forecasts, more negative price reactions to management forecasts (forecast news held constant), and greater price reactions per dollar of unexpected earnings (Baginski, Hassell, and Kimbrough [2004]).
Here, we analyze how investors react to preparers’ IM by addressing both
attribution strategies: attributing favorable information to the company and attributing unfavorable information to the environment. Our first hypotheses are:
H1a: Attribution minimizes the impact of unfavorable information, such that investors make higher EFs.
H1b: Investors receiving information with attribution will assign more positive characteristics to the company in their impression-forming process compared to groups receiving information without attribution.
2.2.2. Visual and structural manipulation: Presentation Order (PO)
Perceptions of firm performance can be manipulated by the way in which information is presented. In this sense, Merkl-Davies and Brennan [2007] identified four types of emphasis: (i) repetition, (ii) reinforcement, (iii) visual emphasis, and (iv) ordering of information. We address only ordering of information.
Some researchers have suggested that order matters because it can determinate receptors’ behavioral responses to information (Asch [1946], Kahneman [2011], Legg and
26
readers’ attention towards or away from specific items (Baird and Zelin [2000],
Merkl-Davies and Brennan [2007]).
Baird and Zelin [2000] investigated how subjects are influenced by information from presidents’ letters. Using an MBA-student sample as a proxy for nonprofessional
investors, their results show that investors are more influenced by information read first in narrative disclosure (i.e., the “primacy effect” (Hogarth and Einhorn [1992])). Baird and Zelin’s [2000] experiment was based on the belief-adjustment model (Hogarth and Einhorn
[1992]), which explicitly accounts for order-effect phenomena as arising from the interaction between information-processing strategies and task characteristic, an anchoring-adjustment model.
We focus on one strategy of IM by using the PO to disclose information. In this paper, we considered information primacy effect influences investors. The reason for that originates from two types of effect. First, people can tire if requested to process many pieces of information. Second, as information accumulates, beliefs are likely to become less sensitive to the impact of new information because this embodies an increasingly small proportion of the evidence already processed (Hogarth and Einhorn [1992]).
Hogarth and Einhorn [1992] attributed the primacy effect to anchorage; however, the issue is similar to Asch’s [1946] “change of meaning” hypothesis, which accounts for
primacy effects in impression formation. Asch [1946] argued that the halo effect is pivotal for early information to significantly impact impression formation.
The primary explanation for the primacy effect in our research involves the directional halo effect, wherein the first impression has more impact than the last (Asch [1946], Kahneman [2011]). According to the old proverb, “You never get a second chance to make a good first impression;” keeping this in mind, when we like someone we often
27
assume that the person’s attributes, which we know little of, are also favorable. The “halo
effect [so-named by Thorndike [1920]] is defined as the influence of a global evaluation on evaluations of individual attributes of a person, but this definition is imprecise concerning the strength and character of the influence” (Nisbett and Wilson [1977, 250]).
Asch [1946, 258] described the halo effect using the following example:
We look at a person and immediately a certain impression of his character forms itself in us. A glance, a few spoken words are sufficient to tell us a story about a highly complex matter. We know that such impressions form with remarkable rapidity and with great ease. Subsequent observation may enrich or upset our first view, but we can no more prevent its rapid growth than we can avoid perceiving a given visual object or hearing a melody.
This effect is one of the oldest and most widely recognized psychological phenomena, but little is known about its nature (Thorndike [1920]). Asch [1946] was among the first to study how we form an impression of someone’s character when we see the person for the first time. The author analyzed impression formation via several experiments using the halo effect concept.
In one of his experiments, Asch [1946] analyzed whether the direction in which characteristics are presented can change impressions. He questioned whether it is possible to change an impression without changing a particular characteristic. The author presented characteristics of an individual to two different groups of subjects. The series of characteristics were identical, differing only in the order of succession. Series A opened with positive qualities and ended with questionable ones (e.g., intelligent, industrious, impulsive, critical, stubborn, envious). This order was reversed in Series B. After presenting the characteristics, the author instructed the groups to comment on the individual the characteristics were said to describe.
28
The results showed that subjects of Series A saw the individual much more favorably than did those of Series B. Traits placed at the beginning of the sentence thus changed the meaning of traits placed at the end. Furthermore, the halo effect serves to illuminate ambiguity—e.g., since the adjective “stubborn” (headstrong/determined) is ambiguous, it will be interpreted according to context.
The sequence of presentation matters because the halo effect increases the weight of first impressions to the point that subsequent information is largely wasted (Nisbett and Wilson [1977]) found that global evaluations of a person can induce altered evaluations of their attributes, even when there is sufficient information to allow for independent assessments of them. Other findings from studies using the halo effect are outlined below.
Sine, Shane, and Di Gregorio [2003] studied halo effect in technology licensing. Their findings showed that institutional prestige increases a university’s licensing rate over and above that explained by the university’s past licensing performance. Chernev and Blair
[2015] demonstrated that a firm’s pro-social activities can significantly impact not only consumers’ goodwill toward the firm’s brand, but also their beliefs about the firm’s
products. O’Donnell and Schultz [2005] suggested that the halo effect generated during strategic assessment influences judgment by altering auditor tolerance for inconsistent fluctuations. We suggest that the halo effect can be used by preparers of financial reports to convey a better image to information users.
Moreover, the halo effect is often seen as the first impression an individual has over the other, which shapes the impression about other characteristics. It could be argued that there is a limitation in our initial analysis: when considering, e.g., investors in an active market, it must be taken into account that when companies are already known, the first impression is not formed by the current accounting information. However, there are
29
arguments from marketing research that validate our analysis, finding that the halo effect exists about new products even when the company is well known on the market (Chernev and Blair [2015], Coombs and Holladay [2006]). Thus, we believe that investors also have impressions of the current situation of the company, regardless of whether it is already known. That is, the halo effect also impacts current financial information disclosure.
Though the halo effect is a quite broad concept, we conceive it as the phenomena of presenting favorable (unfavorable) characteristics before unfavorable (favorable) ones in order to affect the impression receivers form about the subject being described; i.e., based on the directional factor. It is reasonable to consider the halo effect as an explanation for IM because attention is directed towards the first set of information presented and away from last set of information.
A further concern is how to distinguish the halo effect from other judgment heuristics, such as the availability or representativeness heuristic. Judgment heuristics are processes that help us find answers by simplifying the question — e.g., by replacing a difficult question with an easy one. Heuristics, in general, are quite useful in decision-making, though they sometimes lead to errors (Kahneman [2011], Tversky and Kahneman [1974]).
The availability heuristic is the tendency to assess the probability that a certain type of event will occur based on how easily examples of the event can be brought to mind; e.g., when an event has extensive media coverage people believe that the chances of it happening again are higher (Tversky and Kahneman [1974]). Therefore, although we use real information from an existing company in our experiment, we were careful not to use information that would identify the company to the subjects. In addition, all information provided to the groups revealed the same events about the company.
30
The representativeness heuristic pertains to estimating the likelihood of an event’s
occurrence based on the information representativeness available, and tailoring the estimate to a preconceived stereotype (Tversky and Kahneman [1974]). Despite being similar to the halo effect, we believe they differ from each other and can thus help to build a broad picture based on fragments of evidence. Additionally, we tested only the directional factor of the halo effect in our research, since different groups of participants received the same information in different orders. According to Kahneman [2011], the initial traits in the list change the meaning of the traits that appear later.
The halo effect depends on the context in which features are presented; e.g., always placing good news at the beginning and bad news at the end. Thus, we investigate how investors perceive information disclosed by preparers:
H2a: Investors receiving all favorable information about the company first will make higher earnings forecasts compared to investors that received unfavorable information first.
H2b: Investors receiving all favorable information first will assign more characteristics that are positive to the company in their impression-forming process compared to investors that received unfavorable information first.
Literature has addressed both attribution strategies and information ordering, but there is a gap regarding the interaction between these two strategies of IM in narrative accounting disclosure. There is no prior evidence regarding how investors behave facing attribution with different ordering of information.
31
From the above discussion, we can draw the following conclusions. First, the halo effect makes information presented first more impactful than that shown last. Second, prior literature has shown that positive outcomes offer a powerful signal of management competence and self-promotion behavior can undermine company image (self-promotors’ paradox). Third, literature has shown that attribution can minimize the negative impact of unfavorable information. Finally, investors prefer optimistic disclosure when companies perform badly and realistic disclosure otherwise (Emett [2013]). Therefore, we hypothesize that favorable information read first, without attribution, will affect investors positively and favorable information read first, with attribution, can undermine this positive effect. Conversely, unfavorable information read first, with attribution, has minimal impact. Thus:
H3a: The interaction between Attribution and OD will be significant.
H3b: The effect of OD will be significant for the No Attribution group, but not for the Attribution group.
H3c: For groups that receive favorable information first, EFs will be higher when investors receive information without attribution.
H3d: For groups that receive unfavorable information first, EFs will be higher when investors receive information with attribution.
H3e: Although attribution mitigates unfavorable first negative effects, earnings forecasts from the group in which favorable information without attribution is presented first will be higher than those from the group in which unfavorable information with attribution is presented first.
32 Figure 3. Interaction effect hypotheses for Favorable First and Unfavorable First groups
Our hypotheses are grounded in the primacy effect and the halo effect. Then, we used them as an assumption for doing this research. However, there are at least two concurrent explanations regarding the optimal order in which to disclose information.
First, some authors argue that people prefer to receive unfavorable before favorable information because they tend to prefer improving sequences of events (Legg and Sweeny [2014], Ross and Simonson [1991]). Second, numerous websites and management handbooks recommend using a “sandwich” strategy to give feedback by delivering news in
a good–bad–good pattern (see Dohrenwend [2002], Legg and Sweeny [2014]). Starting with favorable information suggests that the company is on the right track and helps to prepare the ground for delivering unfavorable information; unfavorable information is then presented as constructive criticism; and finally favorable information is used as a motivator and to reinforce that the company is on the right track (Von Bergen, Bressler, and Campbell [2014]). Few scientific studies have explored the issue, and there are few empirical studies to support that the use of sandwich sequence is effective (Slowiak and Lakowske [2017]).
33
We do not hypothesize regarding these, but do consider these two concurrent explanations in our experimental design.
Finally, preparers seek to convey to investors an image of a company that has positive characteristics, such as solidity, strength, commitment, etc. Thus, the image created is the link between the preparer’s action and the investor’s response and plays a mediating role between them. Therefore:
H4: The relationship between the perception of how (un)favorable the disclosed information is and the earnings forecast made by the investor is mediated by the company characteristics (impression) recognized by the investor.
2.3. User characteristics
Are the effects of IM techniques impacted by the abilities, biases, cognitive styles, and personality of individuals? Merkl-Davies and Brennan [2007] suggested that scholars should address the role of user characteristics in susceptibility to IM to improve understanding of how users’ impressions are formed, including users’ cognitive style, personality, tolerance for ambiguity, etc. In this context, previous research has suggested that unsophisticated investors are more susceptible to IM than sophisticated investors are (Elliott [2006], Frederickson and Miller [2004]).
To measure participants’ characteristics, we applied four tests via a questionnaire:
(i) the performance-based Cognitive Reflection Test (CRT), a four-item task with simple reasoning problems, to measure cognitive reflection ability (reflectivity and impulsivity); (ii) the Ten Item Personality Measure (TIPI), a reduced scale to measure the Big-Five dimensions; (iii) the Object-Spatial Imagery and Verbal Questionnaire (OSIVQ), a scale to
34
measure participants’ cognitive style; and, (iv) the Revised Life Orientation Test (LOT-R),
which evaluates dispositional optimism as a steady characteristic.
2.3.1 Cognitive Reflection Test
Literature has suggested that people use two types of cognitive processes: Type 1 and Type 2 (Evans and Stanovich [2013], Kahneman [2011], Shafir and LeBoeuf [2002], Stanovich and West [2000]). Type 1 is related to an impulsive way of thinking and Type 2 is a reflective style of decision-making. “Cognitive impulsiveness may lead people to make mistakes on simple reasoning tasks” (Jelihovschi, Cardoso, and Linhares [2018, 1]), such
that even students from the best universities make mistakes on simple reasoning questions (Frederick [2005]).
Frederick [2005] proposed a three simple questions in the original Cognitive Reflection Test (CRT), which has been applied in many studies in psychology, economics, and other social fields to predict impulsiveness on decision making (Cokely and Kelley [2009], Toplak, West, and Stanovich [2011], West, Meserve, and Stanovich [2012]). The CRT is designed to raise in respondents’ minds an impulsive, fast, and effortless first
answer to each question, which is usually wrong. Thus, we can assign as reflexive people who overcome such wrong tempting first answers and engage in logical and deliberate reasoning (Barcellos, Cardoso, and Aquino [2016]).
However, Frederick’s questions have been exposed to many subjects and may be
becoming known to participants, which might add noise to data. Thus, new questions to measure reflection and impulsiveness have emerged from other studies (e.g., Thomson and Oppenheimer [2016], Toplak, West, and Stanovich [2014]). We used four simple questions
35
to measure CRT: one from Thomson and Oppenheimer [2016] and three from Toplak, West, and Stanovich [2014].
2.3.2 Ten Item Personality Measure
The Big-Five framework is a hierarchical model of personality traits with five broad factors (openness to experience, conscientiousness, extraversion, agreeableness, and neuroticism – also called emotional stability), which represent personality at the broadest level of abstraction (Donnelly, Iyer, and Howell [2012], Goldberg [1992], Gosling, Rentfrow, and Swann [2003]). The Big-Five framework suggests that most individual differences in human personality can be classified into five broad, empirically derived domains.
Several rating instruments have been developed to measure the Big-Five dimensions. Among them, we quote Costa and McCrae's [1992] 240-item NEO Personality Inventory, Revised (NEO-PI-R); the 44-item Big-Five Inventory (BFI) (see Benet-Martínez and John [1998]); and Saucier's [1994] 40-item instrument. However, all these questionnaires are long. Thus, the TIPI was developed as a brief measure of the Big-Five when time is limited or when personality traits are not the central issue of research (Gosling et al. [2003]).
According to Gosling et al. [2003], although somewhat inferior to standard multi-item instruments, the instruments are suitable in terms of (i) convergence with widely used Big-Five measures in self, observer, and peer reports; (ii) test–retest reliability; (iii) patterns of predicted external correlates; and (iv) convergence between self and observer ratings.
36
2.3.3 Optimism (LOT-R)
“Optimism is the natural state of mind for most people” (Capps, Koonce, and
Petroni [2016, 79]). Some individuals have an innate tendency to expect good things to happen to them in the future, and thus have high levels of natural optimism (Capps, Koonce, and Petroni [2016], Hales, Wang, and Williamson [2015]). We use a natural optimism scale—the Life LOT-R questionnaire developed by Scheier and Carver [1985] and later modified by Scheier, Carver, and Bridges [1994]—as a proxy to investigate how investors’ natural optimism affects investment decisions. The LOT-R instrument has been extensively used in psychology literature to capture an individual’s natural optimism (Nes
and Segerstrom [2006]), and has been applied in the accounting field by Hales et al. [2015].
2.3.4. Object-Spatial Imagery and Verbal Questionnaire
Cognitive styles refer to psychological dimensions representing consistencies in an individual’s manner of cognitive functioning (Blajenkova, Kozhevnikov, and Motes
[2006]). Investors acquire and process financial information as they receive it, so understanding how different manners of cognitive functioning react in the face of managed narrative disclosure is important. OSIVQ comprises 45 questions that assess the individual differences in object imagery, spatial imagery, and verbal cognitive styles (Blajenkova et al. [2006]). The OSIVQ dimensions have been well-validated in cognitive psychology (see Kozhevnikov, Evans, and Kosslyn [2014] for a review).
37
3. EXPERIMENT 3.1 Design and sample
Data were collected via an electronic questionnaire disseminated by the Brazilian Accounting Association (BAA).2 The study’s research proposal was submitted to and approved by the BAA Board and the Fundação Getúlio Vargas Ethics Committee. Hence, the president of the BAA sent an electronic message containing the Web link to the questionnaire to professional accountants already registered with the BAA in August 2017 to invite them to take part. All respondents agreed to participate in the experiment, and data was collected anonymously.
Based on the respondents’ expertise, they were required to answer a specific set of
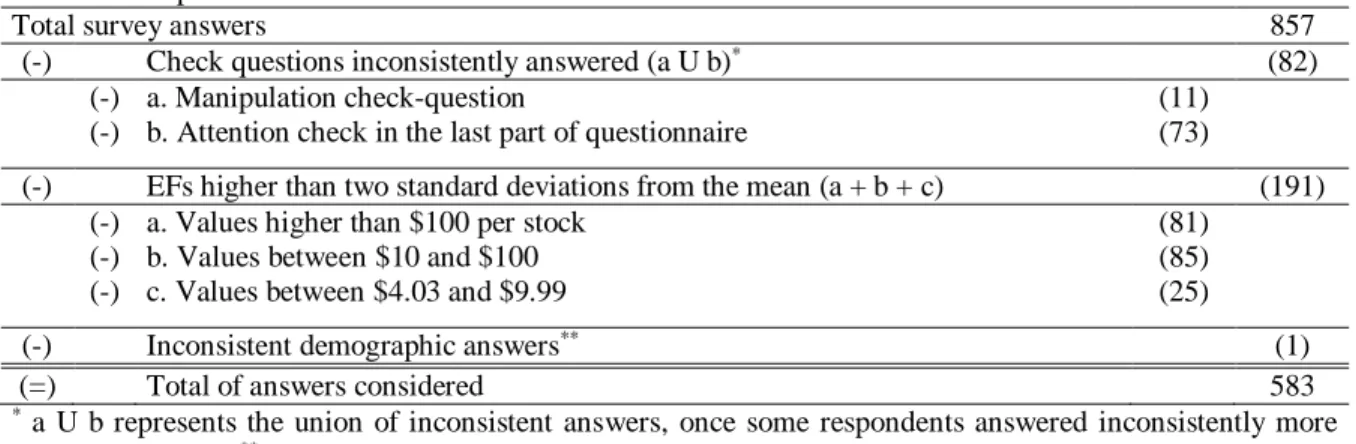
questions. Those who presented themselves as capital market investors were required to answer questions related to IM in narrative accounting disclosures (857 respondents). We eliminated 82 that responded incorrectly to at least one of two check questions. We also excluded 191 participants that gave EFs higher than two standard deviations from the mean (outliers). Participants had been shown a table with ten analysts EFs, as a benchmarking to they made their own EFs. The lower EF from this table was $0.84, and the higher one was $3.50. However, some participants made EFs that did not make sense. Because of that, we used the range of two standard deviations from the mean. One participant inconsistently answered demographic questions and also was eliminated from the sample (see Table 1). Thus, 583 professional accountants comprised the sample for this research (25% female; average age 43; average tenure in accounting 17 years; 68% married, 24% single, 8% other marital status; 67% White, 26% Multiracial, 4% Black, 3% from other ethnic background).
38
The sample was randomly classified among eight groups.3 We employed a 2x4 between-participants design that manipulated (i) Attribution and (ii) PO. The manipulations were created only on information from the MD&A, where participants received a statement with two favorable and two unfavorable pieces of information.
Table 1. Sample selection
Total survey answers 857
(-) Check questions inconsistently answered (a U b)* (82)
(-) a. Manipulation check-question (11)
(-) b. Attention check in the last part of questionnaire (73) (-) EFs higher than two standard deviations from the mean (a + b + c) (191)
(-) a. Values higher than $100 per stock (81)
(-) b. Values between $10 and $100 (85)
(-) c. Values between $4.03 and $9.99 (25)
(-) Inconsistent demographic answers** (1)
(=) Total of answers considered 583
* a U b represents the union of inconsistent answers, once some respondents answered inconsistently more
than one question. ** Age inconsistently answered.
In the attribution manipulation, subjects received information without attribution in the first condition and with attribution in the second condition. In the PO manipulation, four pieces of information about the company were presented with four different conditions. The lists were identical, but the order in which the information was presented differed in each. Series A [“Favorable First” (FF) condition] opened with favorable and
ended with unfavorable information (Favorable–Favorable–Unfavorable–Unfavorable). This order was reversed in Series B [“Unfavorable First” (UF) condition]; (Unfavorable–
Unfavorable–Favorable–Favorable). Series C [“Sandwich” condition] used the sandwich approach (Favorable–Unfavorable–Unfavorable–Favorable). Additionally, a control group [“Interspersed” condition] was created with favorable and unfavorable information
interspersed. To avoid any bias, two series were provided to the control group, Series D
3 We tested homogeneity using either a t-test or χ2 test on age, gender, tenure, income, marital status,
39
starting with favorable information (Favorable–Unfavorable–Favorable–Unfavorable) and Series E starting with unfavorable information (Unfavorable–Favorable–Unfavorable– Favorable). Thus, the interspersed condition was a combination of Series D and E. The experimental design is illustrated in Figure 4.
3.2 Tasks
Participants were required to analyze the financial reports issued by an anonymous public company and complete two tasks. After reading the initial instructions, all participants received the manipulated MD&A according to their group. Participants were also asked to indicate how favorable or unfavorable each piece of information from the manipulated MD&A was and how favorable or unfavorable the MD&A was in general on a five-point scale (1= “very unfavorable,” 2 = “unfavorable,” 3 = “neutral,” 4 = “favorable,” and 5 = “very favorable”). In terms of sequence, all participants received the same set of financial
statements, additional company information, and a set of EF from 10 independent analysts.4 They were then requested to evaluate general company information using the same scale they answered to evaluate each piece of information from the MD&A. We designed the research instrument using real financial information from a Brazilian company whose shares are traded on B35 and ADRs at NYSE and using real forecasts from analysts.
among all eight groups (p-value > 0.05).
4 We also highlighted the minimal and maximal forecasts in order to set a range.
40 Figure 4. Predictive validity model as applied to the hypotheses6
41
Dependent variables came from two tasks. First, we requested participants to make an annual EF for the company. Second, we showed participants four pairs of dichotomous adjectives and asked them to choose one of the two options for each. Each pair was given a score of 0 if the unfavorable and 1 if the favorable word was chosen. Finally, respondents answered manipulation check questions, four questionnaires to measure personal characteristics (CRT, TIPI, LOT-R, OISVQ),7 and demographic questions.
3.3 Definition of variables
We selected six pieces of information from a real Brazilian company’s MD&A. Three explained good news and three bad news about the company. All pieces of information contained phrases that attributed favorable outputs to internal reasons and negative outcomes to external reasons. We created two conditions for these: pieces of information without and pieces of information with attributional phrases. We validated the information in four steps. First, we presented the pieces with and without attribution manipulation to three master’s students and one
PhD student. All of them correctly classified the pieces of information according to the attribution manipulation and valence of information. We used their impressions about the information to confirm their classifications.
We conducted three pilot tests to improve the research design. In the first, we presented the pieces of information without attribution for 52 business professionals. They were randomly assigned to either the group that received only favorable information or group that received only unfavorable information. Based on the students’ classification of the information, five pieces of
information were found to be statistically different from the neutral classification and presented
7 We used a subsample of OISVQ (n= 478) and LOT-R (n= 375) because both are extensive questionnaires and some
42
the expected valence (favorable or unfavorable). However, the second piece of unfavorable information did not behave as expected. We also asked students about their propensity to invest in the company. Propensity to invest was statistically different in the two groups (favorable = 62%, unfavorable = 47%; χ2 = 6.45; p-value < 0.05). In this first pilot, we also asked students to write at least three adjectives that briefly described their impression of the company; these were used to create another dependent variable, as explained below.
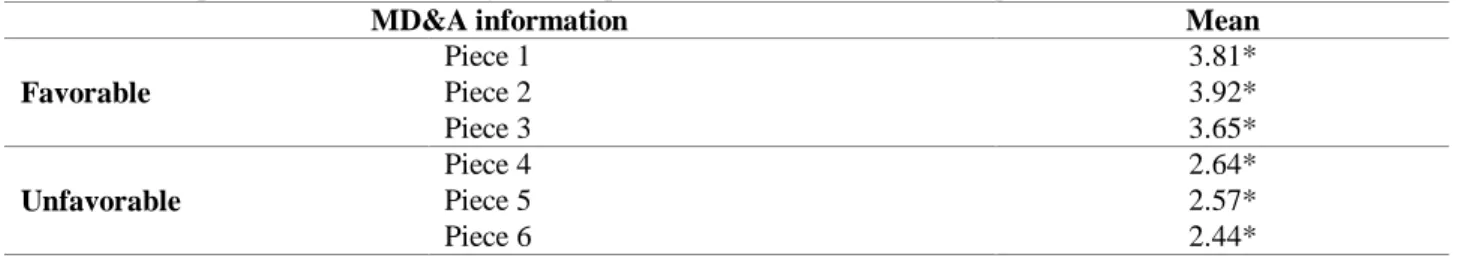
In a second pilot, we repeated the design using 22 business undergraduate students, but changed the text of the second piece of unfavorable information . The valence of this information behaved as expected but was marginally significant when compared with the neutral valence (p-value = 0.10). In a third pilot we conducted a Web-based questionnaire, which was sent by e-mail to master’s students and auditing and accounting professionals. This time, subjects were shown all six pieces of information, considering attribution and PO8 manipulations. Fifty-two subjects answered our survey. The means of the pieces of information were all as expected (see Table 2).
Table 2. Perceptions of (un)favorability of each piece of information in the third pilot test
MD&A information Mean Favorable Piece 1 3.81* Piece 2 3.92* Piece 3 3.65* Unfavorable Piece 4 2.64* Piece 5 2.57* Piece 6 2.44*
* p < 0.05 [t-test > 3 (favorable) and t-test < 3 (unfavorable)]
Although in the third pilot the Piece 5 (unfavorable information) was statically significant, we preferred not to use it; and then, we used only four pieces of information in our survey (two favorable and two unfavorable). Thus, we removed Piece 3 and Piece 5 in our final experiment
43
because it had the lowest mean among the favorable and unfavorable pieces of information, respectively.
To mitigate any effect of encoding on outcomes of judgment and choice (Kahneman and Tversky [1979]), we employed two dependent variables in our research to distinguish between estimation and evaluation tasks. Estimation tasks involve assessing a “moving average” that
reflects the position of each new piece of information relative to current opinion. In evaluation tasks, people encode evidence as positive or negative based on the hypothesis under consideration (Hogarth and Einhorn [1992]). In the estimation task, participants gave EFs after they learned about the company and about EFs from analysts. The forecasts table served as a benchmark and simplified the task.
In the evaluation task, the four characteristics (adjectives)9 operationalized in our research also underwent validation. Thereby, adjectives written by participants in the first pilot were categorized according to eight dichotomous adjectives.10 The categorization considered the link between positive adjectives that emerged from the group receiving favorable information and negative adjectives from the group receiving unfavorable information. The categorization was validated by the same three master’s students and one PhD student. We then explored the
variable in the third pilot. We selected four pairs of adjectives that presented statistical difference (p-value < 0.05) among the manipulation groups—i.e., (i) Solid–Fragile, (ii) Organized– Disorganized, (iii) Confident–Insecure, (iv) Volatile–Consistent11—to use in the final questionnaire.
9 In our pilots we referred to characteristics as adjectives.
10 Pairs of adjectives: Insecure–Confident; Disorganized–Organized; Uncommitted–Committed; Uncontrolled–
Controlled; Fragile–Solid; Dangerous–Safe; Unclear–Transparent; Volatile–Constant.
11 Participants were shown pairs of adjectives starting with positive adjectives and ending with negative adjectives,
![Figure 1. Prospect Theory Graph (Kahneman and Tversy [1979])](https://thumb-eu.123doks.com/thumbv2/123dok_br/18013250.858612/18.892.337.678.381.668/figure-prospect-theory-graph-kahneman-tversy.webp)