Applying a Lean Analysis to Process Flow
Raymond Fleming
Dissertação de Mestrado
Orientador na FEUP: Prof. José António de Sousa Barros Basto
Fa c ulda de de E nge nha ria da Un ive rs ida de do P orto
Abstract
The conversion to Lean or Lean-ism, has become a worldwide phenomenon rapidly spreading into all business sectors. Its success has and continues to draw the attention of companies of all sizes. With an enormous number of organizations following the Lean philosophy, boast of experiencing vast improvements in quality, production, customer service, and profitability. This is made possible as Lean Manufacturing offers a systematic approach to identifying and eliminating waste through continuous improvement.
The purpose of this study is to conduct a Lean Analysis of Dinis de Oliveira & Filhos (DOF), processes, identify opportunities for improvements and the potential benefits to be obtained from improvements.
To accomplish this objective, it involved mapping activities for each of DOF products, analyzing both its supplier, production and demand variability, classifying the waste which is affecting their process, identifying opportunities for improvement and identifying lean tools that can be implemented to fine-tune their production process, to reduce waste and bring about improvements of DOF operation.
The results from the analysis showed that within DOF operation there are several forms of waste: overproduction, excessive inventory waiting and movement, not only waste but also experience high variability at both supplier and customer end of its operation. All these factors collective contributes to a low value adding time for all products and long lead times.
The lean tools proposed to help counteract these waste were, VSM, pull production, Kanban, Heijunka, 5S, Visual management, Streamlining unit conversion and layout. There is great potential benefit to be gain from the implementation of lean: such as; reduction lead time, inventory, material movement, increase in unit conversion and pallet size optimization, better production control that matches customer demand.
Acknowledgement
I have had the privilege of carry out this thesis at the Department of Mechanical Engineering and Industrial Management (DEMEGI), Faculdade de Engenharia, Universidade do Porto and I’ll like to take this time to acknowledge all the persons whom have contributed to this work.
Special thanks to my advisor Professor José António de Sousa Barros Basto for his splendid effort in providing guidance expertise, invaluable suggestions, liberty and responsibility in accomplishing this work.
I would like also to thanks Prof. Maria do Rosário Mota de Oliveira Alves Moreira for all the support and assistance given to me during this work.
My gratitude also goes to Dinis de Oliveira & Filhos for providing the opportunity for me accomplish this thesis and the staff members for making me feel welcome and provided assistance whenever needed.
I also would like to thank my family for their unwavering support, love and encouragement during my studies.
Finally, I would like to thank Zarina Kenzhetayeva for being a fabulous help providing dialog, support, encouragement and laughter, all this journey.
Contents
1. Introduction ... 1
1.1. Presentation of the company... 1
1.2. Motivation for Project ... 2
1.3. Objective ... 3
1.4. Methodolgy ... 3
1.5. Limitation of Study ... 3
1.6. Outline of the report ... 4
2. Literature review ... 5
2.1. The Evolution of Operation Management History ... 5
2.2. Toyota Production System ... 6
2.3. Lean Production... 6
2.4. Lean Tools ... 8
2.5. Why is Lean needed! ... 10
2.6. Lean Tools ... 11
2.6.1. Value Stream Mapping ... 11
2.6.2. Heijunka (Uniform Plant Loading) ... 12
2.6.3. Visual Management/Control ... 12
2.6.4. 5S ... 13
2.6.5. Kanban cards ... 13
2.7. Limited Success of Lean ... 14
2.8. Practical Analysis ... 15
3. DOF Operations ... 16
3.1. DOF Products ... 16
3.2. Facility and Equipment ... 17
3.3. Production Process ... 18
3.4. Human Resources Analysis ... 20
4. Analysis and Problem Definition ... 21
4.1. VSM Tools ... 21 4.2. Sales Analysis ... 23 4.3. Supplier Analysis ... 26 4.4. Productivity Analysis ... 29 4.5. Layout ... 30 4.6. Summary ... 30 5. Proposed solution ... 31 5.1. Area of Improvements... 31 5.2. Future VSM ... 32
5.3. Production Control via Kanban Pull System, Heijunka and Visual Management ... 37
5.4. Heijunka ... 38
5.5. Visual Management ... 39
5.6. 5S and Layout Alteration ... 40
5.8. Quantifying potential benefit to be gain from recommendations ... 46
6. Conclusion ... 49
6.1. Conclusion from literature review and its implication on DOF ... 49
6.2. General Conclusion concerning Work... 49
6.3. Future work ... 50 7. References ... 51 Annex A ... 54 Annex B: ... 55 Annex C... 61 Annex D... 67
List of Figures
Figure 1The organizational structure of DOF... 2
Figure 2 Showing the product tree/catalog for DOF ... 16
Figure 3 show the process diagram for the production of CG and UCG... 19
Figure 4 showing the process diagram for the production Broken and CortiPAN ... 20
Figure 5 VSM current map CG ... 22
Figure 6 Demand Amplification CG ... 25
Figure 7 Demand Amplification UCG ... 25
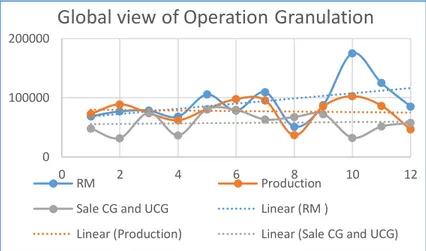
Figure 9 Global view of operation comparing RM and Sales (CortiPANd and broken) ... 27
Figure 8 Global view of operation, comparing RM supply, production and sales 2012 ... 27
Figure 10 demonstating the supplier ABC analysis ... 28
Figure 11 Illustrates the operator balance chart for production line 1, products CG & UCG ... 33
Figure 12 Redesign VSM map for the CG product ... 35
Figure 13 Visual board for jobs management ... 39
Figure 14 Visual metrics for production control ... 40
Figure 15 showing package configuration for the pallet ... 45
Figure 16 showing the raw material distribution for Granulation ... 55
Figure 17 showing the raw material distribution for CortiPAN ... 56
Figure 18 Current layout of DOF factory ... 57
Figure 19 Demonstrating the internal granulation production as a result of the variability in sales demand for 2012 .. 61
Figure 20 UCG production 2012 ... 61
Figure 21 VSM current state CortiPAN ... 65
Figure 22 VSM current state map for UCG ... 66
Figure 23 Operator balance chart CortiPAN and Broken... 67
Figure 24 Future design of VSM CortiPAN ... 68
Figure 25 Future VSM UCG ... 69
Figure 26 New layout design ... 72
Figure 27 Shows the value associated with the current quantity of inventory stored for each porduct ... 74
List of Tables Table 1 Several forms of waste ... 7
Table 2 showing Shah and Ward 10 factors constitute lean philosophy ... 9
Table 3 5S tools ... 13
Table 4 Sales quantities for 2012 ... 17
Table 5 Showing any estimate square meter allocation of DOF main buildings... 17
Table 6 Illustrating the equipment and machine catalog of DOF... 18
Table 7 showing the result from the Process Activity Mapping ... 21
Table 8 Results of the VSM ... 22
Table 9 Sales Analysis for past three years ... 23
Table 10 Sales analysis of DOF main products ... 24
Table 11 Shows the contributing elements to the 2012 sales volume ... 24
Table 13 Showing the results for the standard deviation of Sales Analysis ... 24
Table 14 SD for raw material supply ... 26
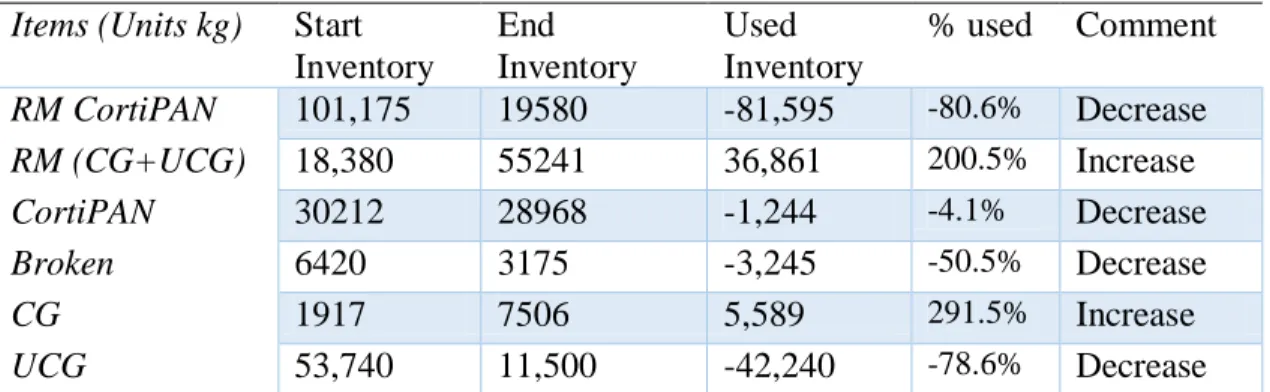
Table 15 2012 Before and After look of products and raw material standings ... 28
Table 16 Supplier location analysis ... 29
Table 17 Comparative analysis of production over a 3 year time period ... 29
Table 18 CortiPAN productivity test ... 30
Table 19 5W1H: Areas for improvements and recommendation action... 32
Table 20 Operator balance table for production line 1, products CG & UCG ... 33
Table 21 Operator balance table for production line 2, products CortiPAN and Broken ... 34
Table 22 Results for the redesign VSM map, with comparison to the current VSM map. ... 36
Table 23 Identifying the new Production Control (PC) points in the new VSM ... 36
Table 24 Kanban Calculation for product ... 37
Table 25 Heijunka levelling table for the pacemaker process in production line 1&2 ... 38
Table 26 5S program ... 41
Table 27 Units conversion between workstation analysis... 43
Table 28 New proposed transfer size between workstation and its respective unit conversion ... 43
Table 29 CortiPAN current packaging practice analysis and future proposal ... 44
Table 30 Showing results obtain from optimizating the pallet space utilization ... 45
Table 31 Quantitfing benefits of the New VSM ... 46
Table 32 Estimating the tansportation cost saving, due to pallet optimization. ... 47
Table 33 Accounting the potential value changes for pallet ... 47
Table 34 Benefits from new transter batch at the pacamaker ... 48
Table 35 Results of how changes in transfer bactch affects PAM of CG... 48
Table 36 Shows the reduction is material travel which can be obtain with the new layout proposed ... 48
Table 37 Showing the results from the Shah and Ward (2003) Lean Bundles ... 54
Table 38 Shows a list of all the raw material used in manufacturing DOF products ... 55
Table 39 Human Resources Analysis ... 58
Table 40 Showing the baking time according to CortiPAN thickness ... 60
Table 41 Process Activity Mapping for CortiPAN ... 62
Table 42 Process Activity Mapping for CG ... 63
Table 43 Process Activity Mapping for UCG... 64
Table 44 Operator balance chart table for production line 2 CortiPAN and Broken ... 67
Table 45 Kanban calcualtion ... 70
Table 46 Showing the Frequency of moment of FG in the WH ... 73
Table 47 Calculating the potential savings with new VSM design ... 73
Table 48 Value of stored inventory for each product ... 74
Table 49 Calculation for the estimated revenue increase due to changes in CortiPAN packaging ... 74
Table 50 Showing the cost break down VC and FC ... 75
Table 51 Calculating the increase in VC for the new package configuration ... 75
Table 52 Accounting the increase in VC ... 75
Table 53 Showing a list of DOF suppliers and the distance from the company ... 76
List of Abbreviations
ABC Activators, Behavior and Consequences Bales 60kgs compressed grains for shipping BB Big bags equivalent to 162kg
CG Compressed Grain DOF Dinis de Oliveira & Filhos FG Finish Goods
FIFO First in First Out FOM Frequency of Movement FPS Ford Production System HRM Human Resource Management JIT Just in Time
LT Lead Time MC Manufacturing Cell MTO Make of Order MTS Make to Stock
OM Operation Management PAM Process Activity Mapping PC Production Control RM Raw Material SD Standard Deviation
SME Small to Medium Enterprise SMED Single Minute Exchange of Die TPM Total productive management TPS Toyota Production System TQM Total Quality Management UCG Uncompressed Grains/lose grains VA Value Added
VSM Value Stream Mapping WIP Work In Process
1. Introduction
In this chapter we present an introduction to the report, introducing the reader to the host company and the work conducted. The chapter is divided into five parts firstly we present a brief description of the host organization which provided the opportunity to carry out this dissertation at their facility, then the motivation, objective of the work, the methodology applied to accomplished the objectives, limitations faced during the work and finally we give an outline of the report.
1.1. Presentation of the company
Dinis de Oliveira & Filhos (DOF Cork, hereafter referred to as DOF), is a private limited company founder by Mr. Dimas Dinis de Oliveira Alves in 1987, which operates in the Cork sector of Portugal. Nested in the heart of the cork industry in Mozelos, DOF is a SME with a human resource capital (HRC) of 21 employees which are shared between the Production and Administration of the company.
Presently its operations is centered on transforming cork into green products, with a product range that includes cork boards (CortiPAN), cork rolls (CorkROLL) and granulated cork (CorkGRAN). These products are sold both locally and internationally, with their customer based spanning as wide as Europa, Latin America and the Middle East.
DOF products are employed by several industries such as: automotive, construction and manufacturing; being used for thermal and acoustic insulation, as final coating (finishing), manufacturing of lightweight concrete and other derivative products e.g. seals used in cars. From its inception up till now DOF has undergone several organizational changes, where were milestone in its development, allowing for growth over time, below we highlighted some of the significant milestones in DOF evolution to the organization that exist today.
1953 Mr. Dimas Dinis de Oliveira Alves founded Fernando de Oliveira & Irmão, Lda with his brother, which was dedicated to cork preparation, production of cork stoppers and natural planks.
1987 The company was separated between the brothers with Mr. Dinis Dimas Alves founding Dinis de Oliveira & Filhos. Continuing with the cork preparation, production of blades, adding Granulated cork to serve markets such Brazil, Mexico and Argentina 1990’s The company abandoned the production of sheets of cork and increased its capacity in
the production of Granulated cork.
2001 The company changed its statutes to anonymous society.
2008 Dedicated its production of Crushed, Granulated and CortiPAN (chipboard).
2012 New management, with ideas, changing the company’s direction, focusing on entry into new markets, developing HRC; employee’s competencies, incorporating their knowledge in areas of marketing and human resources management and quality
Currently the company is manage by Dr. Rosa Maria Alves and Mr. Dimas Manuel Alves successors of the founder figure 1 shows the organization chart of DOF; illustration its four departments Administrative and Financial, Purchase and Production, Commercial and Marketing and Maintenance and Quality Control.
1.2. Motivation for Project
DOF is a small traditional company which to date has executed its operation in a very traditional manner in that, work is pushed through the manufacturing process unrelated to demand, stocking large quantities of inventory. However the cork sector which DOF operates in is a highly competitive sector with 2471 companies’ all competing for market shares, DOF new management team in understanding this competition in sector, aim to increase their competitiveness: by looking at techniques that can help them cut cost, elimination of waste and improve performance, and market share by enter new markets internationally and also locally. As a result they’ve decided to take the required steps to improve their internal processes, product quality, etc.
The Cork industry is one of the most important industries of the Portuguese economy, having 62% of the world market, constituting to 70% of export trade and 16% of the export income of Portugal. Despite the success of the cork industry there over hangs, a dismal past and a daunting immediate future, in the Global economy as a result of the long period of economic uncertainty, in much of the world’s developed economies. This is a warning for all companies to being more efficient in the operations and activities, to stay productive and react to any side effects in their business actives due to uncertainty in the global economy?
1 Association Portuguese Cork
1.3. Objective
The purpose of this study is to conduct a Lean Analysis of Dinis de Oliveira & Filhos (DOF), processes, identify opportunities for improvements and the potential benefits to be obtained from improvements.
1.4. Methodolgy
To conduct this study we look at the problem from systematic point of view, incorporating suppliers, customers and internal behavior of DOF. This approach was used based on the understanding that a system is made up of parts, all of which should work in tandem with each other, any deviation in one would affect the others, and to improve the system we must address the individual parts
The research is presented as a case study where we’ll conduct an in-depth analysis of DOF operation, exploring for irregularities, describing these irregularities and identifying possible solution explaining the gaps. To complement the case study method, we utilize a small cross section analysis to identify similar work accomplish in other industries, to glean some insightful information from their work, such as solution or barriers in implementing Lean Tools in SME, which is very useful to this study, such as DOF is an SME which aims at improving the process with the application of Lean Tools.
All the data used/analyzed in conducting this dissertation consist of both primary and secondary data, because of the age of DOF’s operation, some of the equipment employed don’t have any capacity ratings therefore in some case we had to used induction to estimate the capacity rating or operation information of the machinery. All sales records quoted in the report were secondary data obtain for the accounting department in most case the rest of the data was primary data retrieved during the thesis. Below shows the process followed during this study, however it should be noted that in most case the process was iterative one.
Visit the company – discuss company’s operation, aim and outcome of this study Literature review – to identify tools which can be used in to analyze the operation
and also tools to be applied at DOF.
Analyze DOF Cork operation – using tools such as VSM, PAM, ABC etc. Share findings with management to ensure accuracy of results obtained. Identifying areas of Improvement
Review improvements suggestion with management - Iterative step Identify final possible improvements and quantify benefit to be gain. 1.5. Limitation of Study
While carrying out this dissertation there were several limitations faced, which in one way or another influence the execution of the study. In this section we’ll identify all limitations which were encountered during the course of the dissertation.
Lack of available data – this presented itself in the form of lack of equipment/machinery capacity
ratings making it difficult to identify where constraints equipment resources exist and where not. This is due to the fact that some of the equipment utilized was manufactured/created in house by factory workers, adapted to their specific needs and constrictions (such as space, etc.).
Access – essential to the success of this study is attaining the operative facts of the process:
accessing the practical knowledge of the factory workers, however access to this information was limited to the availability of one individual within the company, because of a language barrier between the workers and myself at the factory.
Longitudinal effects – because of the time limitations given for the study, which was greatly
reduced by delayed start of the work (March 27th) due to the difficulty encountered in finding a
host company, it wasn’t possible to implement solution and measure change/stability within the time constrained specified by FEUP for submission of dissertation. To overcome this limitation we quantified the projected result to be obtained if the solutions were implementation. Another element of the longitudinal effect is seasonal natural of DOF operation which is very dynamic, with systems constraints changing with the season. One example: during this study the bottleneck was determine as the dehumidifier, which is the case during the cold months of the year, however during warm months when the raw material is less humid there is less demand on the dehumidify and as such the system constraint changes. However was impossible to investigate this due to the time limit.
Fluency in a language – this study was conducted in a Portuguese company where only two
individuals were able to communicated professionally in English, neither was I fluent in Portuguese, thus creating barriers, that hinder direct communication between workers and myself.
1.6. Outline of the report
To help provided clarity to the layout of the report, making it easy for the readers to identify specific chapter in the report, we present here the content of the report.
Introduction: This section gives an insight/brief history into the company where the project was
conducted, the reasoning for commissioning this study, the expected outcomes and finally the methodology used in executing the dissertation.
Literature Review: analyzes the State of the Art in the field of Lean covering areas such as the
history and evolution of Lean philosophy, what constitutes lean and the lean tool proposed for use in this case study.
DOF Operation: gives an in depth look at the products, production lines and its resources. Critical Analysis and Problem defining: here we present the analysis of DOF’s operation, its
VSM, PAM, ABC Sales and Suppliers.
Proposed Solution: in this chapter we present our recommendation based on the analysis and
Problem identified in the preceding chapter, quantifying the expected benefits to be grain from the proposed solution.
Conclusion and Future Work: here we present the conclusion for the work conducted, problems
faced, benefits to be gain from solution suggested and also recommendation for future work.
References: In this section includes a list of the literature used during the study.
Appendix: Complementary data and information, that wasn’t possible to fit into the body of the
2. Literature review
This chapter reviews the state of the art on Lean philosophy, we’ll start with a brief history on the evolution of Operation Management, after which we’ll look at TPS and Lean working our way through the history of Lean, into the lean concepts defining and explore the different dimensions of lean manufacturing, exploring the relevance of lean, some critical views of lean philosophy and its shortcomings and finally finishing up the literature review with some case studies which carry out similar work as this, presenting the ideas and findings of these articles which we’ll believe are central and interesting for our further work.
2.1. The Evolution of Operation Management History
Operation Management (OM) is define as the design, operation and improvement of systems that create and deliver the firm’s primary products and services (Chase et al. 2004), another definition I found interesting was offered by Chopra et al. (2004) which define OM as the design and management of any transformation processes that creates value for society. The transformation process is the conversion of inputs or raw material such as labor, equipment, raw material, information and capital resources into outputs goods and services, not forgetting the flow of information or feedback from the end customer to the Inputs via the improvement process or directly to the Inputs. This definition encompasses the normal view of OM as a manufacturing discipline, but its evolution into areas of Service, Marketing, Logistics, etc. Due to this expansion of the boundary of OM it’s difficult to define the boundaries of OM (Hayes, 2000).
Several authors such as Chase et al. (2004), Erkan Bayraktar et al. (2007) and Nankervis et al. (2005), states that the field OM has its origin in 1910’s, thus being at least 100 year old. During this 100 years there have been several milestones along the way which has contributed to the shaping of OM has we know it now. We’ll briefly explore this evolution,
Scientific ERA – Erkan Bayraktar et al. (2007) suggested that OM started in the western world in 1913 with Henry Ford and his idea of creating the world’s first assembly, however Skinner (1985) OM first came to being during the time frame 1890-1920, is a better referred to as the Scientific Management era, with works by W. Taylor, Frank and Lillian Gilbreth and Henery Gantt.
Golden ERA – During this time 1930 to 1960 the main focus was developing algorithms and methodologies to solve optimization problems (Chopra et al., 2004). Some of the main contributor were Walter Shewhart 1924 (statistical sampling and quality control), also during this time frame Information Science was integrated into OM setting the foundation for the development of Total Quality Management (TQM) given by Deming in 1947, and the Japanese innovation, with Kanban, JIT which was a part of Toyota Production System, other tools introduce are Material Requirement Planning (MRP) 1960, and Material Resource Planning (MRP II) 1970.
Expansion of OM – During the 1980s there was a wider acceptance of OM, as a functional field in the organization (Erkan Bayraktar et al., 2007), this was due to the increasing competitiveness driven by the Japanese, who focused on cost reduction during early 1980s, later shifting to quality through collaboration of information systems and leanness (Heizer and Render, 2006). Here again it was observed that the internet provided again opportunity for more development in the field of new tools to function and connect with customers. Such as, Customer Relation Management
(CRM), Supplier Relation Management (SRM), Supply Chain Management (SCM) and Knowledge Management (KM). Finally Concluding with E-commerce or Collaborate commerce as the final innovation in OM.
2.2. Toyota Production System
Toyota Production System (TPS), was given birth out of a need of the Japanese’s industry to succeed despite shortage in both Capital and Resources after the Second World War (Erkan Bayraktar et al. 2007).With Taiichi Ohno being accredited as the originator of the TPS, TPS model has two main concepts which are;
1. Reduction of Cost by the elimination of waste and,
2. Full appreciation and utilization of the workers capabilities.
The motto if you like to say was “High Quality but low cost”. Thereafter TPS emerged as the dominant production model, allowing the Japanese automotive industry to experience tremendous success outperforming its western counterparts (Womack and Jones 1996). The capabilities of TPS was made popular by Womack and Jones (1996), in both their Harvard Business School Case Studies and also in their book The Machine that Change the World and also with work conducted by the International Motor Vehicle Program by MIT’s. The Toyota Production System as its name suggest is a system constituting several concepts and facets, developed during the 1950’s, by Taiichi Ohno incorporating such concepts as, Kanban, JIT, quality cycles, Continuous Flow, just to mention a few. Shah and Ward (2007) in their article suggested that the TPS, however found its roots in the Ford Production System (FPS), developed by Henry Ford in the 1937, with Ohno, Kiichiro and Eiji perfecting the principle concepts and tools within the FPS. Later on during the 1980’s TPS was documented and shared to the westerner world via books and joint ventures between Japanese Companies and Western Companies one such example is NUMMI between Toyota Motors and General Motors.
2.3. Lean Production
Lean Production is a direct descendant of the TPS model, the term was coined by Womack and Jones in the book the Machine that change the World (Hineset et al. 2004) and like its predecessor Lean Production philosophy aims on waste elimination by reducing the cost of the overall production process, while utilizing production labor through continuous improvement process (Womack et al., 1990). Which provides an alternative to the capital intensive mass production (with large batch sizes dedicated assets and hidden waste) offered my Henry Ford (Hines et al. 2004). A key of Lean Production ability to eliminating waste in a production process is its focus on the value stream of the product during its manufacturing process, with the intention to identify and eliminate non-value added operation for example storage, transportation and inspection. By following these five steps (Womack and Jones 1996)
Identify the Specific value as defined by the customer.
Identify the value stream: the core set of actions required to produce a product.
Make the value flow the method of aligning the processes to facilitate the critical path. Let the customer pull: the customer should begin to ‘pull’ product on an ‘as needed’ basis. Pursue perfection: develop and amend the processes continuously in pursuit of perfection.
In the academic world today there isn’t any one accepted definition of Lean Production, this is because unlike during the early days of Lean introduction, when only the Japanese used the philosophy and there was limited published books, today there are hundreds of books and thousands of articles which have review and documented TPS and Lean Production, each offering slightly skewed different definition and concepts that are integrated into their philosophy. This therefore bring the question what is really Lean Production and what integrates?
Shah and Ward (2007), debated that currently there are many terms for both TPS by extension Lean Production which have be ingrained into the academic world, being it, from scientific studies or business reviews resulting in semantic discrepancies being introduce into this subject area. Sighting that there aren’t any precise and agreed way for defining the concept of Lean Production. They however highlighted two perspectives that can be used to build a definition for lean production, i.e. philosophical and practical perspective.
A philosophical perspective related to guiding principles and overarching goals (Womack and Jones, (1996); Spear and Bowen, 1999),
A practical perspective of a set of management practices, tools, or techniques that can be observed directly (Shah and Ward, 2003).
Since this dissertation is more gear towards the process improvement, with the implementation of lean tools and techniques, I’ve decided to opt for the practical perspective. Therefore I’ll adapt the definition offered by Shah and Ward (2007).
“Lean production is an integrated socio-technical system whose main objective is to eliminate waste by concurrently reducing or minimizing supplier, customer, and internal variability.” This definition brings together two important points, Waste and Variability. Waste in Lean jargon is referred to as ‘muda’; muda can be define as “anything other than the minimum amount of equipment, material, parts, space and time which is absolutely essential to add value to the product” (Russell and Taylor, 2000). The core of the lean production philosophy is the focus of avoiding waste and also on respecting customers, employees and suppliers (Schonberger, 1986). Lean philosophy however has deconstructed waste into seven fundamental forms, better known as the seven form of wastes. These seven fundamental waste have been widely identify and agreed upon by the academic body and are known as;
Table 1 Several forms of waste
Types of Waste Description
Over production Producing more, sooner or faster than is required by the next process.
Inventory Purchasing or making products before they are needed
Transportation Refers to physical items and data (rather than the movement of people) and excessive motion between work stations.
Over Processing Doing extra work which the customer doesn’t require. Waiting Referring to people or things waiting around for next action.
Movement Refers to the physical movement of people
In Addition to the seven fundamental waste, there is an expansion to incorporate other forms of sevens such as confusion (any missing or misinformation), unsafe or ergonomic (workplace working condition which can cause discomfort such as eye fatigue, pain etc. and finally underutilized human potential/waste of creativity.
Variability is customer, supplier or internal operations are perilous to any companies operation. Demand variability can ripple through the entire production process and cause havoc to
daily production schedule.
Supply variability occurs when suppliers fail to deliver the right quantity or right quality at the right time or the right place (Womack et al., 1990).
Internal variability that is process time variability is third aspect which can affect the productivity of company and by extension the ability of the company to meet customer demand and also their profitability.
These three variables are codependent on each other, making it of vital importance that they work in an interactive tandem with each other to achieve the goal of Lean Production, because any fluctuation or variation experience by either of these would cause a domino effect in the others, thereby reducing the effectiveness of the others variability. Causing havoc on a company’s operation, resulting in failure to meet customer demand and also affecting both the productivity and profitability of the company.
2.4. Lean Tools
Thus far we have mention the origin of Lean, as the successor of TPS and also explore the element which lean production aim to address, these are the seven waste and also variability within a operation be it supply, demand or internal variability. In order to attack these seven forms of muda and variability, Lean Production offers several tools and techniques which can be implement and utilized, to help corporation’s reduce and eliminate their waste and achieve a stable operation. Again however, like in the definition of the concept of lean production there exist chaotic state when referring to lean tools, Shah and Ward (2007) in their critical analysis of the subject matter Lean Production try to address this chaotic state in the academic world about lean tools.
First let’s explore where the problem exist, several other author beside Shah and Ward (2007) such as Sakakibara et al., (1993) McKone and Weiss, (1999), and Cua et al., (2001) also mention this Shah and Ward (2003), give support to the idea that there is a chaotic state within the theory of Lean Production, as a result of three issues which they have limit to the following.
First problem arises because some concepts have undergone a change in status over time. Preventive maintenance for example, in most of the early research, it was used as one of the underlying dimensions of JIT but it is now established as an independent construct and is used to predict manufacturing performance.
Second problem occurs when identical items are used to operationalize vastly different concepts and finally,
The reverse case in which different items are used to operationalize the same construct. As a result of this chaotic state in the academic world with reference to Lean Production concept and the tools integrated into its philosophy Shah and Ward (2007, 2003) conducted a critical
analysis of the subject matter with the goal to bring some order and clarity to the body of knowledge. Their studies conclude some interesting ideas: in the first study Shah and Ward (2003) investigated the application of 22 lean practices and categorized them into four “bundles”, i.e. just-in-time (JIT), total quality management (TQM), total productive management (TPM), and human resource management (HRM), in a variety of industries in the US, and observed that 23 percent variation in operational performance attributed to the use of lean bundles. They also observed a strong influence of plant size on lean implementation and a less influence on plant age and unionization. In the subsequent study Shah and Ward (2007) argued that lean is a multi-dimensional construct and developed ten distinct factors/dimensions to characterize lean production system.
The 10 factors identified in their study, can be grouped into three, Supplier Involvement (related) consisting of three measure, Customer Involvement, consisting of one measures, and finally Internal firm Involvement, consisting of six measures. Together, these 10 factors constitute the operational complement to the philosophy of lean production and characterize 10 distinct dimensions of a lean system Shah and Ward (2007).
Table 2 showing Shah and Ward 10 factors constitute lean philosophy Underlying
construct
Operation Construct Description
Supplier Related
SUPPFEED (supplier feedback)
Provide regular feedback to suppliers about their performance
SUPPJIT (JIT delivery by suppliers)
Ensures that suppliers deliver the right quantity at the right time in the right place.
SUPPDEVT (supplier development)
Develop suppliers so they can be more involved in the production process of the focal firm. Customer
Related
CUSTINV (customer involvement)
Focus on a firm’s customers and their needs. Internally
Related
PULL (pull) Facilitate JIT production including kanban cards
which serves as a signal to start or stop production.
FLOW (continuous flow) Establish mechanisms that enable and ease the continuous flow of products.
SETUP (set up time reduction) Reduce process downtime between product changeovers.
TPM (total
productive/preventive maintenance)
Address equipment downtime through total productive maintenance and thus achieve a high level of equipment availability.
SPC (statistical process control)
Ensure each process will supply defect free units to subsequent process.
EMPINV (employee involvement)
Employees’ role in problem solving, and their cross functional character.
NB: Please refer to Shad and Ward (2003 and 2007) for further detail and diagrams
It should be noted the seamless correlation between the objective of lean production and the 10 factors of lean exist, for example as stated in the lean definition, the objective of lean production
is to eliminate waste while at the same time reducing variability related to supply, processing time, and demand. The three of which are accounted for and addressed by these factors. However a point of vital importance in implementing Lean production to address the aforementioned issues is, reducing variability related to only one source at a time helps a firm in eliminating only some of the waste from the system; not all waste can be addressed unless firms can attend to each type of variability concomitantly. That is, processing time variability cannot be eliminated unless supply and demand variability is also reduced Shah and Ward (2007). The work conducted by Shah and Ward (2007, 2003) was cited by several authors in academia, for the contribution to the scientific body of knowledge such as Ahmed M. Deif (2010), AndreasHu¨ ttmeir (2009), Alireza Anvari e al. (2011) and Er. Rajesh Kumar (2012), just to name a few, hence the reason we’ll deem it important to be included here.
2.5. Why is Lean needed!
At this time we’ll explore the significance of lean and match it with the reality in which we live today, to give a different perspective and reaffirm its relevance today before we explore further Lean production and its tools. The Global Competitiveness Report 2012–2013 focused on Measuring Competitiveness; the report started with a reminder of the dismal past and a daunting immediate future, as a result of the long period of economic uncertainty. Highlighting that global economy is facing a number of significant challenges that is hampering a genuine improvement as economic crisis continuous, already half a decade long in much of the world, most advanced economies (Klaus Schwab et al., 2013).
This uncertain global economy has several ramifications, and sustained structural reforms aimed at enhancing competitiveness is necessary to ensure stabilize economic growth. Although this is happening at a global level these effects would trickle down into the all sectors of the global economy, and as the global economy slows there is a greater need to company’s and businesses to tighten their belt, to ensure their survival during time economic uncertainty.
Added to this global economic insecurity there is another factor which intensifies the need for companies to become more competitive, this is their customers. With the introduction of ecommerce, this has revolutionized business and one side effect of that is, customer’s expectation has increase. Today customers have higher expectations from their purchases, such as greater customization, faster delivery/response time etc. and manufacturers need to meet these expectations by increasing a product’s quality, reducing delivery time, and minimizing product costs or a combination of the three (George, 2002).
With these two combine, companies need a systemic approach that can help improve their competiveness while at the same time be customer focused. Lean offers a solution, to this scenario, TPS was able improve the Japanese competitiveness during their time of difficulty when capital and resources were difficult to acquire, (Erkan Bayraktar et al., 2007) and now again it seems that history has repeat itself and the situation is right for Lean Production to help company’s navigate their way out of this bleak presents into a brighter more productive future the Lean way.
2.6. Lean Tools
There are several tools and techniques which belong to the philosophy of Lean production in this section I aim at giving an insight only to the tools integrated into lean which would be used during the thesis, the other tools would only be stated for recognition purposes.
2.6.1. Value Stream Mapping
Value stream Mapping (VSM) is an extension of the Toyota’s Material and Information Flow (MIF) technique, which maps all activities, value added as well as non-value added required to bring a product or a group of products through the main flows, from raw material to the end customers (Rother and Shook, 1998). VSM has become an enterprise improvement tool that helps in visualizing the entire production process, representing both material and information flow, which is occurs within the door to door activities of a company’s operation, (Bhim Singh et al. 2010). This technique was evolved from Toyota Material and Information diagram, Rother and Shook, (1998) in their book “Learning How to See’ illustrates VSM as a pencil and paper tool aim at helping individuals to see and understand the flow of material and information as a product makes its way through the value stream. Womack JP et al. (1990), emphasized that VSM has to be carried out as the first step towards lean implementation.
‘Whenever there is a product for a customer, there is a value stream. The challenge lies in seeing it.’
(Rother and Shook, 1998) There are essential four steps within this technique, which are;
1. Select Product Family 2. Construct current state map
3. Design the future state map and finally 4. Work plan and Implementation
In mapping the value stream, one thing that must be noted is what constitute value and what doesn’t, all activities can be grouped into the following categories,
Value Added Activities – these are activities that transform the product or service into something the customer wants and is willing to pay for.
Non-Value Added – Pure waste: all activities which consume resources but add no value, e.g. rework, non-productive meetings, etc.
Required Non-value activities - this are activities that create no value but at the same time can’t be eliminated for the company, based on law, existing technology, equipment etc. also activities required to keep the company operating such as vehicle maintenance, training etc.
It is estimated that all work done in a product stream only 20% contributes to Value Adding, with 50% being non-value added activities (pure waste) and finally the required non-value activities making up the remaining 30% of the value stream.
A key element in the design of the future state map is the Takt time, which is used to synchronize the pace of production with the pace of sales, particularly at the pacemaker/drum process.
𝑇𝑎𝑘𝑡 𝑡𝑖𝑚𝑒 = 𝑎𝑣𝑎𝑖𝑙𝑎𝑏𝑙𝑒 𝑤𝑜𝑟𝑘𝑖𝑛𝑔 𝑡𝑖𝑚𝑒 𝑝𝑒𝑟 𝑑𝑎𝑦 𝑐𝑢𝑠𝑡𝑜𝑚𝑒𝑟 𝑑𝑒𝑚𝑎𝑛𝑑 𝑟𝑎𝑡𝑒 𝑝𝑒𝑟 𝑑𝑎𝑦
We can look at the annex C figure 21& 22 for examples of current VSM of DOF. Rother and Shook, (1998). Hines P, Rich N (1997), identify and classified several other mapping tools which, bear some similar characteristics of VSM, these tools are; Process Activity Mapping (PAM), Supply Chain Response Matrix, Production Variety Funnel, Quality Filter Mapping, Demand Amplification Mapping, Decision Point Analysis and Physical Structure Mapping. However we’ll not be going into any details with these tools.
2.6.2. Heijunka (Uniform Plant Loading)
Variability internal or external of the companies operation isn’t good at all, Shah and Ward (2007) however stated that stability in operation, supply and demand are much more desirable factors. Uniform plant loading or Heijunka is a tool that focus on protecting the producer from variability in the sequence of jobs to be processed, AndreasHu¨ ttmeir (2009). Coleman et al. (1994), states that the concept Heijunka incorporates both concepts of leveling and line balancing, in that it matches the capacity of a process to its capability and in most of the literature review Heijunka concept was closely related to Kanban, with authors mentioning a Heijunka Kanban system. Heijunka is not only to level production volume, but also level the product mix by having the same order of products for each production cycle (Demand leveling), Judith Matzka (2012).
The are two primary goals of Heijunka;
To supply one or more customer processes with a constant flow of small lots of different parts and at the same time generating a constant demand of parts for upstream processes. Thus reducing or eliminating the need for spare capacity or stocks to cope with peaks of demand.
To reduce the bullwhip effect.
2.6.3. Visual Management/Control
When trying to identify the source of problems within an organization which could result in excessive waste, long lead time and other despises characteristics, information availability is usually not the problem; rather it is the communication of this said information which seems to be ineffective (Bilalis et al. 2002). Clear, visual communication ensures information such as customer requirements, production schedules, and the objectives set by management are effectively disperse and understood across an enterprise (G. C. Parry et al. 2006).
This ties to one of the keys principles of lean thinking, which is, every employee should be able to see and fully understand the different aspects of the process and the status of activities, so that he or she will be able to take appropriate action (Womack and Jones 1996 and G. C. Parry et al. 2006). Therefore we see that visual tools form an important part of the communication process which drives lean factories, making processes transparent, highlighting errors/faults and allowing for immediate feedback about areas where adjustment may be required to ensure the process fulfils customer pull (Womack and Jones 1996). Visual Tools aim at influencing workers behavior, as explained by Bilalis et al. (2002) ABC model, A - Activators are environmental cues that give
direction to the behavior, B - Behavior is the sequence of observable actions sometimes brought about by the activator. C - Consequences are outcomes that follow behaviors and determine the probability of that behavior occurring in the future.
Thus it’s evident that visual control can help keep process and workers in check with regards to the customer demand. When thinking about visual control tools to implement 5S is an excellent place to start. 5S principle drivers’ workers or their behavior towards a clean, organized workplaces, by ensuring all raw materials (RM), work in process (WIP) and finish goods (FG) are located neatly in well label spaces. Another tool that can be very useful is Visual Management Control Boards, whereby management can track work at each stage in the process to ensure that the task remain on schedule.
2.6.4. 5S
5S is a program which aims at improving the productivity, quality, and safety, by applying techniques such as visual order, organization, cleanliness, and standardization. 5S is define as a structured program to systematically achieve total organization, neatness, cleanliness, standardization and discipline in the workplace, ensuring that the workplace is well organized for optimal worker performance, (Abhijeet S. Deshpande,et al., 2012; Tushar K. Acharyaa 2011; Alireza Anvari et. al., 2011). As the motto goes ‘a place for everything and everything in its place’ is the governing principle of the 5S tool. The 5S are five Japanese themes which are;
Table 3 5S tools
5S Description
Seiri (sort) Separate what is needed or not needed in the work area
Seiton (set in order) Organize what remain in the work area
Seiso (regular maintenance) Clean and inspect the work are
Safety Create a safe place to work
Seiketsu (standardize) Standardized cleaning, inspection and safety practices. Shitsuke (sustain the improvements) Make 6S a way of life.
The emphasis is on seeking out areas where work processes can be improved and implementing and standardizing the new improvements. Alireza Anvari et. al., (2011) suggested that there is an evolution of the 5S tool, into 6S (5S + 1S = Safety), 6S is an extension of the 5S model to incorporate safety “safe work environment “the six S, which was added by Universal Coordinated Time to emphasize safety in the work place. The 5S/6S tool help reduce defects, make accidents less likely, reduce costs and increase productivity. Fostering a culture of continual improvement and employee engagement that is essential for successful implementation of Lean.
2.6.5. Kanban cards
Kanban is a Japanese word for card, which was develop with the JIT philosophy to achieve pull production flow, which is the opposition to the common and dominant push production found in many industries; this being said Kanban cards as a twofold function (Shaojun Wang et. Al., 2004), which is;
1. Production control to tie different manufacturing processes and to ensure that the delivery of necessary amounts of material and parts at the appropriate time and place.
2. Process improvement: includes improving the operations in the production process with emphasis on reducing inventory costs.
A kanban usually includes the information such as part number, description, container, unit load (quantity per container), stock location (from), end process (to), and some other optional information such as lot size, number of kanbans per lot, machine number of final operation, individual kanban. The role played by kanbans in a supply chain system has a general purpose in the sense that it is not only an information carrier, but also material carrier (or transporter).
2.7. Limited Success of Lean
The success of lean has be well document and publish by many authors and researchers in books, journals etc. However in this section we aim not to focus on the success of lean implementation, rather to explore some of the contrary views in the academic society with reference to the lean philosophy. Despite the bulk of author supporting and crediting the success that organization can achieve at the hand of lean philosophy, there are a few who disagree with the wider population about the lean philosophy successfulness.
One such places where lean has be criticized is the Job shop, which is characterized by high variety and low volume, opposite to that manufacturing industries thus success experience here is limited. James-Moore and Gibbons, (1997) stating that lean focus on optimizing value-added activities, however these activities doesn’t consider the size, complexity or manufacturability of a product, facts which become important in the Job shop environment, therefore suggesting that the universality of lean must is questionable. Bamber and Dale, (2000) suggested three reason for this: Huge product portfolios mean that each “job” is likely to be different and therefore
production approaches cannot be standardized.
The products’ characteristics create production constraints.
The job-shops or smaller firms simply cannot match the dominance or resources that the larger firms enjoy, allowing them to be inflexible along their supply chains
Parker and Slaughter, (1994) viewed lean as being pro-company, not pro-employee, has such employees feel a sense of insecurity, perceiving lean as a redundancy threat. Cusumano and Nobeoka (1998) examine the Toyota product development processes by multi-project management, suggesting that it indirectly implies that one of the limitations of the lean principles is single-project focus, which can cause wasteful designs and products contradicting the concept of eliminating waste. Lamming (1996) suggests that a truly lean system may lack the flexibility necessary for it to function in a competitive business world, for instance, providing no extra time and space to think and experiment respectively.
Some author gives reason for the lack of success, Hancock and Zayko, (1998) argued that there seem to be lack of understand, direction and commit from managers when lean philosophy is transferred into environments different from is origin. M.P.J. Pepper et al. (2008) suggest that some miss the fundamental building blocks of lean, such as employee empowerment and cultural change, approaching lean in with the wrong goals. Lean requires and relies on these cultural changes to occur because in itself is key to sustainability of lean. Without this we see an adverse
effect on morale, increasing levels of worker unhappiness and withdrawal, ultimately leading to operational failures (Hines et al., 2004).
2.8. Practical Analysis
In this section we’ll look at several case studies from industries such as garment, auto and wood manufacturing, highlighting the implementation of lean in small to medium enterprises (SME), to gain some insight from similar works conducted. The knowledge glean from these cases shared several vital information such as, barriers for implementing lean, be it human or organizational barrier.
Several authors (Golicic and Medland (2007), Pirraglia et al. (2009), Ramune Ciarniene and Milita Vienazindiene (2013) Beitinger (2012)) suggested there is a need for behavior change within the organization, aim at improving workers motivation and participation, which would help reduce the resistance to change from employees and middle management, and improve communication, this behavior changed should be fostered by proper organizational values. Additionally management should have knowledge and knowhow for implement lean to prevent backsliding into pre lean operation state.
Golicic and Medland (2007) said that SME would have limited success in the implementing of lean: if they don’t have influence over supplier and customer behavior change. Suggesting 5 proposition concerning supplier, customer and internal influence, which would affect the result or ineffectiveness of implementing lean 1) Supplier behavior change is positively related to lean implementation success of SME. 2) Power of the supplier is negatively related to behavior changes of suppliers, similarly for customer demand and finally 5) Internal behavior changes are positively related to lean implementation success of SME.
Finally some organization barrier that can limit lean are hierarchy and cultural issues, high cost of implementation and lack of resources, weak link between improvement programs and strategy and a disconnection between management and shop floor (Marudhamuthu et al.2011). To overcome these barrier there is a need for leadership responsibility, committed management support, resource committed and finance, these should form the building blocks for lean implementation. Some of the lean tools utilized or implement within these case studies are; Value Stream Mapping (VSM), Single Minute Exchange of Die (SMED), Kaizen, 5S, Kanban, Cause and Effect diagram and Why-Why analysis.
3. DOF Operations
In this section DOF operations would be detailed, we’ll explore its product range, the size of operation based on sales, its facility and equipment capacity, both its production lines and the human resource capital.
3.1. DOF Products
Dinis de Oliveira & Filhos, as the introduction indicates currently focus their operation activity on the production of CortiPAN, CortROLL and CorkGRAN, these however are grouped into two main product category as the product tree in figure 2 shows;
A description of each grouping is given below.
Agglomerate section incorporates two products;
o CortiPAN – this is produce with a standard length and width dimension of 100*50 cm and a varying thickness from 10mm up 60mm, increasing in increments of 10mm and finishing which can be either 50% or 100%. 50% finishing means only one side of the CortiPAN plate is polish and 100% both sides of the plate are polish. o CortROLL– varies in thickness from 2mm to 8mm, this product isn’t however
produced at DOF, they supply the granules need for the production of the rolls but the actual manufacturing of the CortROLLis outsource to DOF business associates. CorkGRAN includes three product streams;
o Crushed cork – is internally referred to as Broken (hereafter refer also), and has specification range from 2mm to 14mm. This range is subdivided into two groups which are 2mm to 10mm (which can be referred to as fine broken) and the other is from 2mm to 14mm just broken.
o Compressed granules (Bales) – these grains are compressed and transformed into bales of 60kg for shipping internationally. The grains used in this product are 2|3 and 3|7 mm granules.
o Uncompressed granules (Lose grains) – these grains usually range in size from 0.5 to 4mm and is sold in the local market to the customer
However besides these main products, everything that exist DOF production process are sold, i.e. cork bark or poor cork, powder cork, etc. However during this study we’ll only be focusing on DOF main products.
The raw material used in the manufacturing process is sourced from the waste products of other companies within the Cork Industry, such material as; apara desp. crowded, burnt chip, cork burnt (for CortiPAN), flour cork, bit of cork and yellow cork (for granules), Table 38 and figure 18 & 17 annex B, shows details about the raw material used.
To have an idea of the size of the operation, the table 4 shows the 2012 sales narrative for the main products sold by DOF.
Table 4 Sales quantities for 2012
Product Units 2012 Quantity € Agglomerate m2 38837 212748.07 Broken kg 927723 16102.44 Granules kg 1379122 1457488.55 Total 1686339.06
3.2. Facility and Equipment
DOF facility is located in Mozelos on a plot of land covering an estimated area 6101 m2. The facility consists of four main sections, the administrative building, raw material storage area, manufacturing section and warehouse. The current layout is shown in the figure 18 annex B of the report, table 5 gives a brief idea of the size of these section.
Table 5 Showing any estimate square meter allocation of DOF main buildings
Section Area (m2)
Administrative A Office 70
Manufacturing A Grain Processing Area 392
B Separation 360
C Compression/WIP/
Dehumidification
1060
E CortiPAN MC 546
Warehouse F FG material storage 1034
Raw Material D1 Broken Storage 132
D2 Raw for CortiPAN and Granulation storage
525
Total 4119
Miscellaneous 1982
DOF is characterized as an SME, having an assortment of equipment at their disposal; however because the company is old and some of the equipment they used in their manufacturing were
actually fabricated by the company, and it’s difficult to determine the operating capacity, it’s just left up to estimation to have an idea of the capacity. In the below table we aim and present a catalog of the machines available in the company and estimating the usability and productivity where possible.
Table 6 Illustrating the equipment and machine catalog of DOF
ID N0 Section Machine Description Quantity
General Fork lift 4
Tractor 1
3ton truck 2
Material Transportation Truck 1
Granulation Dehumidifier 1
Press 1
Density tables 2
Grain processing line 2
Mills 6
CortiPAN Oven & Mixer 2
Cooling duct and Cutter 1
Polisher 1
Packaging (small parcel and pallet) 1
3.3. Production Process
DOF offer main three product’s family as the product tree illustrated in figure 2, however despite offering three products the company operates two production lines, with the initial stages of both performing very similar activities, as a result there exist 100% flexibility between these lines with either line have the ability to produce which ever product needed. Below describe the two production lines,
Production 1 as illustrated in the figure 3 below is for processing of the Granules needed for both the CG (bales) and the UCG (lose grains sold locally). The diagram shows a detail picture of the process, including information such as each activity individual cycle time2 in minutes. .
To better explain the process diagram we’ll divide it up into three main sections, corresponding to areas where the materials are being physically moved.
Section one – this covers everything from the beginning (sifting) to the package and label activity; raw material is feed into process where it is transformed, reducing its size 0.5 to 7mm. This is accomplish by passing the cork through a two stage grinding process reducing the cork to 10mm with a separation step in between, to remove unwanted cork bark. After the cork enters the cylindrical dryer to reduce it moisture content, exiting the dryer the cork enters a silo which acts as a buffer. Then onto the final milling stage reducing the gain size to the required dimension of 0.5 to 7 mm, anything at exceeds the 7mm size is recycled back through the process. Finally this section concludes with the product being filled into bags of 27kgs, packaged and labeled, specifying the grain size according to the product tree.
Section two – here the package grains are placed on pallets (according to their size) for transportation to the dehumidifier via a fork lift.Once at the dehumidifier the pallet is off load, unpackaged and empty into a dehumidifier (6bags at a time), to further reduce its moisture content to 5-6%. After dehumidification the grains are placed into BB which are equivalent to 162kg, and transported to WIP inventory.
Section three – this third section the process diverge grains placed in the WIP inventory would either being used for:
o Compression (grain size 3|7 and 2|3) and o Repackage into the 27kgs (0.5|1, 0.5|2, 1|3, etc.)
NB: section 2 (dehumidification activity) is weather and seasonal dependent, i.e. it is more used during the winter season and less used during the summer.
Production line 2 is for the manufacturing of the CortiPAN and Broken product (with the Broken being completed end of the 1st section), however if you’ll look closely the initial stages of the production process is exactly the same, as that for the granules described above.
This diagram also illustrates the cycle time at each activity in minutes Similar to the approach used in the description of production 1 would be applied here:
Section one – this area encompasses all activities from the start of the process to the second inventory icon (show above by the red dot.) In this section of the process, raw material (cork waste) is transform by passing it through two grinding/milling stages, separation, the dryer to reduce the moisture content of the cork, and then clean, to remove any remaining unwanted segment of the cork bark, reducing its size to a range of 2 to 18mm, which is then pack into BB according the size variation (check product tree) and stored as WIP. Section two – involve the manufacturing of the CortiPAN product, beginning at the WIP
inventory and ending at Polish and Label activity. The broken cork taken from the WIP inventory area is transformed into the CortiPAN, the broken cork is first mix with adhesive and then bake in an oven (the baking time is proportional to the thickness of the CortiPAN, refer to table 40 annex B for more detail).After which the bake CortiPAN board is cool in an air duct with natural air, then cut into pieces (1*0.5m), temporary stack to build batches before being polished, labelled and stack onto pallets.
Section three – the pallets built at the end of section two are moved to the warehouse for stabilizing, this activity is critical to ensure the quality of the product before final packaging which occurs in the CortiPAN manufacturing cell (MC). There after stabilizing the CortiPAN is move back to the MC for final package and then back to the warehouse for storage as finish goods (FG).
3.4. Human Resources Analysis
DOF employees a total of 21 employees, with a mixed work force including both genders, with female accounting for 33% of the workforce and men 67%. The average age of DOF human captial (HC) is 45 years with 67% of all employees above this average age. The 21 employees are disperse between the office, manufacturing and security activities, with the office utilizing 20% of the HC and the manufacturing process 76% and security the remaining 4%. The 76% HC used by manufacturing is shared between three categories of work; granulation, cortipn and maintainence. Granulation (CG+UCG) utilizes 40%, CortiPAN 32% (plus broken) and the remain 4% is utilized for maintenence. Finally DOF records shows that 62% of the HC can be consider as unskill or semi skilled workers. Futher detail of DOF Human Resource analysis can be seen in table 39annex B.
4. Analysis and Problem Definition
In this section we’ll present the analysis conducted and the findings obtained. This analysis covers several areas such as: the operation, value stream, productivity, sales analysis and supplier analysis. At the end of the section we’ll scope and describe the problem which we believe is being faced by DOF operation. To begin we’ll start with the VSM tools.
4.1. VSM Tools
To examine DOF operation, we’ll utilized three value stream mapping tools which are: Value Stream Mapping (VSM), Process activity mapping (PAM) and Demand amplification. VSM was introduce in the literature review as a method to map the material and information flow within an organization, both other tools were mentioned additionalmapping tool.
The results obtained from the PAM analysis are presented in table 7. This results shows a very high total time recorded for CortiPAN, which was attributed mainly to the large stocks of FG in the WH awaiting shipment, for in excess of 5months. Despite the long waiting time, the VA for CortiPAN was highest of all products at 8%, this is a result of one activity within CortiPAN production process stabilization; which requires three (3) full day to be completed, an equivalent of 4320 min, which represents 98.42% of the total VA time. Since stabilization is viewed as a needed activity to ensure product quality3 it was included as an operational activity. However if
this wasn’t the case, the actual VA % would be 0.12%. Another point to note is: the CortiPAN has a total distance travelled, recorded as 722m (for every pallet FG shipped) representing the largest number in the group of products.
Table 7 showing the result from the Process Activity Mapping
Product # of Ste ps # Operation steps Total distance travel (m) Total Time (min) Operation time (min) % VA # of person Operator CortiPAN 28 17 722 57384.57 4389.37 8 21 2 CG 32 16 266.5 5425.16 57.41 1.06 27 1 UCG 29 15 207.5 2766.11 52.56 1.79 21 1
UCG showed the high total time 2766.11 relative to its operation time, recording VA at 1.79%; similar results was observed for CG showing a high total time of 5316.16min and a comparatively low VA at 1.06% being the lowest of all the products.
All results from the PAM showed that for the majority of time products are with DOF internal supply chain no value is being added, as we see the extremely low operating time to total processing time for all products. Additional many delay points along each product flow was identify as pools of WIP and FG inventory, in all cases the time delay at these pools exceeded the total operating time. A full list showing at the steps/activities for each product is shown in annex C, table 41 to 43.
3 Production Manager stated