1
State interventions to rescue banks during the global financial crisis
José Filipe Abreu*
European Central Bank
Marta Guerra Alves
European Central Bank
Mohamed Azzim Gulamhussen
ISCTE-IUL Instituto Universitário de Lisboa
Abstract
We model unique state interventions to rescue commercial banks during the 2008-09 global financial crisis with the complementary binary logistic models that accommodate their skewed distribution. Our findings show that large and illiquid banks, and banks from countries with weak regulations, and weak shareholder and creditor rights are more likely to receive state intervention. These findings remain robust to a restricted definition of state intervention, alternative measures of bank fundamentals, placebo estimations, counterfactual sampling with propensity scores, and bank and country sample splits. These bank and incremental country level predictors can help regulators and supervisors limit future state interventions.
Keywords: Financial crisis; Banks; Government support JEL Classification: G01, G21, H81
The authors thank the Editor Prof. Carl Chen and two anonymous reviewers for their detailed comments and suggestions. The views expressed in this paper are those of the authors and do not necessarily represent the views of the institutions with which they are affiliated. The authors acknowledge financial support from the FCT (UID/GES/00315/2013; PTDC/IIM-FIN/7188/2014), and administrative and research support from the ISCTE-IUL. Corresponding author: José Filipe Abreu, Economist. European Central Bank, Kaiserstrasse 29. 60311 Frankfurt am Main. Phone +49 69 1344 4678. Email: [email protected].
2
State interventions to rescue banks during the global financial crisis 1. Introduction
During the 2008-09 global financial crisis (henceforth, financial crisis), many banks received state interventions. At the time, monetary and financial authorities were particularly concerned about the disruptions in the functioning of markets and their consequences for economic growth, as observed during the great depression. Moreover, political authorities became extremely sensitive to the public outcry caused by the fact that the support given to banks was funded by taxpayers and not by debt and shareholders. This unique context can be used to identify the predictors of state interventions, thus furthering our understanding of the causes and consequences of the global financial crisis (Abreu and Gulamhussen, 2013b) and informing post-crisis debates and reforms (Clare et al., 2016).
Studies on state interventions to rescue banks during the financial crisis focus most notably on the troubled asset relief program (TARP) in the United States (U.S.) (Bayazitova and Shivdasani, 2012; Blinder and Zandi, 2010; Ncube, 2016; Taylor, 2009). We add to these studies by focusing on Europe where country differences and the distinct bank fundamentals resulting from its bank-dominated infrastructure provide a unique setting to understand the predictors of state interventions during the financial crisis.1
We assemble a unique sample of 633 European commercial banks (henceforth, banks), 42 of which received state interventions during 2008 and 2009. In order to accommodate the skewed
1 Our research is also related to previous studies that identify early warning signals of failure/distress in different
countries and regions (Kumar and Ravi, 2007). We make two contributions to this literature. First, we extend previous studies that identify early warning signals for economic, strategic, legal and regulatory failure/distress by focusing on state interventions. Second, we advance previous studies that look mainly into Asia (Bongini et al., 2001; Arena, 2008), Latin America (Arena, 2008), Norway (Clare and Priestley, 2002) and the U.S. (Martin, 1977; Whalen and Thomson, 1988; Thomson, 1991; Hwang et al. 1997; DeYoung, 2003; Shaffer, 2012; DeYoung and Torna, 2013) by focusing on Europe (see also Poghoshyan and Cihak, 2011).
3
distribution of state interventions, we deploy the complementary binary logistic model known as the clog-log and the standard binary logistic model.2 Our findings show the bank and incremental country level predictors of state interventions. Large and illiquid banks, and banks from countries with low regulatory restrictions on bank activity, protection to shareholders and creditors, government spending, and independence of supervision are more likely to have received state interventions. These predictors remain robust to a number of tests that encompass state interventions restricted to recapitalizations; alternative measures of bank fundamentals, placebo year estimations, and counterfactual sampling with propensity matching scores. These findings can help regulators and supervisors to detect banks that may require state interventions.
We describe our data, variables, statistics and the method in Section 2, report the findings in Section 3, and conclude with an assessment of policy implications in Section 4.
2. Data, variables, descriptive statistics and method 2.1. Sample
We collected data on state interventions to rescue banks from the European Commission (E.C.).3 Our data include information on bank fundamentals from Bankscope (Bureau Van Dijk); and country characteristics from several sources: on regulation and supervision from Barth et al (2013),
2 The related literature on failures/distress use mainly binary classification models to predict failure/distress (Asia:
Bongini et al., 2001; Arena, 2008; Latin America: Arena, 2008; Norway: Clare and Priestley, 2002; United States (U.S.): Martin, 1977; Whalen and Thomson, 1988; Thomson, 1991; Hwang et al. 1997; Shaffer, 2012; DeYoung and Torna, 2013); and proportional hazards models to predict the time to failure/distress (Asia and Latin America: Arena, 2008; U.S.: DeYoung, 2003). Lee and Urrutia (1996) show that binary classification and proportional hazard models lead to similar findings and interpretations. Few studies use other methods, namely multivariate discriminant analysis (Turkey: Canbas et al. 2005), data envelopment analysis (U.S.: Barr et al., 1994), neural networks (U.S.: Alam et al., 2000; Bell, 1997; Tam and Kiang, 1992), and multiple-criteria decision making (Spain: Olmeda and Fernandez, 1997) to classify failed/distressed and nonfailed/nondistressed banks. We also contribute to the literature by deploying this model clog-log.
3 The Directorate General of Competition (http://ec.europa.eu/competition/elojade/isef/index.cfm) discloses the
4
on shareholder rights from Djankov et al. (2007), on creditor rights from Shleifer et al. (2008) and on government spending from Eurostat4.
We compiled data on state interventions during the 2008-09 financial crisis. We collected data on bank fundamentals from Bankscope by selecting “commercial banks” to ensure a homogeneous sample of European banks. A careful qualitative evaluation of the data and the exclusion of banks with missing data resulted in the compilation of our sample of 633 commercial banks; 42 of these banks in 13 European countries received state interventions. We summarize this compilation at the country level in Table 1 and at the bank level in Table 2.
2.2 Variables State interventions
The dependent variable in our analysis is labeled STATE INTERVENTION. This is a binary variable that takes the value of 1 if the bank received state intervention during the financial crisis 2008-09 and 0 otherwise.
Bank fundamentals
Our data on bank fundamentals include solvability, asset quality, earnings, liquidity, and size variables from Bankscope (see also Arena, 2008; Shaffer, 2012; Poghoshyan and Cihak, 2011; Ncube, 2016)5. We use EQUITY TO TOTAL ASSETS, i.e. the extent to which assets are financed
by equity, as a measure of solvability. The equity provided to banks by shareholders indicates the strength of the balance sheet. Higher values of equity indicate greater capacity to withstand losses and are therefore negatively related with state interventions. We use LOAN LOSS PROVISIONS
4 Eurostat (http://ec.europa.eu/eurostat/web/products-datasets/-tec00023/) discloses macroeconomic information on
member countries.
5 These studies use different combinations and measures of these indicators to predict economic, strategic and legal
failures (Arena, 2008); regulatory failures (Shaffer, 2012); distress (Poghoshyan and Cihak, 2011); and TARP interventions (Ncube, 2016).
5
to net interest income, i.e. the extent to which banks created reserves to withstand losses arising from problematic loans, as a measure of the quality of assets. Provisions for loan losses indicate the cushion that banks possess to withstand loan impairment. Higher values of this ratio indicate greater effort to withstand losses and are therefore positively related with state interventions. We use the RETURN ON ASSETS as a measure of earnings. Higher values of this ratio indicate the resilience of banks to absorb losses and are therefore negatively related with state interventions. We use the INTERBANK RATIO, i.e. the ratio of the amount of loans provided to the interbank market to the loans received from the interbank market as a measure of liquidity possessed by banks to withstand unexpected withdrawals of deposits during crisis situations. Higher values of this ratio indicate the liquidity possessed by banks and are therefore negatively related with state interventions. 6
We assess the robustness of the findings based on the above fundamentals by using the TOTAL CAPITAL RATIO, i.e. the ratio of total regulatory capital to risk-weighted assets, as an alternative to EQUITY TO TOTAL ASSETS; IMPAIRED TO TOTAL LOANS, i.e. the ratio of impaired loans to total loans, as an alternative to LOAN LOSS PROVISIONS; RETURN ON EQUITY, i.e. the ratio of earnings to book value of equity, as an alternative to RETURN ON ASSETS; and LIQUID ASSETS TO DEPOSITS AND SHORT-TERM FUNDING, i.e. the ratio of the value of liquid assets (easily convertible to cash) to short-term funding (including deposits), as an alternative to the INTERBANK RATIO.
While large banks have more resources to withstand losses, they also take more risks with the aim of becoming large in the assurance that states will support them in crisis situations (Abreu and
6 Shaffer (2012) uses the ratio of jumbo certificates to assets as a measure of liquidity, whereas Ötker-Robe and Podpiera
(2010) use the ratio of loans to deposits, wholesale funding to total liabilities, short-term borrowing to total liabilities and liquid assets to total assets as alternative measures of liquidity. We use the interbank ratio and the liquid assets to deposits and short-term funding.
6
Gulamhussen, 2013a; Jiaqing et al., 2017). Bank SIZE defined as the logarithm of total assets is therefore positively related with state interventions.
Country characteristics
Our data on country characteristics address regulatory restrictions, capital stringency, and supervisory independence from Barth et al. (2013); shareholder rights from Djankov et al. (2007) and creditor rights from Shleifer et al. (2008); and government spending from EUROSTAT. REGULATORY RESTRICTIONS measure the overall limits on activities conducted by banks based on the extent to which they can engage in underwriting, brokering and dealing in securities and mutual funds; insurance underwriting and distribution; and in real estate investment, development and management. Higher values of this variable indicate a financial sector with more restrictions on banking activities and are therefore negatively related with state interventions.7 The CAPITAL REQUIREMENT INDEX measures the strictness of the measurement of capital based on appropriate consideration of risk and potential losses from financial transactions, and the availability of recapitalization buffers. Higher values of this variable indicate greater strictness in the determination of minimum capital that banks are required to hold and are therefore negatively related with state interventions. INDEPENDENCE OF SUPERVISON measures the independence of supervision based on the degree to which it is immune to political influence and is protected by the legal system. Higher values of this variable indicate greater independence of national supervisory entities in identifying weak banks and imposing remedial measures, and are therefore positively related with state interventions.
7 DeYoung and Torna (2013) show that bank failures in the U.S. declined due to fee-based activities (securities
brokerage and insurance sales) and increased due to asset-based activities (venture capital, investment banking and asset securitization).
7
SHAREHOLDER RIGHTS measure the protection provided to shareholders based on the ease of voting by mail, the need to prove the right to vote, the existence of cumulative voting rules, the protection of oppressed minorities, the pre-emptive rights to buy new issues of stock and the level of equity required to call a shareholders’ meeting. CREDITOR RIGHTS measure the protection provided to creditors based on the ease with which debtors can file for reorganization, creditors are able to seize assets, secured creditors are paid first from the proceeds of liquidation, and management can retain administration pending the resolution of the reorganization. Increases in these variables raise the potential for outside monitoring and enforcement and are therefore negatively related with state interventions. GOVERNMENT SPENDING is the ratio of spending by the state to its gross domestic product. Low values of this ratio indicate room to accommodate spending in crisis situations and are therefore negatively related to state interventions.
2.3 Descriptive statistics
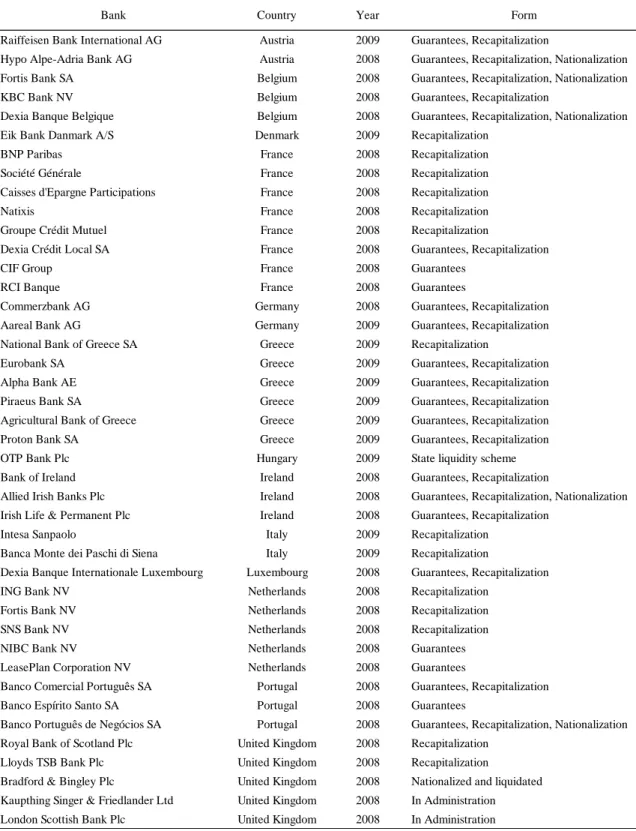
We describe our data in Tables 1-4. Table 1 sets out our data on the number of banks and state interventions by country. It identifies the 13 countries from which the banks under scrutiny originate and the 42 state interventions which represent 7% of the total number of banks in our sample. Table 2 lists the banks that received state interventions, i.e. the 7% of banks identified in Table 1. It identifies the banks, the country of origin, the year in which they received state interventions, and the type of state intervention.
In Table 3, we set out the variables and their descriptive statistics (average, standard deviation, minimum and maximum) and the nonparametric test (t-test and significance) for the differences between banks that received state interventions and banks that did not. Our dependent variable STATE INTERVENTION shows a mean of 7% identical to the figure reported in Table 1. For our independent variables, we focus on statistically significant differences between banks that received state interventions and banks that did not. In terms of fundamentals, we find statistically meaningful
8
differences in the EQUITY TO TOTAL ASSETS, in the INTERBANK RATIO and in BANK SIZE. Banks that received state interventions had lower equity, were more reliant on the interbank market for funding, and were larger in size compared to banks that did not receive state interventions. In terms of country characteristics, we find a statistically meaningful difference in the CREDITOR RIGHTS. Banks headquartered in countries with lower creditor rights were more likely to receive state interventions. In Table 4, we present the pairwise correlations of the variables. As can be observed, the significant correlations are not large enough to cause concerns with respect to their linear dependence.
2.4 Method
We model state interventions as a function of bank fundamentals and country characteristics. We estimate this relation with the clog-log using robust standard errors clustered at the country level and assess the presence of heteroscedasticity with the Lagrange Multiplier test (Lee and Urrutia. 1996; Greene, 2017). In the estimation of the baseline model, we consider state interventions at the peak of the financial crisis in 2008 and 2009, and bank fundamentals and country characteristics in 2007. In robustness tests, we consider 2006 as the placebo year, in other words, we assume that state interventions were dictated by bank fundamentals and country characteristics in 2006. The lagged variables avoid the reverse bias in the estimation of the model. Other robustness tests include restricted definition of state interventions, alternative definitions of bank fundamentals, counterfactual sample matching with propensity scores, bank and country sample splits, and the standard binary logistic model. We detail these robustness tests in the next section.
3. Findings
Tables 5-12 report our findings, more specifically, the maximum likelihood coefficients, robust standard errors in parenthesis, odds ratios and the statistical significance for all bank fundamentals and country characteristics. These Tables also report the log-likelihood for each model, the
9
likelihood ratio test that compares the model estimated with bank fundamentals and country characteristics with the model estimated with only bank fundamentals, the chi-square test of Wald, and the number of observations.
3.1 Baseline
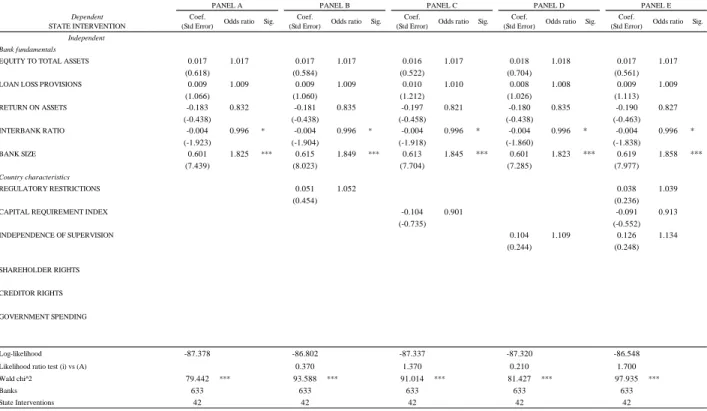
We report the findings for the baseline in Tables 5.1(Panels A-E) - 5.2 (Panels F-J). We first estimate the model with only bank fundamentals and report the findings in Panel A. We then estimate the model in Panel A adding country characteristics one by one and report these in Panels B to H to assess their incremental predictive ability vis-à-vis the model estimated in Panel A.
We discuss the findings of the full model reported in Table J. For bank fundamentals, INTERBANK RATIO is negatively and significantly related with state intervention at the 5% level of confidence; and SIZE is positively and significantly related with state intervention at the 1% level of confidence. For country characteristics, REGULATORY RESTRICTIONS, and SHAREHOLDER and CREDITOR RIGHTS are negatively and significantly related with state interventions all at the 1% level of confidence. The log-likelihood ratios test rejects the null that the distributions of models estimated in Panels A and J are similar at the 1% level of confidence, indicating the incremental predictive ability of the model with bank fundamentals and country characteristics vis-à-vis the model with only bank fundamentals.
The bank-level findings indicate that large and illiquid banks are more likely to have received state intervention. The finding on liquidity is in line with the belief that the breakdown of trust in the functioning of interbank markets inhibited banks from tapping into immediate funding in these markets. The finding on size is in line with the too big to fail supposition in which large banks anticipated state support as the economic and political consequences of their collapse would ultimately be greater. These findings substantiate the heightened liquidity requirements imposed by regulators in the aftermath of the global financial crisis. The incremental country-level findings
10
indicate that banks from countries that allow engagement in multiple activities, or provide weak protection to shareholders and creditors, are more likely to have received state intervention. Country-level structural reforms in these areas are likely to reduce future state interventions in banks.
3.2 Restricted definition of state interventions
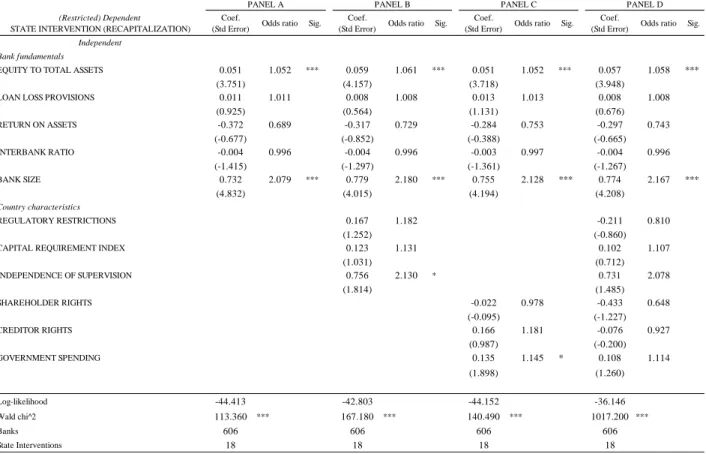
The state interventions we study in this paper involved recapitalization and provision of guarantees. To assess the sensitivity of our findings to the type of state intervention, we re-estimated our model limiting state interventions to recapitalizations. We report the findings in Table 6. We first estimate the model with only bank fundamentals and report the findings in Panel A. We then estimate the model in Panel A adding groups of country characteristics in Panels B and C, and the full set of country characteristics in Panel D to assess their incremental predictive ability vis-à-vis the model estimated in Panel A. As can be observed in Panel D, EQUITY TO TOTAL ASSETS and SIZE are positively and significantly related to state intervention at the 1% level of significance. The log-likelihood ratio test rejects the null that the distributions of models estimated in Panels A and D, are similar at the 1% level of confidence, indicating the incremental predictive ability of the model with bank fundamentals and country characteristics vis-à-vis the model with only bank fundamentals.
The bank-level findings indicate that large and better equity cushioned banks are more likely to have received state intervention. The finding on size is in line with the baseline. The finding on equity indicates that states preferred to recapitalize banks whose shareholders had plowed in sufficient equity. The country-level predictors are not significant at the conventional levels but add information to the model based on only bank fundamentals.
11
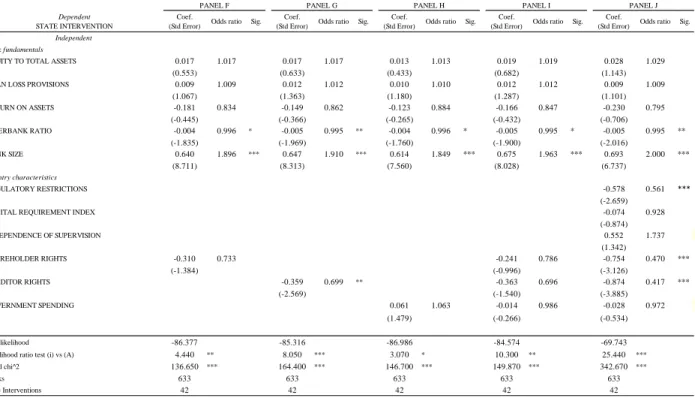
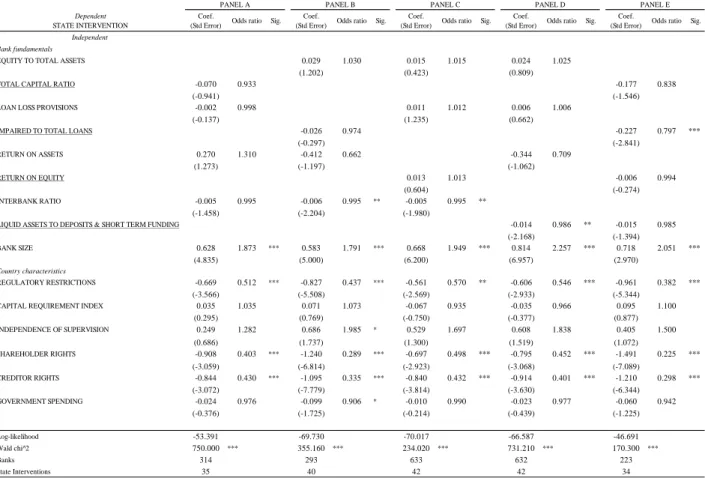
To assess the sensitivity of our findings to the measures of bank fundamentals, we re-estimated our model substituting EQUITY TO TOTAL ASSETS with the TOTAL CAPITAL RATIO, LOAN LOSS PROVISIONS to total assets with IMPARED TO TOTAL LOANS, RETURN ON ASSETS with RETURN ON EQUITY, and the INTERBANK RATIO with the ratio of LIQUID ASSETS TO DEPOSITS AND SHORT-TERM FUNDING. We report the findings with these alternative measures of bank fundamentals in Table 7. This Table reports the estimations of the full model with bank fundamentals and country characteristics, substituting the measures of bank fundamentals used in the baseline estimation in Tables 5.1-5.2 with the alternative measures. Panel A reports the findings for the TOTAL CAPITAL RATIO, Panel B for IMPAIRED TO TOTAL LOANS, Panel C for the RETURN ON EQUITY, Panel D for the ratio of LIQUID ASSETS TO DEPOSITS AND SHORT-TERM FUNDING, and Panel E for all the alternative measures together. For bank fundamentals, INTERBANK RATIO in Panels B and C, LIQUID ASSETS TO DEPOSITS AND SHORT-TERM FUNDING in Panel D and IMPAIRED TO TOTAL LOANS in Panel E are negatively related with state intervention at the 5% and 1% levels of confidence. In Panels A-E, SIZE is positively and significantly related with state intervention at the 1% level of confidence. For country characteristics, REGULATORY RESTRICTIONS and SHAREHOLDER and CREDITOR RIGHTS are significantly related with state intervention. These findings are in line with the baseline estimations reported in Tables 5.1-5.2. The log-likelihood ratio test rejects the null that the distributions of models estimated in Panels A and D are similar at the 1% level of confidence, indicating the incremental predictive ability of the model with bank fundamentals and country characteristics vis-à-vis the model with only bank fundamentals.
The bank-level findings indicate that large and, in general, illiquid banks are more likely to have received state intervention. The relation between impaired to total loans is unexpected. An explanation could be that state intervention was directed towards large and illiquid banks but with
12
better quality assets. The incremental country-level findings indicate that banks from countries that allow engagement in multiple activities, or provide weak protection to shareholders and creditors are more likely to have received state intervention. These findings are in line with the findings in the baseline.
3.4 Placebo estimations
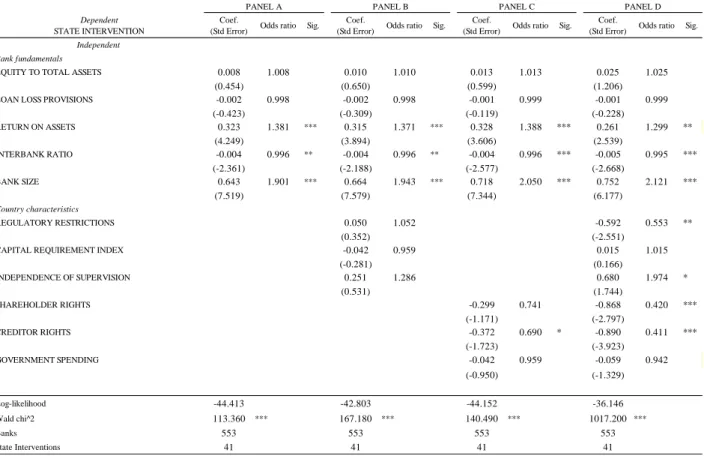
To assess the sensitivity of our findings to the year in which we measure bank fundamentals, we re-estimated the baseline with bank fundamentals and country characteristics considering the end of 2006 as the placebo year. We report the findings with these alternative lagged variables in Table 8. In this Table, we report the estimations of the model with bank fundamentals in Panel A, adding groups of country characteristics in Panels B and C, and the full set of country characteristics in Panel D. In Panel D, for bank fundamentals, the findings indicate a negative and significant relation between the INTERBANK RATIO and state intervention at the 1% level of confidence; and positive and significant relations between SIZE and RETURN ON ASSETS and state intervention at the 1% and 5% levels of confidence; for country characteristics, the findings indicate negative and significant relations between REGULATORY RESTRICTIONS, at the 5% level of confidence, and SHAREHOLDER and CREDITOR RIGHTS and state interventions both at the 1% level of confidence, and positive and significant relations between INDEPENDENCE OF SUPERVISION and state interventions at the 10% level of significance. The log-likelihood ratio test rejects the null that the distributions of models estimated in Panels A and D are similar at the 1% level of confidence, indicating the incremental predictive ability of the model with bank fundamentals and country characteristics vis-à-vis the model with only bank fundamentals.
The bank-level and incremental country-level findings are in line with the baseline. In addition, they indicate that profitable banks, and banks from countries with independence of supervision are
13
more likely to have received state intervention. The finding on profitability points towards preference for state intervention in banks that were already economically viable.
3.5 Counterfactual analysis
To assess the average influence of state interventions on banks that accepted support, we construct a counterfactual group of banks that did not accept support based on their observable differences to banks that received state interventions with propensity matching scores (see also Ncube, 2016). We report the finds of estimations after constructing the counterfactual group of banks in Table 9. Panel A of this Table presents the estimations of the model with bank fundamentals, and Panel D shows estimations with bank fundamentals and all country characteristics. In Panel D, for bank fundamentals, the findings indicate a negative and significant relation between the INTERBANK RATIO and state intervention at the 10% level of confidence; and positive and significant relations between SIZE and state intervention at the 1% level of confidence; for country characteristics, the findings indicate negative and significant relations between REGULATORY RESTRICTIONS and SHAREHOLDER and CREDITOR RIGHTS and state interventions all at the 1% level of confidence, and positive and significant relations between INDEPENDENCE OF SUPERVISION and state interventions at the 10% level of significance. The log-likelihood ratio test rejects the null that the distributions of models estimated in Panels A and D are similar at the 1% level of confidence, indicating the incremental predictive ability of the model with bank fundamentals and country characteristics (Panel D) vis-à-vis the model with only bank fundamentals (Panel A).
The bank-level and incremental country-level findings are in line with the baseline. In addition, the findings indicate that banks from countries with independence of supervision are more likely to have received state intervention.
14
Our baseline model considers the role of both bank fundamentals and country characteristics to explain state interventions. To further assess the sensitivity of our findings, we split our sample by bank size and by country groups. In the case of bank fundamentals, we split our sample into small and large banks based on their median size. In the case of countries, we split our sample into countries more impacted by the financial crisis namely Greece, Ireland, Italy, Portugal and Spain or the “GIIPS” and the “non-GIIPS” based on the market convention.
For the sample split by size, we report the findings in Table 10, Panel A for small banks and Panel B for large banks. In Panel A, for bank fundamentals, the findings indicate a positive and significant relation between EQUITY TO TOTAL ASSETS and state interventions at the 10% level of confidence; for country characteristics, the findings indicate a positive and significant relations between SHAREHOLDER RIGHTS and GOVERNMENT SPENDING and state interventions both at the 10% level of significance. In Panel B, for bank fundamentals, the findings indicate a negative and significant relation between the INTERBANK RATIO and state intervention at the 10% level of confidence; and a positive and significant relation between SIZE and state intervention at the 1% level of confidence; for country characteristics, the findings indicate negative and significant relations between REGULATORY RESTRICTIONS, and SHAREHOLDER and CREDITOR RIGHTS, and state intervention at the 1% level of confidence and positive and significant relations between INDEPENDENCE OF SUPERVISION and state interventions at the 10% level of significance. The log-likelihood ratio test rejects the null that the distributions of models estimated in Panels A and B are similar at the 1% level of confidence, indicating that state intervention in small banks differed in terms of the equity provided by shareholders and the room in government spending.
In Panel A, bank-level findings indicate that banks whose shareholders had plowed in sufficient equity are more likely to have received state intervention; the incremental country-level findings
15
are in line with the baseline with the exception of creditor rights that is not significantly related to state intervention at a meaningful level and government spending that indicates that banks from countries with higher levels of government spending are more likely to have received state intervention. In Panel B, the bank-level and incremental country-level findings are in line with the baseline. In addition, the findings indicate that banks from countries with independence of supervision are more likely to have received state intervention. The statistical difference between the two panels is justified by the role that size and its implicit too big to fail label played in dictating state interventions.
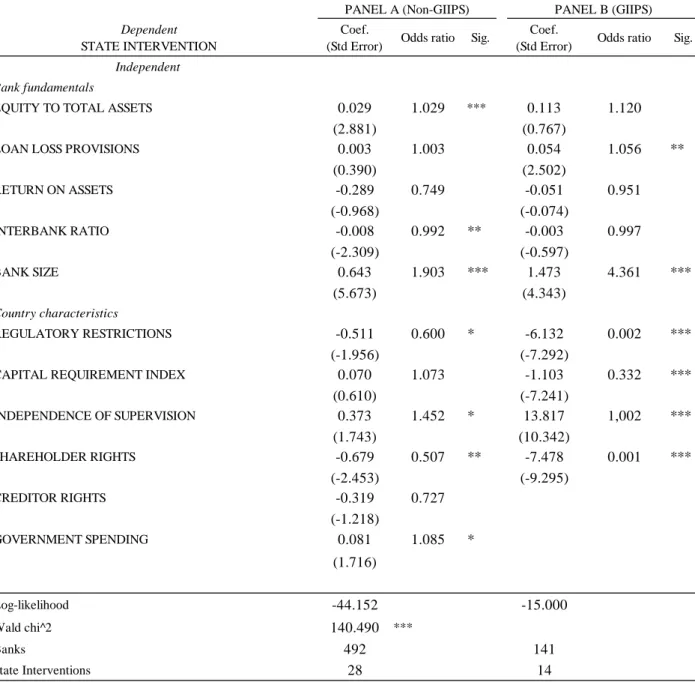
For the sample split by GIIPS and non-GIIPS, we report the findings in Table 11, Panel A for non-GIIPS and Panel B for GIIPS. In Panel A, for bank fundamentals, the findings indicate a negative and significant relation between the INTERBANK RATIO and state intervention at the 5% level of confidence; and positive and significant relations between EQUITY TO TOTAL ASSETS and SIZE and state intervention at the 1% level of confidence; for country characteristics, the findings indicate negative and significant relations between REGULATORY RESTRICTIONS and SHAREHOLDER RIGHTS and state intervention at the 10% and 5% levels of confidence, and positive and significant relations between INDEPENDENCE OF SUPERVISION and GOVERNMENT SPENDING and state intervention both at the 10% level of significance. In Panel B, for bank fundamentals, the findings indicate positive and significant relations between LOAN LOSS PROVISIONS and SIZE and state intervention at the 5% and 1% level of confidence; for country characteristics, the findings indicate negative and significant relations between REGULATORY RESTRICTIONS, CAPITAL REQUIREMENTS INDEX and SHAREHOLDER RIGHTS and state interventions all at the 1% level of confidence, and positive and significant relations between INDEPENDENCE OF SUPERVISION and state interventions at the 1% level of significance.
16
In Panel A (non-GIIPS) the bank-level and incremental country-level findings are in line with the baseline. In addition, the findings indicate that banks whose shareholders plowed in more equity, and banks from countries with independence on supervision and higher levels of government spending are more likely to have received state intervention. In Panel B (GIIPS), bank size and incremental country-level findings are in general in line with the baseline. In addition, the findings indicate banks from countries that require lower levels of capitals and with independence of supervision are more likely to have received state intervention. The statistical differences in the panels are justified by the extent of the fragility of GIIPS that ultimately required bailout from global multilateral agencies.
3.7 Standard logistic model
So far, we deployed the clog-log to model state interventions as a function of bank fundamentals and country characteristics to accommodate the skewed distribution of interventions. In this subsection, to further assess the robustness of our findings we deploy the standard logistic model to estimate the baseline regressions of Tables 5.1-5.2. We report the findings in Table 12. In this Table, we first estimate the model with only bank fundamentals and report the findings in Panel A. We then estimate the model in Panel A adding groups of country characteristics in Panels B and C, and the full set of country characteristics in Panel D, to assess their incremental predictive ability vis-à-vis the model estimated in Panel A. We discuss the findings of the full model reported in Panel D. For bank fundamentals, the findings indicate a negative and significant relation between the INTERBANK RATIO and state intervention at the 5% level of confidence; and a positive and significant relation between SIZE and state intervention at the 1% level of confidence. For country characteristics, the findings indicate negative and significant relations between REGULATORY RESTRICTIONS, and SHAREHOLDER and CREDITOR RIGHTS and state intervention at the 1% level of confidence. The log-likelihood ratio test rejects the null that the distributions of models
17
estimated in Panels A and D are similar at the 1% level of confidence, indicating the incremental predictive ability of the model with bank fundamentals and country characteristics vis-à-vis the model with only bank fundamentals. These findings are fully in line with those estimated with the more appropriate clog-log model.
4. Summary and conclusion
The 2008-09 global financial crisis led to many state interventions to rescue banks so that they could continue performing their activities. There continues to be much debate about these interventions among academics, policy makers and the media, most notably in the context of the TARP in the U.S. We add to this literature by examining Europe where differences in bank fundamentals and country characteristics provide a unique setting to understand the predictors of state interventions during the financial crisis.
We estimate our model of state interventions with the complementary binary logistic model (clog-log) that accommodates the skewed distribution of interventions. Our estimations revealed that large and illiquid banks are more likely to have received interventions. Furthermore, country level features contribute to the prediction of interventions over and above bank fundamentals. Banks from countries with low regulatory restrictions on activities, independence of supervision from the government and the industry, weak protection provided to shareholders and creditors, and low government spending are more likely to have received intervention. These findings remain robust to a number of tests that encompass a definition of state interventions restricted to recapitalizations; alternative measures of bank fundamentals; placebo estimations; counterfactual sampling with propensity matching scores; and bank and country sample splits.
The bank and incremental country level predictors can be used by regulators and supervisors as early warning signals of state intervention. These predictors also contribute to our understanding of the causes of the financial crisis, and inform the debates on post-crisis reforms. The state
18
interventions in illiquid and large banks are consistent with the widely accepted belief that these were dictated by the breakdown of the interbank markets, and by the too big to fail label. The state interventions in banks from countries with frail restrictions on their activities are consistent with the common belief that regulatory pressures on these entities are ineffective. These findings support the alterations in the regulatory and supervisory landscapes in the aftermath of the financial crisis that aim to limit the activities and consequently the size of banks directly or indirectly via the imposition of heightened capital and liquidity requirements. The weaknesses in shareholder and creditor rights are probably the least addressed reforms in the aftermath of the crisis. Reforms in these areas are likely to alleviate future state interventions and the subsequent costs for taxpayers via the development of capital markets where shareholder and creditors themselves will have to maintain sharp oversight of equity and debt provided to banks to avoid losses and haircuts in case of future stressful situations.
19
References
Abreu, J.F., & Gulamhussen, M. A. (2013a). The stock market reaction to the public announcement of a supranational list of too-big-to-fail banks during the financial crisis. Journal of
International Financial Markets, Institutions & Money 25 (1), 49–72.
Abreu, J.F., & Gulamhussen, M. A. (2013b). Dividend payouts: Evidence from U.S. bank holding companies in the context of the financial crisis. Journal of Corporate Finance 22 (1), 54–65. Alam, P., D. Booth, K. Lee, & Thordarson, T. (2000). The use of fuzzy clustering algorithm and self-organizing neural network for identifying potentially failing banks: an experiment study.
Expert Systems with Applications 18 (3), 185–99.
Arena, M. (2008). Bank failures and bank fundamentals: A comparative analysis of Latin America and East Asia during the nineties using bank-level data. Journal of Banking & Finance 32 (2), 299-310.
Barr, R., L. Seiford, & Siems, T. (1994). Forecasting bank failure: a non-parametric frontier estimation approach. Recherches Economiques de Louvain 60 (4), 417–29.
Bayazitova, D. & Shivdasani, A. (2012). Assessing TARP. Review of Financial Studies 25 (2), 377-407.
Blinder, A. S. & Zandi, M. (2010). How the great recession was brought to an end. http://www. Economy.com/mark-zandi/documents/End-of-Great-Recession.pdf.
Barr, R., L. Seiford, & Siems, T. (1994). Forecasting bank failure: a non-parametric frontier estimation approach. Recherches Economiques de Louvain 60 (4), 417–29.
Barth, J., G. Caprio, & Levine, R. (2013). Bank regulation and supervision in 180 countries from 1991 to 2011. Journal of Financial Economic Policy 5(2), 111-219.
20
Bell, T. B. (1997). Neural nets or the logit model? A comparison of each model’s ability to predict commercial bank failures. International Journal of Intelligent Systems in Accounting,
Finance & Management 6 (3), 249–64.
Bongini, P., S. Claessens, & Ferri, G. (2001). The political economy of distress in East Asian Financial Institutions. Journal of Financial Services Research 19 (1), 5-25.
Canbas, S., A. Cabuk, & Kilic, S. B. (2005). Prediction of commercial bank failure multivariate statistical analysis of financial structure: the Turkish case. European Journal of Operations
Research 166 (2), 528–546.
Clare, A., M. Duygun, M. A. Gulamhussen, & Pozzolo, A. F. (2016). Business models, regulation, and the role of financial market participants in the global financial crisis. Journal of Banking
& Finance 72 (S), 1-5.
Clare, A., & Priestley, R. (2002). Calculating the probability of failure of the Norwegian banking sector. Journal of Multinational Financial Management 12 (1), 21-40.
DeYoung, R., & Torna, G. (2013). Nontraditional banking activities and bank failures during the financial crisis. Journal of Financial Intermediation 22 (3), 397-421.
DeYoung, R. (2003.) De novo bank exit. Journal of Money, Credit and Banking 35 (5), 711-28. Djankov, S., Caralee, M., and A. Shleifer. 2007. “Private Credit in 129 Countries.” Journal of
Financial Economics 12 (2): 77-99.
Greene, W. H. (2017). Econometric Analysis, New York, Pearson.
Hwang, D-H., C. F. Lee & Liaw, K. T. (1997). Forecasting bank failures and deposit insurance premium. International Review of Economics & Finance 6 (3), 317-34.
Jiaqing, Z., G. Li, & Li, J. (2017). Merge to be too big to fail: A real option approach. International
21
Kumar, P. R., & Ravi, V. (2007). Bankruptcy prediction in banks and firms via statistical and intelligent techniques–a review. European Journal of Operational Research 180 (1), 1–28. Lee, S. H., & Urrutia, J. L. (1996). Analysis and prediction of insolvency in the property-liability
insurance industry: a comparison of logit and hazard models. The Journal of Risk & Insurance 63 (1), 121–30.
Martin, D. (1977). Early warning of bank failure: a logit regression approach. Journal of Banking
& Finance 1 (3), 249–76.
Ncube, M. (2016). Bank bailout under TARP in the US. Blavatnik School of Government University of Oxford Working Paper 2016/010.
Olmeda, I., & Fernández, E. (1997). Hybrid classifiers for financial multicriteria decision making: the case of bankruptcy prediction. Computational Economics 10 (4), 317–35.
Ötker-Robe, İ., & Podpiera, J. (2010). The fundamental determinants of credit default risk for European large complex financial institutions. IMF Working Paper 10/153, International
Monetary Fund, June 2010.
Poghoshyan, T., & Cihak M. (2011). Determinants of bank distress in Europe. Evidence from a new data set. Journal of Financial Services Research 40 (1), 163–84.
Shleifer, A., S. Djankov, R. LaPorta, & F. Lopez-de-Silanes. (2008). The Law and Economics of Self-Dealing” Journal of Financial Economics 88 (3): 430-465.
Shaffer, S. (2012). Bank failure risk: different now? Economics Letters 116 (3), 613–6.
Tam, K. Y., & Kiang, M. Y. (1992). Managerial applications of neural networks: the case of bank failure predictions. Management Science 38 (7), 926–47.
Taylor, J. B. (2009). How government actions and interventions caused, prolonged, and worsened the financial crisis. Stanford, California: Hoover Institution Press.
22
Thomson, J. B. (1991). Predicting bank failures in the 1980s. Federal Reserve Bank of Cleveland
Economic Review 27 (1), 9-20.
Whalen, G., & Thomson, J. B. (1988). Using financial data to identify changes in bank condition.
23
Table 1. State interventions by country during the 2008-9 global financial crisis
Country Sample State
Intervention % Austria 42 2 5% Belgium 18 3 17% Czech Republic 9 0 0% Denmark 44 1 2% Finland 4 0 0% France 89 8 9% Germany 104 2 2% Greece 14 6 43% Hungary 14 1 7% Ireland 10 3 30% Italy 74 2 3% Luxembourg 48 1 2% Netherlands 16 5 31% Poland 27 0 0% Portugal 18 3 17% Slovakia 11 0 0% Spain 25 0 0% Sweden 9 0 0% United Kingdom 57 5 9% Total 633 42 7%
24
Table 2. State interventions by bank, year and type during the 2008-09 global financial crisis
Bank Country Year Form
Raiffeisen Bank International AG Austria 2009 Guarantees, Recapitalization
Hypo Alpe-Adria Bank AG Austria 2008 Guarantees, Recapitalization, Nationalization Fortis Bank SA Belgium 2008 Guarantees, Recapitalization, Nationalization
KBC Bank NV Belgium 2008 Guarantees, Recapitalization
Dexia Banque Belgique Belgium 2008 Guarantees, Recapitalization, Nationalization
Eik Bank Danmark A/S Denmark 2009 Recapitalization
BNP Paribas France 2008 Recapitalization
Société Générale France 2008 Recapitalization
Caisses d'Epargne Participations France 2008 Recapitalization
Natixis France 2008 Recapitalization
Groupe Crédit Mutuel France 2008 Recapitalization
Dexia Crédit Local SA France 2008 Guarantees, Recapitalization
CIF Group France 2008 Guarantees
RCI Banque France 2008 Guarantees
Commerzbank AG Germany 2008 Guarantees, Recapitalization
Aareal Bank AG Germany 2009 Guarantees, Recapitalization
National Bank of Greece SA Greece 2009 Recapitalization
Eurobank SA Greece 2009 Guarantees, Recapitalization
Alpha Bank AE Greece 2009 Guarantees, Recapitalization
Piraeus Bank SA Greece 2009 Guarantees, Recapitalization
Agricultural Bank of Greece Greece 2009 Guarantees, Recapitalization
Proton Bank SA Greece 2009 Guarantees, Recapitalization
OTP Bank Plc Hungary 2009 State liquidity scheme
Bank of Ireland Ireland 2008 Guarantees, Recapitalization
Allied Irish Banks Plc Ireland 2008 Guarantees, Recapitalization, Nationalization Irish Life & Permanent Plc Ireland 2008 Guarantees, Recapitalization
Intesa Sanpaolo Italy 2009 Recapitalization
Banca Monte dei Paschi di Siena Italy 2009 Recapitalization
Dexia Banque Internationale Luxembourg Luxembourg 2008 Guarantees, Recapitalization
ING Bank NV Netherlands 2008 Recapitalization
Fortis Bank NV Netherlands 2008 Recapitalization
SNS Bank NV Netherlands 2008 Recapitalization
NIBC Bank NV Netherlands 2008 Guarantees
LeasePlan Corporation NV Netherlands 2008 Guarantees
Banco Comercial Português SA Portugal 2008 Guarantees, Recapitalization
Banco Espírito Santo SA Portugal 2008 Guarantees
Banco Português de Negócios SA Portugal 2008 Guarantees, Recapitalization, Nationalization Royal Bank of Scotland Plc United Kingdom 2008 Recapitalization
Lloyds TSB Bank Plc United Kingdom 2008 Recapitalization
Bradford & Bingley Plc United Kingdom 2008 Nationalized and liquidated Kaupthing Singer & Friedlander Ltd United Kingdom 2008 In Administration London Scottish Bank Plc United Kingdom 2008 In Administration
25 Table 3. Descriptive statistics of main variables
STATE INTERVENTIONS is a binary variable where 1 indicates that the bank received state intervention during the 2008-09 financial crisis and 0 otherwise. EQUITY TO TOTAL ASSETS is the ratio of equity to total assets; LOAN LOSS PROVISIONS is the ratio of loan loss provisions to net interest revenue; RETURN ON ASSETS is the ratio of earnings to average assets; INTERBANK RATIO is the ratio of loans extended to the interbank market to loans received from the interbank market; and BANK SIZE is the logarithm of the total assets of the banks. REGULATORY RESTRICTIONS, CAPITAL REQUIREMENT INDEX and INDEPENDENCE OF SUPERVISION are composite indexes that measure the overall restrictions on banking activities, the stringency of capital requirements and the degree to which the supervisory authority is independent from the government and legally protected from the banking industry. SHAREHOLDER RIGHTS is an indicator of the strength of rights provided by rule of law to minority shareholders; CREDITOR RIGHTS is an indicator of the strength of rights granted to creditors in a country; and GOVENMENT SPENDING is the ratio of government expenditure to gross domestic product. ***, ** and * denote significance at the 1%, 5% and 10% levels confidence.
Variable Unit N Mean St. Dev. Min Max Mean if SI=0 Mean if SI=1
Dependent
STATE INTERVENTION (SI) Binary 633 0.066 0.249 0.000 1.000
Independent Bank fundamentals
EQUITY TO TOTAL ASSETS % 633 9.535 9.288 -16.200 91.400 9.828 5.412 2.996 ***
LOAN LOSS PROVISIONS % 633 10.009 44.287 -850.000 250.000 9.579 16.064 -0.917
RETURN ON ASSETS % 633 0.854 1.268 -8.500 12.000 0.872 0.612 1.283
INTERBANK RATIO % 633 143.457 195.570 0.000 999.000 148.793 68.369 2.587 ***
BANK SIZE Number 633 14.984 2.281 8.700 21.400 14.749 18.288 -10.524 ***
Country characteristics
REGULATORY RESTRICTIONS Multinomial 633 6.316 1.761 3.000 9.000 6.342 5.952 1.386
CAPITAL REQUIREMENT INDEX Multinomial 633 6.102 1.891 3.000 10.000 6.110 5.995 0.379
INDEPENDENCE OF SUPERVISION Multinomial 633 1.964 0.671 1.000 3.000 1.956 2.071 -1.078
SHAREHOLDER RIGHTS Multinomial 633 3.197 1.009 2.000 5.000 3.200 3.167 0.205
CREDITOR RIGHTS Multinomial 633 2.087 1.187 0.000 4.000 2.108 1.786 1.705 *
GOVERNMENT SPENDING % 633 45.118 4.725 35.900 52.200 45.079 45.674 -0.788
26 Table 4. Pairwise correlations of variables
STATE INTERVENTION is a binary variable where 1 indicates that the bank received state intervention during the 2008-09 financial crisis and 0 otherwise. EQUITY TO TOTAL ASSETS is the ratio of equity to total assets; LOAN LOSS PROVISIONS is the ratio of loan loss provisions to net interest revenue; RETURN ON ASSETS is the ratio of earnings to average assets; INTERBANK RATIO is the ratio of loans extended to the interbank market to loans received from the interbank market; and BANK SIZE is the logarithm of the total assets of the banks. REGULATORY RESTRICTIONS, CAPITAL REQUIREMENT INDEX and INDEPENDENCE OF SUPERVISION are composite indexes that measure the overall restrictions on banking activities, the stringency of capital requirements and the degree to which the supervisory authority is independent from the government and legally protected from the banking industry. SHAREHOLDER RIGHTS is an indicator of the strength of rights provided by rule of law to minority shareholders; CREDITOR RIGHTS is an indicator of the strength of rights granted to creditors in a country; and GOVENMENT SPENDING is the ratio of government expenditure to gross domestic product. * denotes significance at the 1% level confidence (2-tailed).
(1) (2) (3) (4) (5) (6) (7) (8) (9) (10) (11) (12)
Dependent
STATE INTERVENTION (SI) (1) 1.000
Independent Bank fundamentals
EQUITY TO TOTAL ASSETS (2) -0.1184* 1.000 LOAN LOSS PROVISIONS (3) 0.037 -0.008 1.000 RETURN ON ASSETS (4) -0.051 0.2838* -0.079 1.000 INTERBANK RATIO (5) -0.1024* 0.006 -0.016 -0.015 1.000 BANK SIZE (6) 0.3864* -0.4903* 0.024 -0.071 -0.1205* 1.000
Country characteristics
REGULATORY RESTRICTIONS (7) -0.055 -0.069 0.006 0.006 0.003 -0.030 1.000 CAPITAL REQUIREMENT INDEX (8) -0.015 0.023 0.056 -0.1109* 0.052 -0.016 -0.1581* 1.000 INDEPENDENCE OF SUPERVISION (9) 0.043 -0.047 -0.013 0.006 -0.093 0.041 0.011 -0.002 1.000 SHAREHOLDER RIGHTS (10) -0.008 0.044 -0.005 -0.015 -0.033 0.086 -0.6358* 0.2741* -0.032 1.000 CREDITOR RIGHTS (11) -0.068 0.091 0.000 -0.005 -0.011 -0.038 -0.5781* -0.1668* 0.072 0.3192* 1.000 GOVERNMENT SPENDING (12) 0.031 0.033 -0.021 0.021 -0.090 -0.1267* 0.3469* -0.029 0.2269* -0.1533* -0.4710* 1.000
27
Table 5.1. (Baseline model of) State interventions as a function of bank fundamentals and country characteristics with the clog-log
STATE INTERVENTION is a binary variable where 1 indicates that the bank received state intervention during the 2008-09 financial crisis and 0 otherwise. EQUITY TO TOTAL ASSETS is the ratio of equity to total assets; LOAN LOSS PROVISIONS is the ratio of loan loss provisions to net interest revenue; RETURN ON ASSETS is the ratio of earnings to average assets; INTERBANK RATIO is the ratio of loans extended to the interbank market to loans received from the interbank market; and BANK SIZE is the logarithm of the total assets of the banks. REGULATORY RESTRICTIONS, CAPITAL REQUIREMENT INDEX and INDEPENDENCE OF SUPERVISION are composite indexes that measure, respectively, the overall restrictions on banking activities, the stringency of capital requirements and the degree to which the supervisory authority is independent from the government and legally protected from the banking industry. SHAREHOLDER RIGHTS is an indicator of the strength of rights provided by rule of law to minority shareholders; CREDITOR RIGHTS is an indicator of the strength of rights granted to creditors in a country; and GOVENMENT SPENDING is the ratio of government expenditure to gross domestic product. Robust standard errors are presented in brackets. ***, ** and * denote significance at the 1%, 5% and 10% levels confidence.
Dependent STATE INTERVENTION
Coef.
(Std Error) Odds ratio Sig. Coef.
(Std Error) Odds ratio Sig. Coef.
(Std Error) Odds ratio Sig. Coef.
(Std Error) Odds ratio Sig. Coef.
(Std Error) Odds ratio Sig. Independent
Bank fundamentals
EQUITY TO TOTAL ASSETS 0.017 1.017 0.017 1.017 0.016 1.017 0.018 1.018 0.017 1.017
(0.618) (0.584) (0.522) (0.704) (0.561)
LOAN LOSS PROVISIONS 0.009 1.009 0.009 1.009 0.010 1.010 0.008 1.008 0.009 1.009
(1.066) (1.060) (1.212) (1.026) (1.113) RETURN ON ASSETS -0.183 0.832 -0.181 0.835 -0.197 0.821 -0.180 0.835 -0.190 0.827 (-0.438) (-0.438) (-0.458) (-0.438) (-0.463) INTERBANK RATIO -0.004 0.996 * -0.004 0.996 * -0.004 0.996 * -0.004 0.996 * -0.004 0.996 * (-1.923) (-1.904) (-1.918) (-1.860) (-1.838) BANK SIZE 0.601 1.825 *** 0.615 1.849 *** 0.613 1.845 *** 0.601 1.823 *** 0.619 1.858 *** (7.439) (8.023) (7.704) (7.285) (7.977) Country characteristics REGULATORY RESTRICTIONS 0.051 1.052 0.038 1.039 (0.454) (0.236)
CAPITAL REQUIREMENT INDEX -0.104 0.901 -0.091 0.913
(-0.735) (-0.552) INDEPENDENCE OF SUPERVISION 0.104 1.109 0.126 1.134 (0.244) (0.248) SHAREHOLDER RIGHTS CREDITOR RIGHTS GOVERNMENT SPENDING Log-likelihood -87.378 -86.802 -87.337 -87.320 -86.548
Likelihood ratio test (i) vs (A) 0.370 1.370 0.210 1.700
Wald chi^2 79.442 *** 93.588 *** 91.014 *** 81.427 *** 97.935 ***
Banks 633 633 633 633 633
State Interventions 42 42 42 42 42
PANEL E
28
Table 5.2. (Baseline model of) State interventions as a function of bank fundamentals and country characteristics with the clog-log
STATE INTERVENTION is a binary variable where 1 indicates that the bank received state intervention during the 2008-09 financial crisis and 0 otherwise. EQUITY TO TOTAL ASSETS is the ratio of equity to total assets; LOAN LOSS PROVISIONS is the ratio of loan loss provisions to net interest revenue; RETURN ON ASSETS is the ratio of earnings to average assets; INTERBANK RATIO is the ratio of loans extended to the interbank market to loans received from the interbank market; and BANK SIZE is the logarithm of the total assets of the banks. REGULATORY RESTRICTIONS, CAPITAL REQUIREMENT INDEX and INDEPENDENCE OF SUPERVISION are composite indexes that measure, respectively, the overall restrictions on banking activities, the stringency of capital requirements and the degree to which the supervisory authority is independent from the government and legally protected from the banking industry. SHAREHOLDER RIGHTS is an indicator of the strength of rights provided by rule of law to minority shareholders; CREDITOR RIGHTS is an indicator of the strength of rights granted to creditors in a country; and GOVENMENT SPENDING is the ratio of government expenditure to gross domestic product. Robust standard errors are presented in brackets. ***, ** and * denote significance at the 1%, 5% and 10% levels confidence.
Dependent STATE INTERVENTION
Coef.
(Std Error) Odds ratio Sig. Coef.
(Std Error) Odds ratio Sig. Coef.
(Std Error) Odds ratio Sig. Coef.
(Std Error) Odds ratio Sig. Coef.
(Std Error) Odds ratio Sig. Independent
Bank fundamentals
EQUITY TO TOTAL ASSETS 0.017 1.017 0.017 1.017 0.013 1.013 0.019 1.019 0.028 1.029
(0.553) (0.633) (0.433) (0.682) (1.143)
LOAN LOSS PROVISIONS 0.009 1.009 0.012 1.012 0.010 1.010 0.012 1.012 0.009 1.009
(1.067) (1.363) (1.180) (1.287) (1.101) RETURN ON ASSETS -0.181 0.834 -0.149 0.862 -0.123 0.884 -0.166 0.847 -0.230 0.795 (-0.445) (-0.366) (-0.265) (-0.432) (-0.706) INTERBANK RATIO -0.004 0.996 * -0.005 0.995 ** -0.004 0.996 * -0.005 0.995 * -0.005 0.995 ** (-1.835) (-1.969) (-1.760) (-1.900) (-2.016) BANK SIZE 0.640 1.896 *** 0.647 1.910 *** 0.614 1.849 *** 0.675 1.963 *** 0.693 2.000 *** (8.711) (8.313) (7.560) (8.028) (6.737) Country characteristics REGULATORY RESTRICTIONS -0.578 0.561 *** (-2.659)
CAPITAL REQUIREMENT INDEX -0.074 0.928
(-0.874) INDEPENDENCE OF SUPERVISION 0.552 1.737 (1.342) SHAREHOLDER RIGHTS -0.310 0.733 -0.241 0.786 -0.754 0.470 *** (-1.384) (-0.996) (-3.126) CREDITOR RIGHTS -0.359 0.699 ** -0.363 0.696 -0.874 0.417 *** (-2.569) (-1.540) (-3.885) GOVERNMENT SPENDING 0.061 1.063 -0.014 0.986 -0.028 0.972 (1.479) (-0.266) (-0.534) Log-likelihood -86.377 -85.316 -86.986 -84.574 -69.743
Likelihood ratio test (i) vs (A) 4.440 ** 8.050 *** 3.070 * 10.300 ** 25.440 ***
Wald chi^2 136.650 *** 164.400 *** 146.700 *** 149.870 *** 342.670 ***
Banks 633 633 633 633 633
State Interventions 42 42 42 42 42
29
Table 6. State interventions restricted to recapitalizations as a function of bank fundamentals and country characteristics with the clog-log STATE INTERVENTION is a binary variable where 1 indicates that the bank received state intervention in the form of recapitalization during the 2008-09 financial crisis and 0 otherwise. EQUITY TO TOTAL ASSETS is the ratio of equity to total assets; LOAN LOSS PROVISIONS is the ratio of loan loss provisions to net interest revenue; RETURN ON ASSETS is the ratio of earnings to average assets; INTERBANK RATIO is the ratio of loans extended to the interbank market to loans received from the interbank market; and BANK SIZE is the logarithm of the total assets of the banks. REGULATORY RESTRICTIONS, CAPITAL REQUIREMENT INDEX and INDEPENDENCE OF SUPERVISION are composite indexes that measure, respectively, the overall restrictions on banking activities, the stringency of capital requirements and the degree to which the supervisory authority is independent from the government and legally protected from the banking industry. SHAREHOLDER RIGHTS is an indicator of the strength of rights provided by rule of law to minority shareholders; CREDITOR RIGHTS is an indicator of the strength of rights granted to creditors in a country; and GOVENMENT SPENDING is the ratio of government expenditure to gross domestic product. Robust standard errors are presented in brackets. ***, ** and * denote significance at the 1%, 5% and 10% levels confidence.
(Restricted) Dependent
STATE INTERVENTION (RECAPITALIZATION) Coef.
(Std Error) Odds ratio Sig. Coef.
(Std Error) Odds ratio Sig. Coef.
(Std Error) Odds ratio Sig. Coef.
(Std Error) Odds ratio Sig.
Independent Bank fundamentals
EQUITY TO TOTAL ASSETS 0.051 1.052 *** 0.059 1.061 *** 0.051 1.052 *** 0.057 1.058 ***
(3.751) (4.157) (3.718) (3.948)
LOAN LOSS PROVISIONS 0.011 1.011 0.008 1.008 0.013 1.013 0.008 1.008
(0.925) (0.564) (1.131) (0.676) RETURN ON ASSETS -0.372 0.689 -0.317 0.729 -0.284 0.753 -0.297 0.743 (-0.677) (-0.852) (-0.388) (-0.665) INTERBANK RATIO -0.004 0.996 -0.004 0.996 -0.003 0.997 -0.004 0.996 (-1.415) (-1.297) (-1.361) (-1.267) BANK SIZE 0.732 2.079 *** 0.779 2.180 *** 0.755 2.128 *** 0.774 2.167 *** (4.832) (4.015) (4.194) (4.208) Country characteristics REGULATORY RESTRICTIONS 0.167 1.182 -0.211 0.810 (1.252) (-0.860)
CAPITAL REQUIREMENT INDEX 0.123 1.131 0.102 1.107
(1.031) (0.712) INDEPENDENCE OF SUPERVISION 0.756 2.130 * 0.731 2.078 (1.814) (1.485) SHAREHOLDER RIGHTS -0.022 0.978 -0.433 0.648 (-0.095) (-1.227) CREDITOR RIGHTS 0.166 1.181 -0.076 0.927 (0.987) (-0.200) GOVERNMENT SPENDING 0.135 1.145 * 0.108 1.114 (1.898) (1.260) Log-likelihood -44.413 -42.803 -44.152 -36.146 Wald chi^2 113.360 *** 167.180 *** 140.490 *** 1017.200 *** Banks 606 606 606 606 State Interventions 18 18 18 18
30
Table 7. State interventions as a function of (alternative measures of) bank fundamentals and country characteristics with the clog-log
STATE INTERVENTION is a binary variable where 1 indicates that the bank received state intervention during the 2008-09 financial crisis and 0 otherwise. EQUITY TO TOTAL ASSETS is the ratio of equity to total assets; LOAN LOSS PROVISIONS is the ratio of loan loss provisions to net interest revenue; RETURN ON ASSETS is the ratio of earnings to average assets; INTERBANK RATIO is the ratio of loans extended to the interbank market to loans received from the interbank market; and BANK SIZE is the logarithm of the total assets of the banks. TOTAL CAPITAL RATIO is the ratio of regulatory capital to risk-weighted assets; IMPAIRED TO TOTAL LOANS is the ratio of impaired loans to total loans; RETURN ON ASSETS is the ratio of earnings to average assets; and RETURN ON EQUITY is the ratio of earnings to book value of equity. REGULATORY RESTRICTIONS, CAPITAL REQUIREMENT INDEX and INDEPENDENCE OF SUPERVISION are composite indexes that measure, respectively, the overall restrictions on banking activities, the stringency of capital requirements and the degree to which the supervisory authority is independent from the government and legally protected from the banking industry. SHAREHOLDER RIGHTS is an indicator of the strength of rights provided by rule of law to minority shareholders; CREDITOR RIGHTS is an indicator of the strength of rights granted to creditors in a country; and GOVENMENT SPENDING is the ratio of government expenditure to gross domestic product. Robust standard errors are presented in brackets. ***, ** and * denote significance at the 1%, 5% and 10% levels confidence.
Dependent STATE INTERVENTION
Coef.
(Std Error) Odds ratio Sig. Coef.
(Std Error) Odds ratio Sig. Coef.
(Std Error) Odds ratio Sig. Coef.
(Std Error) Odds ratio Sig. Coef.
(Std Error) Odds ratio Sig. Independent
Bank fundamentals
EQUITY TO TOTAL ASSETS 0.029 1.030 0.015 1.015 0.024 1.025
(1.202) (0.423) (0.809)
TOTAL CAPITAL RATIO -0.070 0.933 -0.177 0.838
(-0.941) (-1.546)
LOAN LOSS PROVISIONS -0.002 0.998 0.011 1.012 0.006 1.006
(-0.137) (1.235) (0.662)
IMPAIRED TO TOTAL LOANS -0.026 0.974 -0.227 0.797 ***
(-0.297) (-2.841) RETURN ON ASSETS 0.270 1.310 -0.412 0.662 -0.344 0.709 (1.273) (-1.197) (-1.062) RETURN ON EQUITY 0.013 1.013 -0.006 0.994 (0.604) (-0.274) INTERBANK RATIO -0.005 0.995 -0.006 0.995 ** -0.005 0.995 ** (-1.458) (-2.204) (-1.980)
LIQUID ASSETS TO DEPOSITS & SHORT TERM FUNDING -0.014 0.986 ** -0.015 0.985
(-2.168) (-1.394) BANK SIZE 0.628 1.873 *** 0.583 1.791 *** 0.668 1.949 *** 0.814 2.257 *** 0.718 2.051 *** (4.835) (5.000) (6.200) (6.957) (2.970) Country characteristics REGULATORY RESTRICTIONS -0.669 0.512 *** -0.827 0.437 *** -0.561 0.570 ** -0.606 0.546 *** -0.961 0.382 *** (-3.566) (-5.508) (-2.569) (-2.933) (-5.344)
CAPITAL REQUIREMENT INDEX 0.035 1.035 0.071 1.073 -0.067 0.935 -0.035 0.966 0.095 1.100
(0.295) (0.769) (-0.750) (-0.377) (0.877) INDEPENDENCE OF SUPERVISION 0.249 1.282 0.686 1.985 * 0.529 1.697 0.608 1.838 0.405 1.500 (0.686) (1.737) (1.300) (1.519) (1.072) SHAREHOLDER RIGHTS -0.908 0.403 *** -1.240 0.289 *** -0.697 0.498 *** -0.795 0.452 *** -1.491 0.225 *** (-3.059) (-6.814) (-2.923) (-3.068) (-7.089) CREDITOR RIGHTS -0.844 0.430 *** -1.095 0.335 *** -0.840 0.432 *** -0.914 0.401 *** -1.210 0.298 *** (-3.072) (-7.779) (-3.814) (-3.630) (-6.344) GOVERNMENT SPENDING -0.024 0.976 -0.099 0.906 * -0.010 0.990 -0.023 0.977 -0.060 0.942 (-0.376) (-1.725) (-0.214) (-0.439) (-1.225) Log-likelihood -53.391 -69.730 -70.017 -66.587 -46.691 Wald chi^2 750.000 *** 355.160 *** 234.020 *** 731.210 *** 170.300 *** Banks 314 293 633 632 223 State Interventions 35 40 42 42 34
31
Table 8. State interventions as a function of (lagged) bank fundamentals and country characteristics with the clog-log
STATE INTERVENTION is a binary variable where 1 indicates that the bank received state intervention during the 2008-09 financial crisis and 0 otherwise. EQUITY TO TOTAL ASSETS is the ratio of equity to total assets; LOAN LOSS PROVISIONS is the ratio of loan loss provisions to net interest revenue; RETURN ON ASSETS is the ratio of earnings to average assets; INTERBANK RATIO is the ratio of loans extended to the interbank market to loans received from the interbank market; and BANK SIZE is the logarithm of the total assets of the banks. REGULATORY RESTRICTIONS, CAPITAL REQUIREMENT INDEX and INDEPENDENCE OF SUPERVISION are composite indexes that measure, respectively, the overall restrictions on banking activities, the stringency of capital requirements and the degree to which the supervisory authority is independent from the government and legally protected from the banking industry. SHAREHOLDER RIGHTS is an indicator of the strength of rights provided by rule of law to minority shareholders; CREDITOR RIGHTS is an indicator of the strength of rights granted to creditors in a country; and GOVENMENT SPENDING is the ratio of government expenditure to gross domestic product. Robust standard errors are presented in brackets. ***, ** and * denote significance at the 1%, 5% and 10% levels confidence.
Dependent
STATE INTERVENTION
Coef.
(Std Error) Odds ratio Sig. Coef.
(Std Error) Odds ratio Sig. Coef.
(Std Error) Odds ratio Sig. Coef.
(Std Error) Odds ratio Sig.
Independent Bank fundamentals
EQUITY TO TOTAL ASSETS 0.008 1.008 0.010 1.010 0.013 1.013 0.025 1.025
(0.454) (0.650) (0.599) (1.206)
LOAN LOSS PROVISIONS -0.002 0.998 -0.002 0.998 -0.001 0.999 -0.001 0.999
(-0.423) (-0.309) (-0.119) (-0.228) RETURN ON ASSETS 0.323 1.381 *** 0.315 1.371 *** 0.328 1.388 *** 0.261 1.299 ** (4.249) (3.894) (3.606) (2.539) INTERBANK RATIO -0.004 0.996 ** -0.004 0.996 ** -0.004 0.996 *** -0.005 0.995 *** (-2.361) (-2.188) (-2.577) (-2.668) BANK SIZE 0.643 1.901 *** 0.664 1.943 *** 0.718 2.050 *** 0.752 2.121 *** (7.519) (7.579) (7.344) (6.177) Country characteristics REGULATORY RESTRICTIONS 0.050 1.052 -0.592 0.553 ** (0.352) (-2.551)
CAPITAL REQUIREMENT INDEX -0.042 0.959 0.015 1.015
(-0.281) (0.166) INDEPENDENCE OF SUPERVISION 0.251 1.286 0.680 1.974 * (0.531) (1.744) SHAREHOLDER RIGHTS -0.299 0.741 -0.868 0.420 *** (-1.171) (-2.797) CREDITOR RIGHTS -0.372 0.690 * -0.890 0.411 *** (-1.723) (-3.923) GOVERNMENT SPENDING -0.042 0.959 -0.059 0.942 (-0.950) (-1.329) Log-likelihood -44.413 -42.803 -44.152 -36.146 Wald chi^2 113.360 *** 167.180 *** 140.490 *** 1017.200 *** Banks 553 553 553 553 State Interventions 41 41 41 41
32
Table 9. State interventions as a function of bank fundamentals and country characteristics with the clog-log matched with propensity scores STATE INTERVENTION is a binary variable where 1 indicates that the bank received state intervention during the 2008-09 financial crisis and 0 otherwise. EQUITY TO TOTAL ASSETS is the ratio of equity to total assets; LOAN LOSS PROVISIONS is the ratio of loan loss provisions to net interest revenue; RETURN ON ASSETS is the ratio of earnings to average assets; INTERBANK RATIO is the ratio of loans extended to the interbank market to loans received from the interbank market; and BANK SIZE is the logarithm of the total assets of the banks. REGULATORY RESTRICTIONS, CAPITAL REQUIREMENT INDEX and INDEPENDENCE OF SUPERVISION are composite indexes that measure, respectively, the overall restrictions on banking activities, the stringency of capital requirements and the degree to which the supervisory authority is independent from the government and legally protected from the banking industry. SHAREHOLDER RIGHTS is an indicator of the strength of rights provided by rule of law to minority shareholders; CREDITOR RIGHTS is an indicator of the strength of rights granted to creditors in a country; and GOVENMENT SPENDING is the ratio of government expenditure to gross domestic product. Robust standard errors are presented in brackets. ***, ** and * denote significance at the 1%, 5% and 10% levels confidence.
Dependent
STATE INTERVENTION
Coef.
(Std Error) Odds ratio Sig. Coef.
(Std Error) Odds ratio Sig.
Coef.
(Std Error) Odds ratio Sig.
Coef.
(Std Error) Odds ratio Sig.
Independent Bank fundamentals
EQUITY TO TOTAL ASSETS 0.024 1.024 0.025 1.025 0.028 1.029 0.035 1.036
(0.037) (0.040) (0.039) (0.040)
LOAN LOSS PROVISIONS 0.011 1.011 0.012 1.012 0.013 1.013 0.012 1.012
(0.009) (0.009) (0.009) (0.010) RETURN ON ASSETS -0.193 0.824 -0.211 0.809 -0.204 0.815 -0.302 0.740 (0.257) (0.261) (0.253) (0.249) INTERBANK RATIO -0.005 0.995 * -0.005 0.995 * -0.005 0.995 * -0.006 0.994 * (0.003) (0.003) (0.003) (0.003) BANK SIZE 0.719 2.053 *** 0.730 2.075 *** 0.799 2.224 *** 0.823 2.277 *** (0.098) (0.102) (0.110) (0.117) Country characteristics REGULATORY RESTRICTIONS 0.023 1.023 -0.682 0.505 *** (0.102) (0.218)
CAPITAL REQUIREMENT INDEX -0.098 0.906 -0.060 0.942
(0.101) (0.110) INDEPENDENCE OF SUPERVISION 0.142 1.152 0.632 1.881 * (0.298) (0.366) SHAREHOLDER RIGHTS -0.297 0.743 -0.940 0.391 *** (0.191) (0.296) CREDITOR RIGHTS -0.343 0.709 * -0.913 0.401 *** (0.193) (0.268) GOVERNMENT SPENDING -0.011 0.989 -0.024 0.977 (0.047) (0.049) Log-likelihood -65.997 -63.418 -64.492 -51.181 Wald chi^2 99.960 *** 101.260 *** 108.400 *** 123.070 *** Pseudo R2 0.324 0.328 0.351 0.398 Banks 633 633 633 633 State Interventions 42 42 42 42
33
Table 10. State interventions as a function of bank fundamentals and country characteristics with the clog-log split by the median size
STATE INTERVENTION is a binary variable where 1 indicates that the bank received state intervention during the 2008-09 financial crisis and 0 otherwise. EQUITY TO TOTAL ASSETS is the ratio of equity to total assets; LOAN LOSS PROVISIONS is the ratio of loan loss provisions to net interest revenue; RETURN ON ASSETS is the ratio of earnings to average assets; INTERBANK RATIO is the ratio of loans extended to the interbank market to loans received from the interbank market; and BANK SIZE is the logarithm of the total assets of the banks. REGULATORY RESTRICTIONS, CAPITAL REQUIREMENT INDEX and INDEPENDENCE OF SUPERVISION are composite indexes that measure, respectively, the overall restrictions on banking activities, the stringency of capital requirements and the degree to which the supervisory authority is independent from the government and legally protected from the banking industry. SHAREHOLDER RIGHTS is an indicator of the strength of rights provided by rule of law to minority shareholders; CREDITOR RIGHTS is an indicator of the strength of rights granted to creditors in a country; and GOVENMENT SPENDING is the ratio of government expenditure to gross domestic product. Robust standard errors are presented in brackets. ***, ** and * denote significance at the 1%, 5% and 10% levels confidence.
Dependent STATE INTERVENTION
Coef.
(Std Error) Odds ratio Sig.
Coef.
(Std Error) Odds ratio Sig. Independent
Bank fundamentals
EQUITY TO TOTAL ASSETS 0.095 1.099 * -0.018 0.982
(1.805) (-0.287)
LOAN LOSS PROVISIONS 0.001 1.001 0.013 1.013
(0.032) (1.340) RETURN ON ASSETS -3.483 0.031 0.092 1.097 (-1.279) (0.283) INTERBANK RATIO -0.004 0.996 -0.006 0.994 * (-1.374) (-1.651) BANK SIZE 5.206 182.334 0.693 2.000 *** (1.192) (4.906) Country characteristics REGULATORY RESTRICTIONS -0.409 0.664 -0.638 0.528 *** (-1.455) (-3.394)
CAPITAL REQUIREMENT INDEX -1.495 0.224 -0.041 0.960
(-1.634) (-0.542) INDEPENDENCE OF SUPERVISION -2.901 0.055 0.706 2.027 * (-1.014) (1.674) SHAREHOLDER RIGHTS 1.972 7.187 * -0.881 0.414 *** (1.825) (-4.863) CREDITOR RIGHTS -0.389 0.678 -1.043 0.352 *** (-0.437) (-5.190) GOVERNMENT SPENDING 0.438 1.550 * -0.041 0.960 (1.887) (-0.737) Log-likelihood -44.152 -76.000 Wald chi^2 140.490 *** 160.000 *** Banks 323 310 State Interventions 3 39