Abstract—This research tested the performance of alternative warehouse designs concerning the picking process. The chosen performance measures were Travel Distance and Total Fulfilment Time. An explanatory case study was built up around a model implemented with SIMUL8. Hypotheses were set by selecting outcomes from the literature survey matching popular empirical findings. 17.4% reductions were found for Total Fulfilment Time and Resource Utilisation. The latter was then used as a proxy for operational efficiency. Literal replication of theoretical data-patterns was considered as an internal validity sign. Assessing the estimated changes benefits ahead of implementation was found to be a contribution to practice.
Keywords—Warehouse discrete-event simulation, Storage policy selection and assessment, Performance evaluation of order picking.
I. INTRODUCTION
HEsponsor of this project, GrandVision’s Logistics, has
asked how, and with the least possible disturbance, the organization, operation and performance of its main warehouse in Portugal could be improved. Thus, the main objective of this assignment is to use previous research findings, supported on theoretical grounds, to propose improvements to the current warehouse performance of Grand Vision. However, in order to mitigate the risk of disrupting commercial operations, a convincing what-if tool should back up the change process.
Indeed, since “Performance evaluation provides feedback on the quality of a proposed design and/or operational policy, and more importantly, on how to improve it” [1], it is essential for every warehouse operation to have its performance constantly assessed in accordance with well-defined criteria. Commonly mentioned among these criteria are: Investment and Operational Costs, Volume and Mix Flexibility, Throughput, Storage Capacity and Order Fulfilment Quality (Accuracy) [2]; of these, however, both Travel Distance and Total Fulfilment Time, i.e. total travel and picking times, are the most used, when referring to traditional warehouses. Moreover, it is well-known that of all the operational JoãoVilas-Boas is with the Business School of Instituto Universitário de Lisboa (ISCTE-IUL), BRU-UNIDE, Lisboa, Portugal (Phone: +351 217 903 403; Fax: +351 217 964 710; e-mail: [email protected]).
Abdul Suleman is with the School of Technology and Architecture of Instituto Universitário de Lisboa (ISCTE-IUL), BRU-UNIDE, Lisboa, Portugal (Phone: +351 217 903 481; Fax: +351 217 964 710; e-mail: [email protected]).
Luis Moreira is a graduate of the “Mestrado em Gestão dos Serviços e da Tecnologia”, Instituto Universitário de Lisboa (ISCTE-IUL), Lisboa, Portugal (e-mail: [email protected]).
processes, order picking is the most labour intensive, representing ≈60% of the overall operating costs in a traditional warehouse. Order picking is also the most difficult process to manage [3]-[5] and it is significantly affected by the storage [6], [2] and routing policies [5]. Furthermore, discrete-event simulation has been shown to be a relevant approach to test several combinations of warehousing policies and their impact on the operations’ performance, since it is widely used in the warehousing context (e.g. [6], [7]). SIMUL8 software is, then, selected because it is a robust, user-friendly tool, which has proved to be adequate for implementing conceptual models and also for what-if analysis. Thus, we built the
«as-is» model to describe the current situation, and also built the
improved model.
Two hypotheses concerning the Picker-to-Parts Ware-housing System Performance are tested in both models. In the new model, picker utilization decreases 17.4%, which was related to an efficiency improvement despite it not being possible to isolate the effect of the Golden Zone Storage Implementation Strategy. Total Fulfilment Time improved by 17.4%.
The next section presents the literature review. This is followed by the case study in which GrandVision’s Logistics is reported. On the one hand, the purpose of this is to test whether the solutions for the sponsor context make a potential contribution to practice, despite the results not being implemented. On the other hand, it represents a contribution to theory testing through the confirmation (or not) of the established hypotheses. Finally, the conclusions section closes the paper.
II. SETTING A THEORETICAL BACKGROUND
Warehouses are strategic infrastructures built to facilitate the movement of goods through the supply chain to the end consumer [8]. A storage system [2], order picking system [9], or just the warehousing system [3], [10] refers to specific combinations of human resources and technology, which allow material handling activities to be carried out in an effective way. Their operating costs represent about 22% of the overall logistic costs in the USA [11], while in Europe the percentage is around 25% [12].
Several authors have pointed out a lack of systematic approaches for warehouse design [2], [13], and [14]. Moreover, warehouse decisions are regarded as highly complex as they often address conflicting performance objectives, e.g. costs, throughput, storage capacity, response times. Thus, tradeoffs have to be made [2].
The flow of items through the warehouse can be divided
Testing the Performance of Rival Warehousing
Policies through Discrete Event Simulation
João Vilas-Boas, Abdul Suleman, Luis Moreira
T
into distinct phases, which are called processes; the design of the process flow is considered a strategic level decision [2]. Most of the literature mentions four basic processes: receiving, storage, order picking and shipping; some authors, however, go into more detail and include other steps such as pre-advice, checking, put-away, replenishment, packing and cross dock [15].
A great number of warehouses are designed to have a reserve or bulk storage area, where products are stored in the most economical way, and a forward or fast pick area, where products are stored in a way that increases picking productivity by between 10-20 times [4]. In this kind of layout, the inventory must flow cyclically from the reserve area to the fast pick area, a concept defined as replenishment.
The vast majority of warehouses employ humans to perform their activities, with three different order picking systems being found in warehouses: picker-to-part systems, put systems and parts-to-picker systems. Picker-to-part systems account for about 80% of all order picking systems in Western Europe [16]. Order picking is the most important process in traditional Picker-to-Parts or Manual Warehousing Systems [3]. It can be defined as “the process by which products are retrieved from storage to satisfy customer demand” [17]. Order pickers travel along aisles collecting items either from bins on low-level storage racks (bin-shelving), or from high-level storage racks. Petersen et al. [18] suggest that placing
higher demand SKUs in the “golden zone” – the area between
a picker’s waist and shoulders – would significantly reduce total fulfilment time, although it might increase travel distance [19], [20]. Pick and container carts are widely used for low-level picking, whereas high-low-level operations are done with the help of man-aboard lifting trucks or cranes [10].
Storage is a major warehouse function and the way material is allocated to storage locations is the most important factor affecting the performance of the order picking process [2], [6]. Hence, storage and order picking should be considered a cluster of problems, and decisions regarding policies should not be taken in isolation. According to [5], order picking performance depends on three main aspects: picking policies, routing policies and storage policies. Since different combinations of these policies will most likely result in considerably different operations, it is worth taking a closer look at each of them.
Picking policies concern the number of orders (and therefore items) picked by an order picker during a picking tour [4]. Three basic picking alternatives can be identified: single order or strict order picking, batch picking and zone picking. Having decided the number of orders an order picker shall pick in a picking tour, one faces the problem of picking routes, which “consists of finding a sequence in which products have to be retrieved from storage such that the travel distances are as short as possible” [21]. Several routing heuristics and optimal procedures have been developed. Although optimal procedures offer the best solutions, they are often confusing and difficult to explain; while heuristics yield near-optimal solutions and are easier to implement [7].
In short, order picking is not only the most costly and
labour intensive process of a traditional (bin-shelving) warehouse, but also the most complex. Thus, its «optimization» for cost-efficiency is usually a major design goal, with the objective being to maximize throughput for the minimum investment and lowest operational costs.
III. CASE STUDY A. Problem Statement
The problem statement is to determine a combination of the storage, picking and routing policies that will improve the performance of the shop replenishment operation. Thus, the following data are required: (i) the information on the warehouse layout; (ii) a certain set of human-resources; (iii) the SKUs stored in the warehouse and their turnover; (iv) the average number of daily replenishment orders; (v) the average no. of daily replenishment order lines.
B. Empirical Findings and Hypotheses
Empirical findings regarding Picker-to-Parts Warehousing System Performance [7], [5], [18] helped to narrow the range of theoretical policy combinations to be tested. As a consequence, this research focused on the effect of batching, class-based and golden zone policies, under the following hypotheses: (i) A Class-Based Storage Policy will improve GrandVision’s Warehouse Replenishment Operation; (ii) A Batching Picking Policy will improve GrandVision’s Warehouse Replenishment Operation; (iii) A Golden Zone Storage Assignment Strategy will improve GrandVision’s Warehouse Replenishment Operation. Hypothesis (ii), i.e. changing the batching policy and its related impact in the simulation is beyond the scope of this paper, so it is not tested.
C. Problem-Solving Methodology
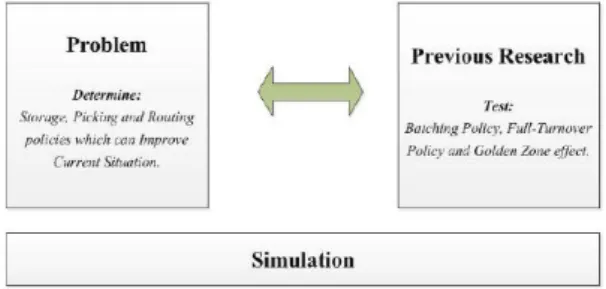
The methodology selected to test different combinations of policies was discrete-event simulation, as it is considered the best modeling approach for operations’ systems [22] and, also, because it is widely used in the warehousing context [6], [7]. The SIMUL8 software was chosen because despite being very powerful, it is nevertheless a very user-friendly solution. Two models simulating the Shop Replenishment Operation were created and implemented, and their results were contrasted to determine a combination of Storage, Picking and Routing policies to improve the current situation (Fig. 1). Therefore, a proposal for changing the SKU storage policy along with the implementation of a golden zone policy is presented as an alternative.
Fig. 1 Conceptual framework
D. Developing and Implementing the Conceptual Models In order to emulate the performance of an operating system, simulation modelling requires information input that is as close as possible to the reality. In order to input that information in the simulation software, data was collected, not only from Management maps and from the company information system (ERP), but also from observing the replenishment operation in the field. The required data are, as follows:
• Warehouse layout measures
• Data regarding the size and content of the Replenishment
Orders (RO)
• Data regarding turnover of each SKU
• Data regarding picking times.
The first model created, simulates the ‘as-is’ situation. Therefore, the storage and picking policies actually used were replicated in the model, as closely as possible to the reality. The storage policy follows a Class-Based option based on the Type of Product, i.e. Frames and Sunglasses, either Private Label or Branded. In addition, the implemented picking policy is Strict Order Picking. Moreover, Traversal Policy was also considered in the simulation model, despite the routing policy being random in reality, because this was found to be a good simplification approach. The ‘as-is’ situation is, then, depicted in Fig. 2.
Fig. 2 Turnover by type of product
From the analysis of the Turnover of each SKU, one might conclude that the SKU “Private Label Sunglasses” is ranked higher, representing 49.5% of the Grand Total, followed by
“Branded Sunglasses”, representing 21.8%, “Branded Frames”
with 20.1%, and finally “Private Label Frames”, representing 8.6 % (Fig. 3).
Fig. 3 Turnover by type of product
As regards the Storage Policy of the alternative model that simulates the Shop Replenishment Operation, the consistency
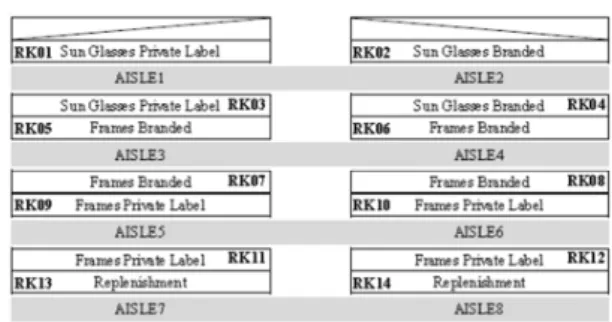
of Product Type (Frames and Sunglasses either Private Label or Branded) was maintained in order to simplify the picking operation. Nevertheless, the four different Product Type combinations are stored closer to the depot, according to their Turnover. So, this can be considered as a Class-Based Storage with two sorting dimensions, i.e. Type of Product and Turnover. Moreover, a within-aisle storage implementation strategy was chosen. Finally, the Golden Zone was also adopted in the improved model. Therefore, products with higher Turnover are located between waist and shoulders (Fig. 4).
Fig. 4 Model for the current situation
The next step is to use the SIMUL8 software to implement these conceptual alternatives. Fig. 5 presents the result of this implementation. Although the whole set of details can be found in [23], a short explanation will be given in Table I to enable a broad overview of the schema depicted in Fig. 5.
TABLEI
DEFINITION OF THE MAIN ENTITIES OF THE SIMULATION MODELS
Symbol Description
Work Entry Point – According to empirical data, a number of replenishment orders (ROs), with a certain number of order lines and quantities of each SKU is created each morning. The ROs are the Work Items of the model
Pickers – There are 3 pickers available; in the model, they are the resources responsible for completing the ROs. They should collect one RO, pick all items in it and then repeat the process until there are no other ROs available to be picked
Routing Work Center – At the front aisle, cross aisle and rear aisle there are work centers, which conduct pickers according to the established traversal routing policy. These routings are done by the means of programmed labels that analyze which is the next rack pickers should collect an item from
Rack Work Center – At each aisle there are two rack work centers. Labels are inserted in a storage spreadsheet file; in this way, the work item is tested when passing through the work center and pickers take the corresponding time to pick the amount of items in the corresponding rack. In addition, there are also Golden Zone labels, distinguishing products which are, or are not, stored in this special area
Work Exit Point – the pickers collect an order, then pick up another until there are no more orders to collect
Traversal Route first stage Traversal Route second stage
Fig. 5 Implementation of the conceptual models with the SIMUL8 software E. Results
If one compares the new situation with the current one (“as-is”) for the same amount of entered and processed Replenishment Orders, it might be concluded that the resource utilization decreased from ≈65% to ≈55% of the pickers’ working day (Fig. 6), representing an improvement of 17.4% in the warehouse operation. It should be noted that resource utilization was taken as a good measure of the operations’ efficiency. Therefore, the simple alteration of the storage policy, along with a Golden Zone policy implementation, results in a significant increase in warehouse performance.
The change brought an improvement of 17.4% on Total Fulfilment Time. Therefore, the simulation models confirmed hypothesis (i) of improvement, i.e.
(i). A Class-Based Storage Policy appears to improve GrandVision’s Warehouse Replenishment Operation. Although it was implemented in the simulation models, the effect of the Golden Zone Storage Implementation Strategy was not measured, as it was not possible to isolate it. Moreover, the test of changing the batching policy is beyond the scope of this paper.
Before (“as-is” situation) After
U ti li za ti o n ( % ) M in im u n U se C u rr en t U se A v er ag e U se M ax im u m U se T ra v el li n g ( % ) U ti li za ti o n ( % ) M in im u n U se C u rr en t U se A v er ag e U se M ax im u m U se T ra v el li n g ( % ) Picker 64,743 0 0 1,942 3 0 Picker 55,151 0 0 1,655 3 0 Fig. 6 Resource utilisation
IV. CONCLUSIONS
This research tested the performance of rival warehousing policies concerning the picking process by developing a model
and implementing it with SIMUL8, a discrete-event simulation software. Hypotheses were set by fine-tuning the outcomes of the literature survey with simplifications based on
empirical evidence from other studies. The estimated benefits accruing from the simulation models are not far from [7], where improvements that range from 17% to 22% are mentioned.
A relevant contribution to practice is that GrandVision’s management can assess the benefits of the proposed changes to its Shop Replenishment Operation ahead of their eventual implementation. Moreover, as the research results match the data patterns coming out of the literature, this is a sign of literal replication and, consequently, of stronger internal validity of the model [24], [25]. This case study also performed a confirmatory role [26] by enabling the empirical test of the hypotheses previously set, which is a contribution to research.
A. Limitations and Assumptions
Simulation modelling remains a representation of the reality, although it necessitated several months of hard work collecting empirical data from the field to support this research. A reason for this concerns the assumptions and simplifications considered during the modelling process that cause limitations to the obtained results. These are as follows:
• Travel Times within Aisles were not considered, as there
was one Work Center per each aisle;
• The Routing Policy, in the current situation, was assumed
as being S-Shaped, when in reality it was random;
• Sales Turnover was selected as a slotting measure, which
can raise two issues. Firstly, despite everything indicating that for most of the SKUs, Sales Turnover and Warehouse Shipment Turnover match, it is known that there are some products - called obsoletes - that are sent to the shops, but not sold. Secondly, as popularity is based in the number of hits of an SKU in picking lists, Sales Turnover represents a ratio per unit of time. The difference between these two slotting measures may be more important if there is a good amount of cross-docking operations taking place, as the largest portion of stock of some SKUs are only in transit through the warehouse. These are not stored for Picking Operations.
• Sales Turnover was considered as an average of the entire
year period, which ignores the effect of seasonality, especially present in sunglasses.
• In addition, the following limitations are also identified:
• A What-if analysis regarding batching policies, order size
and demand distribution was not done.
• Trials were not run in the simulation, thus the results
presented only refer to a single case.
• It was not possible to isolate the effect of Golden Zone Storage Implementation Strategy.
All these assumptions and limitations leave an empirical gap, and support a need for more in-depth future work.
ACKNOWLEDGEMENT
The authors would like to acknowledge the SIMUL8 Corporation for providing the educational version of the SIMUL8 software free of charge.
This research was presented at EUROMA 2015, June 26th -
July 1st, 2015, Neuchâtel, Switzerland. REFERENCES
[1] Gu J., Goetschalckx M., McGinnis L., (2010), “Research on warehouse design and performance evaluation: a comprehensive review”, European Journal of Operational Research, vol. 203, pp. 539–549.
[2] Rouwenhorst, B., Reuter, B., Stockrahm, V., van Houtum, G., Mantel, R., Zijm, W., (2000), “Warehouse design and control: framework and literature review”, European Journal of Operational Research, vol. 122(3), pp. 515-533.
[3] Van den Berg, J., (1999), “A literature survey on planning and control of warehousing systems”, IIE Transactions, vol. 31(8), pp. 751-762. [4] Frazelle, E. (2002), World-class warehousing and material handling,
New York, McGraw-Hill.
[5] Petersen, C., Aase, G., & Heiser, D., (2004), “Improving order-picking performance through the implementation of class-based storage”, International Journal of Physical Distribution & Logistics Management, vol. 34(7/8), pp. 534.
[6] Chan, F. & Chan H., (2011), “Improving the productivity of order picking of a manualpick and multi-level rack distribution warehouse through the implementation of classbased storage”, Expert Systems with Applications, vol. 38, pp. 2686-2700.
[7] Petersen, C. & Aase, G., (2004), “A comparison of picking, storage, and routing policies in manual order picking”, Int. J. Production Economics, vol. 92, pp. 11-19.
[8] Rushton A., Croucher, P. and Baker, P., (2010), The handbook of logistics & distribution management, London, Kogan Page.
[9] De Koster, M. & Roodbergen, K., (2007), “Design and control of warehouse order picking: a literature review”, European Journal of Operational Research, vol. 182, pp. 481-501.
[10] Van den Berg, J., Zijm, W., (1999), “Models for warehouse management: classification and exemples”, Int. J. Production Economics, vol. 59, pp. 519 528.
[11] Establish Inc. / Herbert W. Davis & Co., (2005). Logistic Cost and Service 2005, presented at Council of Supply Chain Managers Conference 2005.
[12] ELA European Logistics Association / A T Kearney Management Consultants, (2004).
[13] Goetschalckx, M, McGinnis, L., Bodner, D., Govindaraj, T., Sharp, G., Huang, K., (2002), “A systematic design procedure for small parts warehousing systems using modular drawer and bin shelving systems”, IMHRC proceedings.
[14] Baker P. & Canessa, M., (2009), “Warehouse design: a structured approach”, European Journal of Operational Research, vol. 193, pp. 425-436.
[15] Richards, G., (2011), Warehouse management: a complete guide to improving efficiency and minimizing costs in the modern warehouse, London, Kogan Page.
[16] De Koster, M. & Roodbergen, K., (2007), “Design and control of warehouse order picking: a literature review”, European Journal of Operational Research, vol. 182, pp. 481-501.
[17] Roodbergen, K., Vis, I., (2005), “A model for warehouse layout”, IIE Transactions, vol. 38(10), pp. 799-811.
[18] Petersen, C., Siu, C., Heiser, D., (2005), “Improving order picking performance utilizing slotting and golden zone storage”, International Journal of Operations & Production Management, vol. 25(9/10), pp. 997. [19] Saccomano, A., (1996), “How to pick picking technologie”, Traffic
World, 13 May, pp. 39-40.
[20] Jones, E. and Battieste, T., (2004), “Golden retrieva”, Industrial Engineer, vol. 36(6), pp. 37-41.
[21] Roodbergen, K., De Koster, M., (2001), “Routing methods for warehouses with multiple cross aisles”, International Journal of Production Research, vol. 39(9), pp. 1865-1883.
[22] Robinson, S. (2004), Simulation: the practice of model development and use, Chichester, John Wiley & Sons Ltd.
[23] Moreira, L. (2013), A Simulation Approach to Warehousing Policies: The GrandVision Case, MSc Thesis, ISCTE – IUL, Portugal.
[24] Yin, R., (1994), Case study research: design and methods, 2nd ed., Sage Publications, Inc., USA.
[25] Vilas-Boas da Silva, J.M., Kay, J.M. and Dinis, J.A. (1999), "Credibility in explanatory multiple-case studies: a practical approach", VI international annual conference of the EurOMA, Venice, Italy, 7th-8th June 1999, pp. 129-136.
[26] Eisenhardt, K. (1989), “Building theories from case study research”, Academy of Management Review, vol. 14(4), pp. 532-550.