Printed version ISSN 0001-3765 / Online version ISSN 1678-2690 www.scielo.br/aabc
http://dx.doi.org/10.1590/0001-3765201520130380
Correspondence to: Viviane Nogaroto E-mail: [email protected]
High Postprandial Triglycerides Serum Levels: Is Obesity a Good Predictor?
VIVIANE NOGAROTO1, MARCOS R.S. RODRIGUES2, MARCELO R. VICARI1, MARA C. DE ALMEIDA1,
FÁBIO Q. MILLÉO2, FÁBIO A. DOS SANTOS3 and ROBERTO F. ARTONI1
1
Departamento de Biologia Estrutural, Molecular e Genética, Universidade Estadual de Ponta Grossa, Av. Carlos Cavalcanti, 4748, 84030-900 Ponta Grossa, PR, Brasil
2Departamento de Cirurgia, Hospital Vicentino da Sociedade Beneficente
São Camilo, Rua Doralicio Correia, 84031-190 Ponta Grossa, PR, Brasil
3
Departamento de Odontologia, Universidade Estadual de Ponta Grossa, Av. Carlos Cavalcanti, 4748, 84030-900 Ponta Grossa, PR, Brasil
Manuscript received on September 19, 2013; accepted for publication on September 8, 2014
ABSTRACT
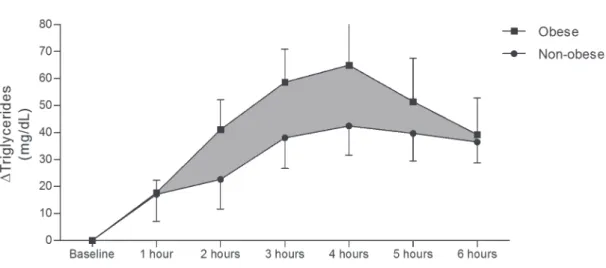
The aim of this study was to analyze the correlation between triglyceride (TG) serum levels in obese and non-obese patients in a simulated postprandial state. Both groups showed TG levels < 150 mg/dL when fasting. After 12 h fasting, the subjects ingested a lipid overload diet and blood samples were collected. The variation between fasting and the postprandial TG peak levels were analyzed. The peak of postprandial TG levels occurred 4 h after the lipid overload in both groups. When the subjects were not fasting, the majority of non-obese subjects remained within the range of normal TG values, but the values for the obese group
remained elevated. There was a significant correlation between Body Mass Index (BMI) and TG at each time
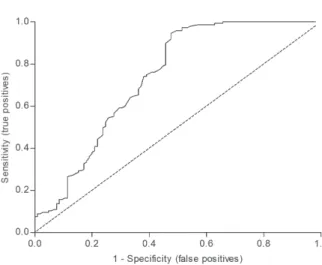
point until 2 h after the meal, but the data did not show a correlation after 3 h. According to the receiver-operating characteristics (ROC) curve, postprandial TG values were not a good predictor of obesity (based
on BMI), but they were a predictor of obesity. This study reinforces the importance of measuring
non-fasting TG levels in obese and non-obese subjects, because some non-obese patients probably had altered fat metabolism, indicating that this examination could be an indicator of metabolic risk.
Key words: body mass index, lipid metabolism, risk factor, ROC curve.
INTRODUCTION
Fats accounts for approximately 30 to 40% of the caloric intake of the occidental diet. An imbalance between caloric intake and energy expenditure results in excessive storage of corporal fat, often resulting in overweight or obesity. This imbalance often produces an altered lipid profile characterized
et al. 1998, Stavenow and Kjellstrom, 1999). For the prevention of cardiovascular disease, it is extremely important to detect lipid metabolism alterations at an early stage through clinical examinations (Teixeira et al. 2001).
Generally, TG levels are obtained when patients are fasting, and the association between TG levels and cardiovascular disease remains controversial. Bansal et al. (2007) have suggested that postprandial hypertriglyceridemia may play an important role in atherosclerosis. Despite being considered deleterious, postprandial serum hypertriglyceridemia is not identified in many patients with normal fasting lipid serum levels. Consequently, high-risk conditions can be underestimated (Groot et al. 1991, Patsch et al. 1992, Weintraub et al. 1996). For most of the day, humans are not fasting. Consequently, a group that is potentially at high risk for atherosclerosis and coronary artery disease is not identified and is obviously not aware of this risk condition (Patsch et al. 1992, van Wijk et al. 2003). Measuring postprandial lipemia includes both the extent and duration of TG elevation after lipid consumption (Patsch et al. 1992), and determining postprandial plasma TG concentration after a meal is crucially important in identifying the actual lipid metabolism profile.
Three decades ago, Zilversmit (1979) described the importance of postprandial TG studies and hypothesized that the development of atherosclerosis could be a postprandial phenomenon. Stampfer et al. (1996) showed that plasma TG levels measured 3 to 4 h after a meal were better than fasting plasma TG levels at predicting future cases of myocardial infarction. Disturbances in postprandial lipemia have also been observed in type 2 diabetic patients (Chen et al. 1993) and in individuals with visceral obesity or features of metabolic syndrome (Couillard et al. 1998). Obesity is a condition associated with numerous alterations in plasma lipid and lipoprotein concentrations (Björntorp 1992, Kissebah and Krakower 1994), and TG responses to a high-fat
meal are exaggerated in obese individuals compared to non-obese individuals (Lewis et al. 1990). In our research, we showed that there are differences in fasting and non-fasting TG states between obese and non-obese patients with basal TG levels <150 mg/dL (which is considered normal [NCEP 2001]). We also analyzed the range of TG variation in relation to the basal TG values in these groups. For this study, we focused on the importance of postprandial TG measurements.
MATERIALS AND METHODS
SUBJECTS
This study included 36 patients between the ages of 18 and 60. The patients were mainly female; there were 25 female (70%) and 11 male individuals (30%) living in the south of Brazil (Ponta Grossa - State of Paraná). There were more female patients because more women than men seek assistance for the treatment of problems related to obesity. All of the patients were treated between 2005 and 2009 and signed informed consent forms before participating in this study. The study was approved by the Ethics Committee of the Vicentino Hospital (Ponta Grossa) and by the Universidade Estadual de Ponta Grossa (COEP authorization number 51/2005).
The study patients were divided into two groups (obese and non-obese) according to their BMI (calculated by dividing body weight in kilograms by height in square meters). In this study, 15 non-obese individuals (BMI <30 kg/m2) (WHO 1998) were used as our control group, and 21 obese patients (BMI ≥ 30 kg/m2) (WHO 1998)
high TG (≥ 500 mg/dL). According to the NCEP (2001), hypertriglyceridemia is defined as a TG level higher than 150 mg/dL. Patients (non-obese and obese) with TG serum levels < 150 mg/dL in the fasting state were included in this study.
CLINICAL ASSAYS
After a 12 h overnight fast, blood samples (5mL) were collected from all of the patients by venipuncture. Next, while the patients remained seated in the laboratory, a standardized lipid overload (which consisted of 200 g of 25% fat milk cream and 50 g of egg yolk) was administered to them over a maximum time period of 10 minutes. After the meal, blood samples were drawn every 1h for a 6h period; the serum TG levels of the patients were measured by enzymatic methods and compared. No food or drink (except water) was consumed until the exam was finished. The TG levels obtained were compared for both groups in fasting and postprandial states. Additionally, TG values for the obese and non-obese groups were analyzed separately to compare the basal TG levels with the peak levels obtained after the high-fat meal.
STATISTICAL ANALYSIS
Baseline comparisons between the non-obese and obese subjects were made using either Student’s t-test (age and BMI) or Fisher's exact test (gender). Comparisons between the baseline and postprandial time points were carried out using analysis of variance (ANOVA) for repeated measurements. To compare the two groups (non-obese and obese) at each time point, Student’s t-test was used. The relationship between BMI and TG levels was obtained using the Pearson correlation test at each time point. The area under the ROC curve was determined to evaluate whether TG levels predicted obesity.
The normality of the distribution of the data was confirmed using the Kolmogorov-Smirnov test. When necessary, the raw data were logarithmically transformed. A p-value ≤0.05 was considered to
indicate statistically significant differences between the groups. All of the calculations were performed using SPSS® (Statistical Package for the Social
Sciences) version 11.5.1 for Windows (SPSS Inc. Chicago, Illinois, USA) and GraphPad Prism® version 5.00 for Windows (GraphPad Software. San Diego, California, USA).
RESULTS
The patients who participated in this study were divided into two groups, obese or non-obese, according to their BMI. Both groups had a similar gender composition (p = 0.465), and there were no significant differences in age between the two groups (p = 0.061). The mean BMI was significantly higher in the obese group than in the non-obese group (p < 0.05) (Table I).
TABLE I
Selected characteristics of the study subjects. Age and BMI (body mass index) were calculated
as the mean ± standard deviation.
Variables
Non-obese (BMI < 30 kg/m2)
n = 15
Obese (BMI ≥ 30 kg/m2)
n = 21
p value
Age (years)* 32.27 ± 14.51 40.67 ± 11.51 0.061ns BMI (kg/m2)* 23.28 ± 3.45 38.78 ± 6.41 <0.0001s
Gender†
Male 6 (40%) 5 (24%) 0.465ns
Female 9 (60%) 16 (76%)
* = Student’s t-test; † = Fisher's exact test; s = significant ; ns =
non significant.
period, unlike the obese group, whose average values did not reach the normal range until 1h after the standardized meal and remained altered for the rest of the measured period.
There was a significant correlation (p<0.05, Pearson correlation) between BMI and TG at baseline and at the 1 and 2h time points (Figure 3). The ROC
curve showed that postprandial TG values were not a good predictor of obesity based on BMI; however, they were able to predict non-obesity in the study subjects. Analysis of the ROC curves showed cut-off values for postprandial TG at 149.5 mg/dL (sensitivity: 0.32; specificity: 0.83) and an area under the curve of 0.737 (95% CI: 0.670 to 0.804) (Figure 4).
Figure 1 - Distribution of postprandial TG (triglycerides) (mg/dL) values in non-obese (NO) and obese (O) patients after various time periods (h: hours). The mean values for each group at each assessment time are represented by a horizontal dash (─). The values within the shaded area represent normotriglyceridemic subjects (<150 mg/dL). Comparisons between the NO and O patients revealed significant differences for each time period (*p <0.05, Student's t-test). Comparisons within the same group at different times: NO (#) p <0.05 after 3, 4, 5 and 6 h; (# #) p <0.05 after 4 h; O (+) p <0.05 at 2, 3, 4, 5 and 6 h; (+ +) p <0.05 after 3, 4 and 5 h (repeated ANOVA and post test Tukey measures).
DISCUSSION
Measurements of serum TG levels, when practiced as a screening method, are generally performed in fasting state generally. Several papers proposed that higher and more harmful TG serum levels were observed in the postprandial states. Unfortunately postprandial exams are complex and time consuming and they are not commonly conducted in clinical practice, preventing the screening of population. Obesity by itself is considered a predictor of adverse lipid metabolism alterations on fasting state; however few studies correlated the obesity with postprandial TG lipid profile.
In this report, the TG level on fasting and on postprandial states of patients in normal weight or carrying different degrees of obesity was analyzed. The relationship between elevated TG concentration and the risk of CAD has been well documented (Krieger 1998, Sharrett et al. 2001); however, the effect of TG levels has been referred to as a “forgotten” risk factor by some authors (Austin 1991, Gotto 1998). Most researchers on plasma lipoprotein levels in obese individuals have used the fasting state, and postprandial lipoproteins are generally neglected (Couillard et al. 1998).
However, postprandial TG measurements are related to the development of atherosclerosis (Bansal et al. 2007). Increased levels of non-fasting TG may indicate the presence of increased levels of atherogenic remnant lipoproteins (Zilversmit 1979), which can penetrate the endothelial cell layer and reside in the sub endothelial space (Patsch et al. 1992, Rapp et al. 1994, Proctor and Mamo 1998, Ginsberg 2002), which constitutes a CAD risk (Kolovou et al. 2011). In our research, we analyzed the TG levels of patients of normal weight and patients with varying degrees of obesity in both the fasting and postprandial states.
An analysis performed after a lipid overload revealed that individuals who apparently presented TG levels above 150 mg/dL (on fasting state), considered normal, had an important increase in their TG levels. The quantification of postprandial lipemia, including both the extent and the duration of higher TG levels after a lipid intake, could be viewed as the most accurate method for measuring TG levels (Patsch et al. 1992). According to Patsch et al. (1992), the postprandial but not fasting TG levels exhibited an association with CAD that was statistically independent and stronger than that of HDL-cholesterol.
Thus, we want to emphasize the importance of measuring lipid profiles when patients (obese or non-obese) are in a non-fasting state. Measuring postprandial lipemia could be considered a powerful tool for studying abnormal lipid profiles. Our results showed that TG levels peaked 4 h after the standardized high-fat meal, corroborating previous studies (Boquist et al. 1999, Bansal et al. 2007). Stampfer et al. (1996) showed that plasma TG levels measured 3 to 4 h after a meal were better than fasting plasma TG levels at predicting future cases of myocardial infarction. Normally, measuring postprandial TG is time-consuming because blood samples are taken for a 6 h period after a lipid overload, but conducting examinations at a fasting baseline and 4 h after the meal could
be sufficient to predict postprandial TG values, according to Kolovou et al. (2011), as can be seen in our study too. Rector et al. (2009) have suggested that an abbreviated single-point method could be a useful addition to clinical risk factor assessments. Furthermore, Patsch et al. (1992) demonstrated that one late postprandial TG measurement may be sufficient to characterize postprandial lipemia, providing a methodology simple enough for future screening. Generally, TG values return to baseline fasting levels 10 h after the lipid overload (Cohn et al. 1988), which could explain the down fluctuation observed in our analysis after 5-6 h, in both groups. People are in a non-fasting state for most of the day, and even healthy subjects are in a state of postprandial hypertriglyceridemia most of the time due to meal frequency. As observed in Figure 1, even non-obese subjects may have an abnormal lipid profile (TG levels ≥150 mg/dL), another indication of the importance of postprandial studies. Moreover, after the lipid overload, we observed that even some of the non-obese subjects had postprandial responses that exceeded acceptable TG levels (≤220 mg/dL) (Kolovou et al. 2011). Schiavo and colleagues (2003) reported that TG levels can fluctuate depending on which day of the week they are measured. Measurements taken on Mondays were always higher than measurements taken on Fridays, indicating that weekend meals tend to influence the results. Therefore, the 12 h fasting period commonly recommended before testing is not sufficient to explain the lipid profile of a patient (Schiavo et al. 2003).
Our data suggested that there is a correlation between BMI and TG level in the postprandial state at baseline and at 1 and 2 h post-meal. Carneiro et al. (2003) and Cercato et al. (2004) reported that fasting plasma TG levels were higher in individuals with more body fat when compared to leaner individuals. In this present study, the TG level measurements taken after a meal over a 3 h period did not show a correlation with body weight.
TG levels > 150 mg/dL are a primary marker for atherogenic factors as well as components of metabolic syndrome, such as elevated blood pressure, insulin resistance, elevated LDL-cholesterol levels and low HDL-cholesterol levels (NCEP 2001). In some cases of hypertriglyceridemia, there is a genetic defect that alters TG metabolism (Jeppesen et al. 1998). Other influencing factors include oral contraceptives, diuretics, diabetes mellitus, alcohol, and exercise (AbouRjaili et al. 2010). Waist circumference was not recorded during interviews; we used BMI as a substitute for waist circumference. The BMI measurements used in this study are acceptable as per the WHO criteria, but it is not sufficient for the NCEP guidelines. However, the most important aspect of this research is that it represents a new perspective on TG metabolism using postprandial measurements as indicators of metabolic risk. Nevertheless, factors such as environmental, behavioral and genetic characteristics must be considered. Furthermore, we emphasize that all the subjects who participated in this study presented normal glucose blood levels, but we did not measure insulin resistance in order to compare this data with TG levels. Total cholesterol, HDL and LDL-cholesterols levels were not measured either. Some reports indicated that TG levels could be considered an independent risk factor. Jeppesen et al. (1998) reported that fasting hypertriglyceridemia was a strong predictor of CAD independent of other risk factors, including HDL-cholesterol. Other report showed that elevated TG level was associated with a 30% increase in CAD risk in men and a 75% increase in CAD risk in women and adjustment for HDL-C and other risk factors attenuated these risks but did not render them non-significant (Hokanson and Austin 1996).
metabolism, even within this small sample. This observation reinforces the importance of testing for hypertriglyceridemia after 4 h of standardized caloric intake.
ACKNOWLEDGMENTS
This study was financed by Coordenação de Aperfeiçoamento de Pessoal de Nível Superior (CAPES), Fundação Araucária (Fundação Arau-cária de Apoio ao Desenvolvimento Científico e Tecnológico do Estado do Paraná), Conselho Nacional de Desenvolvimento Científico e Tecnológico (CNPq) and SETI/UGF (Secretaria de Estado da Ciência, Tecnologia e Ensino Superior/ Unidade Gestora do Fundo do Paraná).
RESUMO
O objetivo deste estudo foi analisar a correlação entre níveis séricos de triglicérides (TG) em pacientes obesos
e não obesos em estado pós-prandial simulado. Os
grupos apresentavam níveis de TG em jejum < 150 mg/ dL. Após 12 h de jejum, os indivíduos ingeriram uma sobrecarga lipídica e o sangue foi coletado. A variação entre os picos dos níveis de TG em jejum e em estado
pós-prandial foi analisada. Os picos pós-prandiais de
TG ocorreram 4 h depois da sobrecarga lipídica nos 2 grupos. Após a refeição, grande parte dos indivíduos
não obesos permaneceu dentro da normalidade em
relação aos níveis de TG, mas os valores para os obesos permaneceram elevados. Houve uma correlação significativa entre Índice de Massa Corporal (IMC) e TG até 2 h após a refeição, mas os dados não mostraram correlação após 3 h. De acordo com a curva ROC
(receiver-operating characteristics), os valores de TG pós-prandiais não são um bom indicador de obesidade
(baseado no IMC), mas são bons indicadores de não obesidade entre os indivíduos. Este trabalho reforça a importância de se medir níveis pós-prandiais de TG em
obesos e não obesos, já que alguns pacientes não obesos provavelmente apresentavam um metabolismo alterado de gordura, indicando que este tipo de exame poderia ser um indicador de risco metabólico.
Palavras-chave: índice de massa corporal,
metabo-lismo de lipídeos, fator de risco, curva ROC.
REFERENCES
ABOURJAILI G, SHTAYNBERG N, WETZ R, COSTANTINO T AND ABELA GS. 2010. Current concepts in triglyceride metabolism, pathophysiology, and treatment. Metabolism 59: 1210-1220.
AUSTIN MA. 1991. Triglyceride and coronary heart disease. Arterioscler Thromb 11: 2-14.
AUSTIN MA, HOKANSON JE AND EDWARDS KL. 1998. Hypertriglyceridemia as a cardiovascular risk factor. Am J Cardiol 81: 7B-12B.
BANSAL S, BURING JE, RIFAI N, MORA S, SACKS FM AND RIDKER PM. 2007. Fasting compared with nonfasting triglycerides and risk of cardiovascular events in women. JAMA 298: 309-316.
BJÖRNTORP P. 1992. Abdominal fat distribution and disease: an overview of epidemiological data. Ann Med 24: 15-18. BOQUIST S, RUOTOLO G, TANG R, BJÖRKEGREN J, BOND MG,
DE FAIRE U, KARPE F AND HAMSTEN A. 1999. Alimentary lipemia, postprandial triglyceride-rich lipoproteins, and common carotid intima-media thickness in healthy, middle-aged men. Circulation 100: 723-728.
CARNEIRO G, FARIA AN, RIBEIRO-FILHO FF, GUIMARÃES A, LERÁRIO D, FERREIRA SRG AND ZANELLA MT. 2003. Influence of body fat distribution on the prevalence of arterial hypertension and other cardiovascular risk factors in obese patients. Rev Assoc Med Bras 49: 306-311. CERCATO C, MANCINI MC, ARGUELLO AMC, PASSOS VQ,
VILLARES SMF AND HALPERN A. 2004. Systemic hypertension, diabetes mellitus, and dyslipidemia in relation to body mass index: evaluation of a Brazilian population. Rev Hosp Clin Fac Med S Paulo 59: 113-118. CHEN YD, SWAMI S, SKOWRONSKI R, COULSTON A AND
REAVEN GM. 1993. Differences in postprandial lipemia between patients with normal glucose tolerance and noninsulin-dependent diabetes mellitus. J Endocrinol Metab 76: 172-177.
COHN JS, MCNAMARA JR, COHN SD, ORDOVAS JM AND SCHAEFER EJ. 1988. Plasma apolipoprotein changes in the triglyceride-rich lipoprotein fraction of human subjects fed a fat-rich meal. J Lipid Res 29: 925-936.
COUILLARD C, BERGERON N, PRUD´HOMME D, BERGERON J, TREMBLAY A, BOUCHARD C, MAURIÈGE P AND DESPRÉS JP. 1998. Postprandial triglyceride response in visceral obesity in men. Diabetes 47: 953-960.
EXECUTIVE SUMMARY OF THE THIRD REPORT OF THE NATIONAL CHOLESTEROL EDUCATION PROGRAM (NCEP). 2001. Expert Panel on detection, evaluation and treatment of high blood cholesterol in adults (Adult Treatment Panel III). JAMA 285: 2486-2497.
GOTTO AM. 1998. Triglyceride: the forgotten risk factor. Circulation 97: 1027-1028.
GROOT PH, VAN STIPHOUT WA, KRAUSS XH, JANSEN H, VAN TOL A, VAN RAMSHORST E, CHIN-ON S, HOFMAN A, CRESSWELL SR AND HAVEKES L. 1991. Postprandial lipoprotein metabolism in normolipidemic men with and without coronaryartery disease. Arterioscler Thromb Vasc Biol 11: 653-662.
HOKANSON JE AND AUSTIN MA. 1996. Plasma triglyceride level is a risk factor for cardiovascular disease independent of high-density lipoprotein cholesterol level: a meta-analysis of population-based prospective studies. J Cardiovasc Risk 3: 213-229.
HU D ET AL. 2000. Effects of obesity and body fat distribution on lipids and lipoproteins in nondiabetic american indians: the strong heart study. Obes Res 8: 411-421.
JEPPESEN J, HEIN HO, SUADICANI P AND GYNTELBERG F. 1998. Triglyceride concentration and ischemic heart disease: an eight-year follow-up in the Copenhagen Male Study. Circulation 97: 1029-1036.
KISSEBAH AH AND KRAKOWER GR. 1994. Regional adiposity and morbidity. Physiol Rev 74: 761-811.
KOLOVOU GD, MIKHAILIDIS DP, KOVAR J, LAIRON D, NORDESTGAARD BG, OOI TC, PEREZ-MARTINEZ P, BILIANOU H, ANAGNOSTOPOULOU K AND PANOTOPOULOS G. 2011. Assessment and clinical relevance of non-fasting and postprandial triglycerides: An Expert Panel Statement. Curr Vasc Pharmacol 9: 258-270.
KRIEGER M. 1998. The best of cholesterols, the worst of cholesterols: a tale of two receptors. Proc Natl Acad Sci 95: 4077-4080.
LEWIS GF, O’MEARA NM, SOLTYS PA, BLACKMAN JD, IVERIUS PH, DRUETZLER AF, GETZ GS AND POLONSKY KS. 1990. Postprandial lipoprotein metabolism in normal and obese subjects: comparison after the vitamin A fat-loading test. J Clin Endocrinol Metab 71: 1041-1050.
MILLER M, SEIDLER A, MOALEMI A AND PEARSON TA. 1998. Normal triglyceride levels and coronary artery disease events: The Baltimore Coronary Observational Long-Term Study. J Am Coll Cardiol 31: 1252-1257.
PATSCH JR, MIESENBOCK G, HOPFERWIESER T, MUHLBERGER V, KNAPP E, DUNN JK, GOTTO JrAM AND PATSCH W. 1992. Relation of triglyceride metabolism and coronary artery disease. Studies in the postprandial state. Arterioscler Thromb Vasc Biol 12: 1336-1345.
PROCTOR SD AND MAMO JC. 1998. Retention of fluorescent labelled chylomicron remnants within the intima of the arterial wall-evidence that plaque cholesterol may be derived from post-prandial lipoproteins. Eur J Clin Invest 28: 497-503.
RAPP JH, LESPINE A, HAMILTON RL, COLYVAS N, CHAUMETON AH, TWEEDIE-HARDMAN J, KOTITE L, KUNITAKE ST, HAVEL RJ AND KANE JP. 1994. Triglyceride-rich lipoproteins isolated by selected-affinity antiapolipoprotein B immunosorption from human atherosclerotic plaque. Arterioscler Thromb Vasc Biol 14: 1767-1774.
RECTOR RS, LINDEN MA, ZHANG JQ, WARNER SO, ALTENA TS, SMITH BK, ZIOGAS GG, LIU Y AND THOMAS TR. 2009. Predicting postprandial lipemia in healthy adults and in at-risk individuals with components of the cardiometabolic syndrome. J Clin Hypertens 11: 663-671.
SCHIAVO M, LUNARDELLI A AND OLIVEIRA Jr. 2003. The influence of diet on the triglycerides serum concentration. J Bras Patol Med Lab 39: 283-288.
SHARRETT AR, BALLANTYNE CM, COADY SA, HEISS G, SORLIE PD, CATELLIER D AND PATSCH W. 2001. Coronary heart disease prediction from lipoprotein cholesterol levels, triglyceride, lipoprotein (a), apolipoprotein A-I and B, and HDL density subfractions. Circulation 104: 1108-1113. STAMPFER MJ, KRAUSS RM, MA J, BLANCHE PJ, HOLL LG
AND SACKS FM. 1996. A prospective study of triglyceride level, low-density lipoprotein particle diameter, and risk of myocardial infarction. JAMA 276: 882-888.
STAVENOW L AND KJELLSTROM T. 1999. Influence of serum triglyceride levels on the risk for myocardial infarction in 12,510 middle aged males: Interaction with serum cholesterol. Atheroscler 147: 243-247.
TEIXEIRA PJ, SARDINHA LB, GOING SB AND LOHMAN TG. 2001. Total and regional fat and serum cardiovascular disease risk factors in lean and obese children and adolescents. Obes Res 9: 432-442.
VAN WIJK JPH, HALKES CJM, ERKELENS DW AND C ASTRO-CABEZAS M. 2003. Fasting and daylong triglycerides in obesity with and without type 2 diabetes. Metabolism 52: 1043-1049.
WEINTRAUB MS, GROSSKOPF I, RASSIN T, MILLER H, CHARACH G, ROTMENSCH HH, LIRON M, RUBINSTEIN A AND IAINA A. 1996. Clearance of chylomicron remnants in normolipidaemic patients with coronary artery disease: Case control study over three years. BMJ 312: 936-939. WORLD HEALTH ORGANIZATION. 1998. Obesity: Preventing
and Managing the Global Epidemic: report of a WHO consultation on obesity. World Health Organization, Geneva, 276 p.