Acta Scientiarum
http://periodicos.uem.br/ojs/acta ISSN on-line: 1807-8621
Doi: 10.4025/actasciagron.v40i1.39324 GENETICS AND PLANT BREEDING
Strategies to select soybean segregating populations with the goal
of improving agronomic traits
Fabiana Mota da Silva*, Elise de Matos Pereira, Bruno Henrique Pedroso Val, Dilermando Perecin, Antonio Orlando Di Mauro and Sandra Helena Unêda-Trevisoli
Departamento de Produção Vegetal, Universidade Estadual Paulista, Via de Acesso Prof. Paulo Donato Castellane, s/n., 14884-900, Jaboticabal, São Paulo, Brazil. *Author for correspondence. E-mail: motaagro@hotmail.com
ABSTRACT. The success of breeding programs depends on selection procedures and on the breeding methods adopted for selecting segregating populations. The objective of this study was to evaluate the efficiency of the Bulk method with selection in the F3 generation (BulkF3) compared to that of Bulk method as well as determine
the most effective selection strategy in terms of genetic gain. Twenty segregating populations were selected by two methods. The 60 best families of each method were selected according to their average agronomic performance. An augmented block design was used. The following agronomic traits were evaluated: insertion height of first pod, plant height at maturity, number of branches and of pods per plant, 100-seed weight, and grain yield. For comparison of the methods, genetic component estimates, genetic gain and predicted breeding values were calculated using mixed models (REML and BLUP). The results showed the families obtained with the BulkF3 method were more productive, showed suitable plant height, a larger number of branches and pods, and higher 100-seed weight. The BulkF3 method was found to be an effective selection strategy for soybean improvement.
Keywords: genetic gain; Glycine max;breeding methods; mixed model.
Estratégias de seleção em populações segregantes de soja com características
agronômicas desejáveis
RESUMO. O sucesso dos programas de melhoramento genético depende dos procedimentos de seleção e dos métodos de melhoramento adotados para a condução das populações segregantes. O objetivo deste trabalho foi avaliar a eficiência do método Bulk com seleção em F3, (BulkF3) em relação ao método Bulk, bem como
comparar qual estratégia de seleção é mais eficiente em termos de ganho genético. Para a realização do trabalho foram utilizadas 20 populações segregantes, conduzidas pelos dois métodos. Foram selecionadas 60 melhores famílias de cada método, de acordo com a performance média agronômica. O delineamento utilizado foi de blocos aumentados. Foram avaliadas as seguintes características agronômicas: altura da inserção da primeira vagem e da planta na maturidade, número de ramos e de vagens por planta, peso de cem sementes e produção de grãos. Para efeito de comparação dos métodos, foram utilizadas as estimativas dos componentes genéticos, ganho genético e predição dos valores genéticos, calculados via modelos mistos (REML e BLUP). Os resultados demonstraram que as famílias obtidas pelo método BulkF3 foram as mais produtivas, com menor porte, maior número de ramos, vagens e peso de cem sementes. O método BulkF3 mostrou-se uma estratégia de condução eficiente para a seleção no melhoramento genético de soja.
Palavras-chave: ganho genético; Glycine max;métodos de melhoramento; modelo misto.
Introduction
Soybean (Glycine max (L.) Merrill) is an economically important crop worldwide. Brazil is the second largest producer of this legume with a production of 112 million tons (Conab, 2017). In this respect, most of this production is due to the cultivation of genetically modified soybean, with 111 million tons produced in an area of 33.87 million hectares (Cêleres, 2017). Soybean production is increasing in Brazil, mainly as a
result of the efforts of plant breeding programs (Borém & Miranda, 2009; Ramalho, Abreu, Santos, & Nunes, 2012), which have led to the improvement of different traits of agronomic interest, including increases in productivity, lodging resistance, adaptability to different soil and climatic regions, tolerance to herbicides, and resistance to the main pests and diseases.
gain and on breeding methods adopted for selecting segregating populations, as well as on the effective exploration of genetic variability released over generations and how much of this phenotypic variability is due to genetic and environmental differences (Raposo, Ramalho, & Abreu, 2000; Ramalho et al., 2012). Different selection strategies of populations have been employed in breeding programs in attempts to obtain lines with superior agronomic traits (Martin & Geraldi, 2002; Borém & Miranda, 2013; Ramalho et al., 2012). In this respect, an efficient estimation of genetic parameter estimates such as variance components, heritability and genetic gain are of the utmost importance for the guidance of breeding programs to obtain promising genotypes from segregating populations (Farias Neto, Clememt, & Resende, 2013; Silva, Melo, Pereira, & Melo, 2014).
Traditional breeding methods of self-pollinating plants are used to develop new soybean cultivars through the formation, conducting and selection of genotypes. Among the methods for selecting segregating populations, the Bulk method is commonly used in breeding programs because of its simplicity, easy handling of populations, rapidity, and low cost. However, this method has the disadvantage in that promising progenies used in the advancement of subsequent generations may be lost from one generation to the next due to sampling deficiencies (Allard, 1971; Ramalho et al., 2012). In attempts to overcome this obstacle, Frey (1954) proposed a Bulk method with selection in F2 or F3
families in which different traits of interest are selected in each generation. This method involves harvest of individual plants in the F3 generation,
with each plant giving origin to a family that will be used to form the next generation. The Bulk method with F3 selection has the advantage of exploring 1.5
of the additive variance, thus increasing its utilization by 50%. Selection in the F3 generation is
therefore more advantageous and, consequently, more appropriate than selection in the F2 generation
(Pimentel et al., 2014; Ramalho et al., 2012; Resende, 2002).
The Bulk method with selection in the F3
generation is commonly used in most breeding programs of bean (Raposo et al., 2000; Costa, Rava, & Zimmermann, 2002; Silva et al., 2008; Ramalho et al., 2012) and wheat (Wang et al., 2003). However, studies demonstrating the efficiency of this method in soybean crops are rare. Therefore, the objective of this study was to evaluate the efficiency of the bulk method with selection in the F3 generation (BulkF3) compared
to that of the traditional Bulk method with respect to traits of economic interest in soybean improvement, as well as to determine the most effective selection strategy in terms of genetic gain.
Material and method
The experiments were conducted in three agricultural years (2011/2012, 2012/2013, and 2013/2014) on the Farm for Teaching, Research and Extension of the Universidade Estadual Paulista “Júlio de Mesquita Filho” (UNESP-FCAV), Jaboticabal Campus, northern region of the State of São Paulo, Brazil.
The segregating populations were obtained by biparental crossings using conventional lines as parents, which were commercial Monsoy cultivars (Monsanto) carrying the RR gene. The lines belonged to the breeding program of the UNESP-FCAV, had good agronomic attributes, and were adapted to the cultivation conditions of São Paulo State. For this study, 20 segregating populations that generated the respective families in the F3, F4, and F5
generations, as well as two control cultivars (CD 216 and V-Max), were used (Table 1).
Table 1. Genealogy and identification of 60 families obtained from 20 soybean segregating populations.
POP IF GENEALOGY POP IF GENEALOGY
1 3,4,5 JAB.00-04-1/5A4D x M 8230 RR 11 33,34,35 JAB.00-05-1/5C3B x M 8336 RR 2 6,7,8 JAB.00-03-3/1H1D x M 7908 RR 12 36,37,38 JAB.00-05-1/5C3B x M 8360 RR 3 9,10,11 JAB.00-03-3/1H2D x M 8360 RR 13 39,40,41 JAB.00-05-8/2D3C x M 7211 RR 4 12,13,14 JAB.00-01-21/4M1D x M 8336 RR 14 42,43,44 JAB.00-05-8/2D3C x M 7636 RR 5 15,16,17 JAB.00-05-5/4A2D x M 7578 RR 15 45,46,47 JAB.00-05-8/2D3C x M 7908 RR 6 18,19,20 JAB.00-05-5/4A2D x M 7908 RR 16 48,49,50 JAB.00-05-8/2D3C x M 8336 RR 7 21,22,23 JAB.00-05-5/4A2D x M 8221 RR 17 51,52,53 JAB.00-06-2/3I3D x M 8230 RR 8 24,25,26 JAB.00-05-1/5C3B x M 7211 RR 18 54,55,56 JAB.00-06-2/3I3D x M 8236 RR 9 27,28,29 JAB.00-05-1/5C3B x M 7639 RR 19 57,58,59 JAB.00-02-30/1G4A x M 8360 RR 10 30,31,32 JAB.00-05-1/5C3B x M 8211 RR 20 60,61,62 JAB.00-02-3/6A4D x M 8360 RR
POP: Populations; IF: Family identification; Cultivars 1: CD216 and 2: V-Max.
Strategies for selecting soybean segregating populations Page 3 of 9
Families were selected from the F3 to the F5
generation using two breeding methods: the Bulk method with selection in the F3 generation (BulkF3)
and the traditional Bulk method, in which 60 families were selected per method according to their average agronomic performance. A total of 122 treatments were evaluated, including 120 segregating families and two controls (Coodetec 216 and V-Max). Generation advancement using the different selection methods and evaluation of the families were performed in three agricultural years (2011/12, 2012/13, and 2013/14).
The experiment using the BulkF3 method was started in the F3 generation by sowing 1,800 plants
from 20 segregating populations. Each population consisted of a variable number of lines depending on the number of seeds. During harvest, six plants from each line were selected, with each plant generating one family. The seeds derived from each family were used to obtain the next generations (F4 and F5). This method
is referred to as BulkF3 because selection occurs in the F3 generation.
In the experiment using the traditional Bulk method, the plants were harvested in bulk, i.e., all seeds from the F3 to F5 generation are mixed together. For
sowing, one seed sample was removed to obtain the next generation.
For comparison of the methods, 360 plants were chosen; of these, 60 families were selected. This procedure was repeated for each generation until the F5. Approximately 16.67% of the best families were
selected in each generation based on their average agronomic performance.
The augmented block design, in which the population were arranged in 5 m long rows spaced 0.5 m apart was used for the two experiments. The controls were intercalated between the populations evaluated. The seeds were sown mechanically in furrows in November, and 300 kg ha-1 of 2-20-20
fertilizer was applied. The sowing density was 20 seeds per meter. All agricultural procedures followed the technical recommendations for soybean crop (Embrapa, 2013).
The following agronomic traits were evaluated for the selection of the six plants: insertion height of first pod (IHP): distance, in cm, from the soil surface to insertion of the first pod in the main stem; plant height at maturity (PHM): distance, in cm, from the soil surface to the last node of the main stem at maturity; number of branches (NB): total number of branches on the main stem of the plants; number of pods per plant (NP): total number of pods with formed seeds; 100-seed weight (100SW): weight, in grams, of 100 seeds of an individual plant determined after
threshing the pod , and grain yield (GY): total seed weight, in grams, after threshing.
Individual and combined analyses of variance were used for the traits studied. For the combined analysis, the means adjusted for the families in each year were calculated, in addition, the effects of block and generation were included as fixed effects and the effects of family were included as random effects.
The genetic gain provided by the methods and t-tests were used for comparison of the selection methods. Mixed models were applied to estimate the genetic parameters (Henderson, Kempthorne, Searle, & Krosigk, 1959). Variance components were estimated by the restricted maximum likelihood method (REML) developed by Patterson and Thompson (1971). The best linear unbiased prediction (BLUP) was used for the prediction of breeding values. The genetic parameters were estimated using the Mixed procedure of Statistical Analysis System software SAS 9.3 (2011) and analysis of variance was performed using the PROC GLM procedure of the same software.
The broad-sense heritability was calculated using the following equation: ℎ = 100, where: ℎ is the
broad-sense heritability, is the genotypic variance, and is the phenotypic variance. The genetic gains for each trait and generation were estimated taking into considering a selection pressure of 16.67% based on the average agronomic performance calculated with the following equation: = × ℎ , where: is the genetic gain; is the selection differential, which corresponds to the mean of the 10 best families according to the t-test minus the mean of the families, and ℎ is the heritability.
For PHM and IHP, decreases in genetic gain were desired considering that breeding is generally aimed at genotypes with medium heights (80 to 100 cm) and an insertion height of 12 cm or higher, both of which are suitable for mechanical harvesting. Thus, for these traits, a decrease in values during selection was desired since higher values are present in the data.
For better interpretation of the results in terms of genetic gain, for methods comparisons, a confidence interval was constructed using the following equation (Resende, Araújo, Sampaio, & Wiecheteck, 1995):
Table 2. Combined analysis of variance for the insertion height of first pod (IHF), plant height at maturity (PHM), number of branches (NB), number of pods per plant (NP), 100-seed weight (100SW) and grain yield (GY) of the families obtained by the BulkF3 and Bulk methods.
VF
Mean squares IHP
(cm)
PHM (cm)
NB NP 100SW
(g)
GY (g) Block 3.56 ns 48.57 ns 0.31ns 149.55ns 3.49 ns 10.08 ns
Control vs Fam. 79.57** 4560.52** 162.83** 121095.39** 59.68** 7275.17**
Generation 81.79** 1618.65** 84.52** 29807.80** 65.47** 4764.84**
Family 17.80** 467.66** 3.55** 1620.04** 8.23** 89.37**
Methods 4.45 ns
238.63*
15.98* 5367.92* 62.75** 2118.46**
Fam. x Methods 12.85** 123.45** 1.69ns 774.95* 3.04 ns 29.88 ns
Fam. x Gen. 14.15** 160.63** 2.22* 1201.42** 4.06* 88.18** Gen. x Method 36.98* 1167.94** 19.85* 27289.75** 3.79 ns
2213.82** Control 0.01 ns 371.37 ns 189.47** 116.26ns 10.83* 35.20ns
Error 6.89 57.96 1.29 420.33 2.91 27.73
R2 0.76 0.87 0.84 0.88 0.73 0.89
CV% 19.54 7.67 31.34 21.95 11.74 19.78
** Significant at 1%; * significant at 5%; ns not significant at 5%; CV%: coefficient of variation and R2: coefficient of determination.
Result and discussion
The combined analysis of variance revealed a significant effect (p < 0.01) of generation on all traits studied, characterizing the influence of generations. A significant difference (p < 0.01) was also detected for the effect of family on all traits, indicating the existence of genetic variability between families irrespective of the selection method used. Differences were observed between families derived from the different populations, with at least one family differing from the others (Table 2).
The selection method as a source of variation was significant at the 5% level for PHM, NB and NP and at the 1% level for 100SW and GY, indicating differences between the selection methods used to obtain families of the segregating populations (Table 2).
With respect to interaction effects (Table 2), the family x method interaction was significant (p < 0.01) for IHP and PHM, while a significant interaction at the 5% level was observed for NP. However, this effect was not significant for NB, 100SW or GY. The effect of this interaction indicates differences in the responses of soybean families obtained with either method.
The family x generation interaction was significant at the 1% level for IHP, PHM, NB, and GY and at the 5% level for NB and 100SW, demonstrating differences in the behavior of the families among the three generations (Table 2). It should be noted that this interaction altered the ranking of families between methods, as the best families obtained with the BulkF3 method were not necessarily the same as those obtained with the Bulk method. For example, among the 10 best families for GY, family 21 was the most productive according to the BulkF3 method (Table 3), while the Bulk method the most productive was family 57 (Table 4). Interactions between generation and
family have been reported in the literature (Raposo et al., 2000; Menezes Júnior et al., 2011).
With respect to the generation x method interaction, significant effects were observed for IHP, PHM, NP, NB, and GY (Table 2). These results demonstrate the existence of variability between families within each method and demonstrate that the methods adopted generated different families, i.e., there was no agreement in the behavior of families between generations or methods. Similar results have been reported by Jost, Ribeiro, Rosa, Possobom, and Mazieiro (2014), Mendes, Ramalho, and Abreu (2012), Rosal, Ramalho, Gonçalves, and Abreu (2000), Silva, Melo, Melo, Bassinelo, and Pereira (2013), who compared the bulk method and bulk selection with families in the F2 and F3 generation of common bean
crops.
The coefficients of variation ranged from 7.67% for PHM to 31.24% for NP (Table 2) and were compatible with the values reported by other authors (Bárbaro et al., 2007; Lima, Crusciol, Cavariani, & Nakagawa, 2009; Pinheiro et al., 2013).
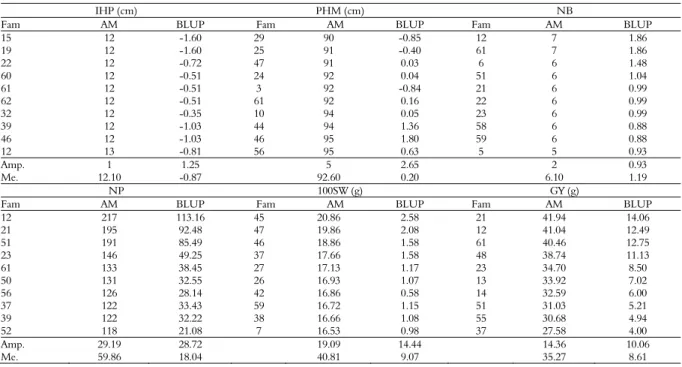
Tables 3 and 4 show the phenotypic values based on the adjusted means and the genotypic values predicted by the BLUP, respectively, of the 10 best families obtained with the BulkF3 and Bulk methods in the F5 generation. In both methods, there was little
agreement among families within each generation, i.e., the phenotypic values and predicted breeding values differed between the Bulk and BulkF3 methods. These differences in families over generations are probably due to generation x family interaction effects. Lima, Ramalho, and Abreu (2012) and Mendes et al. (2012), also described the occurrence of this type of interaction.
Strategies for selecting soybean segregating populations Page 5 of 9
3). The BulkF3 method also provided a greater amplitude for the following traits: GY (14.36 g), 100SW (4.33 g), and NP (99.0) (Table 3).
The predicted genotypic values obtained with the BulkF3 method were generally better than those from the bulk method for the identification of superior families. In addition, the best phenotypes had also the best genotypic values. A difference in
the ranking of the families according to their phenotypic and genotypic values was observed between methods. Population 4 provided the largest number of productive families in both selection methods. Costa et al. (2002) also reported that selection methods of segregating populations differ in terms of identification of more productive families.
Table 3. Phenotypic and genotypic values of the top 10 families obtained by the BulkF3 method in the F5 generation.
IHP (cm) PHM (cm) NB
Fam AM BLUP Fam AM BLUP Fam AM BLUP
15 12 -1.60 29 90 -0.85 12 7 1.86
19 12 -1.60 25 91 -0.40 61 7 1.86
22 12 -0.72 47 91 0.03 6 6 1.48
60 12 -0.51 24 92 0.04 51 6 1.04
61 12 -0.51 3 92 -0.84 21 6 0.99
62 12 -0.51 61 92 0.16 22 6 0.99
32 12 -0.35 10 94 0.05 23 6 0.99
39 12 -1.03 44 94 1.36 58 6 0.88
46 12 -1.03 46 95 1.80 59 6 0.88
12 13 -0.81 56 95 0.63 5 5 0.93
Amp. 1 1.25 5 2.65 2 0.93
Me. 12.10 -0.87 92.60 0.20 6.10 1.19
NP 100SW (g) GY (g)
Fam AM BLUP Fam AM BLUP Fam AM BLUP
12 217 113.16 45 20.86 2.58 21 41.94 14.06
21 195 92.48 47 19.86 2.08 12 41.04 12.49
51 191 85.49 46 18.86 1.58 61 40.46 12.75
23 146 49.25 37 17.66 1.58 48 38.74 11.13
61 133 38.45 27 17.13 1.17 23 34.70 8.50
50 131 32.55 26 16.93 1.07 13 33.92 7.02
56 126 28.14 42 16.86 0.58 14 32.59 6.00
37 122 33.43 59 16.72 1.15 51 31.03 5.21
39 122 32.22 38 16.66 1.08 55 30.68 4.94
52 118 21.08 7 16.53 0.98 37 27.58 4.00
Amp. 29.19 28.72 19.09 14.44 14.36 10.06
Me. 59.86 18.04 40.81 9.07 35.27 8.61
Fam: Families selected for calculating the genetic gain; AM: adjusted mean; BLUP: best linear unbiased prediction; Amp: amplitude; Me: means; IHF: insertion height of first pod; PHM: plant height at maturity; NB: number of branches; NP: number of pods per plant; 100SW: 100-seed weight, and GY: grain yield.
Table 4. Phenotypic and genotypic values of the top 10 families obtained by the Bulk method in the F5 generation.
IHP (cm) PHM (cm) NB
Fam AM BLUP Fam AM BLUP Fam AM BLUP
5 12 -0.40 25 91 -3.72 6 6 1.00
26 12 0.18 7 93 -5.17 57 6 0.79
51 12 -0.43 19 93 -2.46 7 5 0.63
54 12 -0.43 20 93 -2.46 14 5 0.67
32 12 0.54 8 94 -4.74 52 5 0.52
44 12 0.18 46 94 -2.04 29 5 0.53
11 13 0.40 50 94 -1.86 58 5 0.42
14 13 0.84 18 94 -2.03 11 4 0.26
23 13 0.98 62 94 -4.41 39 4 0.43
27 13 0.98 28 95 -2.01 13 4 0.29
Amp. 1 1.38 4 -3.16 2 0.74
Me. 12.40 0.28 93.50 -3.09 4.90 0.55
NP 100SW (g) GY (g)
Fam AM BLUP Fam AM BLUP Fam AM BLUP
57 135 40.97 10 18.13 3.73 57 32.24 8.46
39 132 36.67 12 16.94 2.70 54 29.02 4.94
42 132 36.67 33 16.91 2.93 53 30.93 6.18
52 125 27.93 28 16.78 2.39 52 27.99 4.28
53 120 24.42 45 16.31 1.92 42 25.52 4.27
54 117 22.31 46 16.29 1.90 39 27.62 5.62
33 112 26.76 13 16.13 2.06 16 25.90 3.50
56 112 18.76 5 16.08 2.11 14 35.42 9.65
26 108 17.85 32 15.61 1.90 13 25.67 3.35
29 105 15.74 43 15.28 1.10 12 32.52 7.78
Amp. 30 25.23 2.5 2.63 6.72 6.30
Me. 119.80 26.81 16.45 2.27 29.28 5.80
For most traits, a higher genetic variance was obtained with the BulkF3 method (Table 5). This fact is important because genetic variability is directly related to genetic gain. In the BulkF3 method, the genetic variance ranged from 1.06 for NB to 1,179.15 for NP, while in the Bulk method, the genetic variance ranged from 0.34 for NB to 404.03 for NP, considering all traits.
In general, the heritability estimates were of medium to high magnitude for most of the traits (Table 5), indicating successful selection. The heritability estimates obtained with the BulkF3 method ranged from 44% for PHM to 88% for NP. In the traditional Bulk method, heritability ranged from 38% for 100SW to 80% for IHP (Table 5). Similar estimates have been reported by Rocha et al. (2015) for PHM and by Chung et al. (2003) and Carvalho, Fristche Neto, and Geraldi (2008) for GY using the BLUP.
Table 5. Genetic parameter estimates for the BulkF3 and Bulk methods in the F5 generation.
Traits Method Genetic parameter σ σ h2 Accuracy
Insertion height of first pod BulkF3 6.37 1.71 0.78 8.83 Bulk 5.78 1.47 0.80 8.94
Plant height at maturity BulkF3 56.51 70.88 0.44 6.63 Bulk 55.48 74.43 0.43 6.56
Number of branches BulkF3 1.06 0.72 0.60 7.75 Bulk 0.34 0.57 0.38 6.16
Number of pods per plant BulkF3 1179.15 157.31 0.88 9.38 Bulk 404.03 170.27 0.70 8.37
100-seed weight BulkF3 2.03 2.02 0.50 7.07 Bulk 6.76 1.78 0.79 8.89
Grain yield BulkF3 28.48 8.85 0.77 8.77 Bulk 17.87 9.78 0.65 8.06
σ : Genetic variance, σ : residual variance, and h2: broad-sense heritability.
Higher heritability estimates are associated with greater genetic variability, higher accuracy of selection (Cargnelutti Filho, Storck, & Ribeiro, 2009) and, consequently, a greater chance of successful selection of superior families (Hamawaki et al., 2012; Silva et al., 2014). According to Ramalho et al. (2012), the heritability coefficient is a very useful parameter for breeders because it permits the success of selection and reflects the proportion of phenotypic variation that can be inherited.
A selection method of segregating populations will be more efficient when the magnitude of genetic gain is increased (Raposo et al., 2000). According to Miladinović et al. (2011), genetic gain is considered an indicator of the efficiency of the method. Thus, in addition to the average performance of families, the probability of higher gain with selection should be considered when choosing a selection method. However, the decision of the best method should be based not only on genetic gain but also on the confidence interval of genetic gain (Resende et al.,
1995). According to these authors, the lower limits rather than the upper limits of the confidence interval should be analyzed. Based on this premise, the BulkF3 method resulted in higher genetic gains and extended the lower limit for GY, IHP, PHM, NB, and NP (Table 6). For GY, NB, and NP, the BulkF3 method exhibited a lower limit that was higher than the upper limit obtained with the Bulk method (Table 6).
It should be noted that in the interpretation of confidence intervals, more accurate methods have narrower intervals. In this respect, although the lower limits of the BulkF3 methods were greater than the upper limits of the Bulk method, the amplitude of the confidence intervals was similar. The results of the present study therefore show that, compared with the Bulk method, the BulkF3 method provided higher genetic gain for most traits and that the amplitude of the confidence intervals was similar between both methods (Table 6). It is worth noting that a negative genetic gain is expected for PHM and IHP since height plants of about 80 to 100 cm and with an insertion of the first pod above 12 cm, respectively, are preferred in breeding programs (Sediyama, Teixeira, & Barros, 2015; Sediyama, Teixeira, & Reis, 2013).
Table 6. Rates of genetic gains (GG) and confidence intervals (CI) obtained by the BulkF3 and Bulk methods in the F5
generation.
Traits Method GG CI
Insertion height of first pod BulkF3 -0.88 -1.38 a -0.38 Bulk -0.28 -0.73 a 0.17
Plant height at maturity BulkF3 -0.18 -2.71 a 2.34 Bulk -3.51 -6.04 a -0.98
Number of branches BulkF3 1.29 1.00 a 1.57 Bulk 0.60 0.39 a 0.80
Number of pods per plant BulkF3 55.28 50.33 a 60.23 Bulk 29.76 25.05 a 34.46
100-seed weight BulkF3 1.61 1.16 a 2.06 Bulk 2.29 1.78 a 2.79 Grain yield BulkF3 9.23 8.15 a 10.31
Bulk 6.77 5.69 a 7.85
Results similar to those of the present study, which confirm higher genetic gains with the BulkF3 method compared to bulk and pedigree/bulk selections, were reported by Wang et al. (2003) for wheat using simulated data. Similarly, Silva et al. (2013), who compared Bulk, BulkF3 and SSD selection methods of segregating populations, concluded that the BulkF3 method was the best and most effective method at obtaining bean families based on the results of genetic gain.
Strategies for selecting soybean segregating populations Page 7 of 9
to the end of the selection process (Table 7). In our studies, comparison by the t-tests showed that the BulkF3 method provided the highest means, indicating the superiority of this method compared to the Bulk method (Table 7).
Table 7. Comparison of families obtained from the BulkF3 and Bulk methods throughout the generations with respect to insertion height of first pod (IHF), plant height at maturity (PHM), number of branches (NB), number of pods per plant (NP), 100-seed weight (100SW), and grain yield (GY).
Generation Method IHP PHM NB NP 100SW GY F3 BulkF3 14.25 a 105.87 b 4.00 a 132.32 a 14.69 a 41.40 a
F3 Bulk 14.97 a 104.24 a 2.77 b 95.37 b 14.25 a 27.57 b
F4 BulkF3 13.57 a 98.66 a 4.72 b 95.03 b 16.13 a 31.61 a
F4 Bulk 13.69 a 100.99 b 5.16 a 118.71 a 15.09 b 28.13 b
F5 BulkF3 13.40 a 92.83 a 3.62 a 87.18 a 14.60 a 23.28 a
F5 Bulk 11.94 b 101.66 b 3.09 b 77.11 b 13.54 b 18.93 b
Values within a column followed by the same letters are not significantly different from each other by according to the t-test.
The percentages of gain were calculated for the F5
generation for better visualization of the results. The traits studied and their associated percent gains were follows: IHP (12.22%), PHM (0.91%), NB (17.15%), NP (13.06%), 100SW (0.78%), and GY (22.98%). The highest percent gain was obtained for GY, indicating that the BulkF3 method generated more productive families. These results highlight the superiority of the BulkF3 method over the Bulk method.
Thus, compared with those obtained with the bulk method, the families obtained with the BulkF3 method were more productive at the end of the selection process (F5 generation) and had a suitable height, a
larger number of branches and pods, and a higher 100SW. Similarly, Menezes Júnior et al. (2011) reported that the Bulk selection of families derived from F3 plants is a promising breeding strategy for bean
crops because of the larger number of productive families.
Conclusion
The BulkF3 method constituted an effective strategy for soybean improvement when compared to the traditional Bulk method.
The BulkF3 method is more indicated when the objective is to increase the rate of genetic gain in grain yield.
Acknowledgements
The authors are grateful to the Conselho Nacional de Desenvolvimento Científico e Tecnológico (CNPq) for financial support.
References
Allard, R. W. (1971). Princípios de melhoramento genético das
plantas. São Paulo, SP: Edgard Blücher.
Bárbaro, I. M., Centurion, M. A. P. da, Di Mauro, A. O. D., Unêda-Trevisoli, S. H., Costa, M. M., Muniz, F. R. S., ... Sarti, D. G. P. (2007). Variabilidade e correlações entre produtividade de grãos e caracteres agronômicos de soja com aptidão para cultivo em áreas para reforma de canavial. Científica, 35(2), 136-145.
Borém, A., & Miranda, G. V. (2009). Melhoramento de plantas. 5. ed. Viçosa, MG: UFV.
Borém, A., & Miranda, G. V. (2013). Melhoramento de plantas. 6. ed. Viçosa, MG: UFV.
Cargnelutti Filho, A., Storck, L., & Ribeiro, N. D. (2009). Medidas da precisão experimental em ensaios com genótipos de feijão e de soja. Pesquisa Agropecuária
Brasileira, 44(10), 1225-1231. doi:
10.1590/S0100-204X2009001000003
Céleres. (2017). 3º levantamento de adoção da biotecnologia no
Brasil, safra 2016/17. Retrieved on Apr. 03, 2017 from
http:// http://www.celeres.com.br/ic17-04-projecao-de-safra-soja-abril-2017/ - .pdf
Companhia Nacional de Abastecimento [CONAB]. (2017).
Acomp. Safra Bras. Grãos, v.4 - Safra 2016/17, n.7 - Sétimo
Levantamento, Brasília, p. 1-162, Retrieved on Apr. 04,
2017 from http://www.conab.gov.br/
Carvalho, A. D. F., Fristche Neto, R., & Geraldi, I. O. (2008). Estimation and prediction of parameters and breeding values in soybean using REML/BLUP and least squares.
Crop Breeding and Applied Biotechnology, 8(3), 219-224. doi:
10.12702/1984-7033.v08n03a06
Costa, J. G. C., Rava, C. A., & Zimmermann, F. J. P. (2002). Comparação da eficiência de métodos de seleção em gerações segregantes de feijoeiro-comum considerando a resistência à antracnose e rendimento. Ciência e Agrotecnologia, 26(2), 244-251.
Chung, J., Babka, H. L., Graef, G. L., Staswick, P. E., Lee, D. J., Cregan, P. B., ... Spech, J. E. (2003). The seed protein, oil, and yield QTL on soybean linkage group I. Crop
Science, 43(3), 1053-1067. doi: 10.2135/ cropsci2003.1053
Empresa Brasileira de Pesquisa Agropecuária. [Embrapa]. (2013). Tecnologias de produção de soja – Região Central do
Brasil 2014. Londrina, PR: Embrapa Soja.
Farias Neto, J. N., Clement, C. R., & Resende, M. D. V. (2013). Estimativas de parâmetros genéticos e ganho de seleção para produção de frutos em progênies de polinização aberta de pupunheira no Estado do Pará, Brasil. Bragantia, 72(2), 122-126. doi: 10.1590/S0006-87052013000200002
Frey, K. J. (1954). The use of F2 lines in predicting the
performance of F3 selections in two barley crosses.
Agronomy Journal, 46(12), 541-544.
Hamawaki, O. T., Sousa, L. B., Romanato, F. N., Nogueira, A. P. O., Santos Júnior, C. D., & Polizel, A. C. (2012). Genetic parameters and variability in soybean genotypes.
Comunicata Scientiae, 3(2), 76-83.
Jost, E., Ribeiro, N. D., Rosa, D. P., Possobom, M. T. D. F., & Maziero, S. M. (2014). Methods of selecting common bean lines having high yield, early cycle and erect growth. Revista Ciência
Agronômica, 45(1), 101-110. doi:
10.1590/S1806-66902014000100013
Lima, E. V., CruscioL, C. A. C., Cavariani, C., & Nakagawa, J. (2009). Características agronômicas, produtividade e qualidade fisiológica da soja “safrinha” sob semeadura direta, em função da cobertura vegetal e da calagem superficial. Revista
Brasileira de Sementes, 31(1), 069-080. doi:
10.1590/S0101-31222009000100008
Lima, L. K., Ramalho, M. A. P., & Abreu, A. F. B. (2012). Implications of the progeny x environment interaction in selection index involving characteristics of common bean. Genetics and
Molecular Research, 11(4), 4093-4099. doi:
10.4238/2012.September.19.5
Martin, S. K. S., & Geraldi, I. O. (2002). Comparison of three procedures for early generation testing of soybean. Crop Science, 42(3), 705-709. doi: 10.2135/cropsci2002.7050
Mendes, M. P., Ramalho, M. A. P., & Abreu, A. F. B. (2012). Strategies in identifying individuals in a segregant population of common bean and implications of genotype x environment interaction in the success of selection. Genetics and Molecular
Research, 11(2), 872-880. doi:
10.4238/2012.April.10.3
Menezes Júnior, J. A. N., Carneiro, J. E. S., Silva, V. M. P., Silva, L. C., Peternelli, L. A., & Carneiro, P. C. S. (2011). Common bean breeding to improve red grain lines. Crop Breeding and Applied
Biotechnology, 11(1), 50-58. doi:
10.1590/S1984-70332011000100007
Miladinovic, J., Burton, J. W., Balešević tubić, S., Miladinović, D., Djordjević, V., & Djukić, V. (2011). Soybean breeding: comparison of the efficiency of different selection methods. Turkish
Journal of Agriculture and Forestry, 35(5), 469-480. doi:
10.3906/tar-1011-1474
Patterson, H. D., & Thompson, R. (1971). Recovery of inter-block information when blocks sizes are unequal. Biometrika, 58(3), 545-554. doi: 10.1093/biomet/58.3.545
Pimentel, A. J. B., Guimarães, J. F. R., Souza, M. A., Resende, M. D. V., Moura, L. M., Rocha, J. R. A. S. C., & Ribeiro, G. (2014). Estimação de parâmetros genéticos e predição de valor genético aditivo de trigo utilizando modelos mistos. Pesquisa
Agropecuária Brasileira, 49(11), 882-890. doi:
10.1590/S0100-204X2014001100007
Pinheiro, L. C. M., God, P. I. V. G., Faria, V. R., Oliveira, A. G., Hasui, A. A., Pinto, E. H. G., ...
Moreira, M. A. (2013). Parentesco na seleção para produtividade e teores de óleo e proteína em soja via modelos mistos. Pesquisa Agropecuária Brasileira,
48(9), 1246-1253. doi: 10.1590/S0100-204X2013000900008
R Development Core Team. (2013). R: A language and
environment for statistical computing. Vienna, AU: R
Foundation for Statistical Computing.
Ramalho, M. A. P., Abreu, A. F. B., Santos, J. B., & Nunes, J. A. R. (2012). Aplicações da genética quantitativa no melhoramento de plantas autógamas.
Lavras, MG: UFLA.
Raposo, F. V., Ramalho, M. A. P., & Abreu, A. F. B. (2000). Comparação de métodos de condução de populações segregantes de feijoeiro. Pesquisa
Agropecuária Brasileira, 35(10), 1991-1997. doi:
10.1590/S0100-204X2000001000010
Resende, M. D. V., Araujo, A. J., Sampaio, P. T. B., & Wiecheteck, M. S. S. (1995). Acurácia seletiva, intervalos de confiança e variância de ganhos genéticos associados a 22 métodos de seleção em
Pinus caribaea var. hondurensis. Revista Floresta,
24(1/2), 35-45.
Resende, M. D. V. (2002). Matemática e estatística no
melhoramento de plantas perenes. Brasília, DF:
Embrapa Informação Tecnológica; Colombo, PR: Embrapa Florestas.
Rocha, F., Vieira, C. C., Ferreira, M. C., Oliveira, K. C., Moreira, F. F., & Pinheiro, J. B. (2015). Selection of soybean lines exbiting resistance to stink bug complex in distinct environments. Food
Energy Security, 4(2), 133-143. doi: 10.1002/fes3.57
Rosal, C. J. S., Ramalho, M. A. P., Gonçalves, F. M. A., & Abreu, A. F. B. (2000). Seleção precoce para a produtividade de grãos no feijoeiro. Bragantia,
59(2), 189-195. doi: 10.1590/S0006-87052000000200010
Statistical Analyses System [SAS]. (2011). The SAS
System, release 9.3. Cary: NC: SAS Institute Inc.
Sediyama, T., Teixeira, R. C., & Barros, H. B. (2015). Origem, evolução e importância econômica. In T. Sediyama (Ed.), Tecnologias de produção e usos da soja
(p. 1-5). Londrina, PR: Mecenas.
Sediyama, T., Teixeira, R. C., & Reis, M. S. (2013). Melhoramento de soja. In A. Borém (Ed.),
Melhoramento de espécies cultivadas (p. 487-534).
Viçosa, MG: UFV.
Silva, G. F. O., Melo, P. G. S., Melo, L. C., Bassinello, P. Z., Del Peloso, M. J., & Faria, L. C. (2008). Efficiency of methods for conducting segregating populations in the breeding of common beans for protein quality. Crop Breeding and Applied
Biotechnology, 8(2), 149-154. doi:
10.12702/1984-7033.v08n02a08
Strategies for selecting soybean segregating populations Page 9 of 9
produtividade de grãos em progênies de feijoeiro-comum. Bragantia, 72(4), 326-331. doi: 10.1590/brag.2013.046
Silva, F. C., Melo, P. G. S., Pereira, H. S., & Melo, L. C. (2014). Genetic control and estimation of genetic parameters for seed-coat darkening of carioca beans. Genetics and Molecular Research, 13(3), 6486-6496. doi: 10.4238/2014.August.25.12
Wang, J., Ginkel, M, V., Ye, D. P. G., Trethowan, R., Pfeiffer, W., DelacY, I. H., … Rajaram, S. (2003).
Comparison of two breeding strategies by computer simulation. Crop Science, 43(6), 1764-177. doi: 10.2135/cropsci2003.1764
Received on September 5, 2017. Accepted on December 13, 2017.