Ideal Cardiovascular Health and Job Strain: A Cross-Sectional Study
from the Amazon Basin
Davi Dantas Muniz,
1Kamile Santos Siqueira,
2Cristina Toledo Cornell,
3Miguel Morita Fernandes-Silva,
4Pascoal
Torres Muniz,
1Odilson Marcos Silvestre
1Universidade Federal do Acre (UFAC),1 Rio Branco, AC – Brazil Universidade Federal Fluminense,2 Niterói, RJ – Brazil
Brigham and Womens Hospital - Harvard University,3 Boston, Massachussets – USA Pontifícia Universidade Católica do Paraná,4 Curitiba, PR – Brazil
Mailing Address: Odilson Marcos Silvestre •
Clínica Silvestre Santé - Rua Quintino Bocaiúva, 1108, Postal Code 69900-785; Rio Branco, AC – Brazil
E-mail: [email protected]
Manuscript received March 05, 2018, revised manuscript July 18, 2018, accepted August 08, 2018
DOI: 10.5935/abc.20190005
Abstract
Background: Ideal Cardiovascular (CV) Health is characterized by four ideal lifestyle parameters and absence of cardiovascular risk factors. The prevalence of ideal CV health in the Amazon Basin and the influence of job strain on CV health in this setting are uncertain.
Objective: To evaluate the prevalence of ideal CV health and its relationship with job strain in a secluded area from a developing country.
Methods: Job strain was evaluated in 478 employees from an university in the Amazon Basin by a questionnaire that classified participants as passive, active, low or high strain, according to the demand-control model. CV health was evaluated using the American Heart Association 7 health factors (diet, physical activity, body mass index (BMI), smoking, hypertension, diabetes and hypercholesterolemia). Participants were classified as having ideal, intermediate or poor CV health. The level of significance was set at p < 0.05.
Results: The mean age was 44.3 ± 12 years, 65% were men, and 35% were faculty. No participant fulfilled the criteria for ideal CV health. Intermediate CV health was found in 44 (9%) and poor in 434 (91%) individuals. Considering low strain as a reference group, individuals classified as high strain, active and passive had a non-significant (p > 0.05) increase in the chances of having poor CV health. When adjusting for possible confounders, high job strain was associated with poor BMI (> 30 kg/m2), (OR 2.11, 95%CI 1.06-4.22; p = 0.034) and poor diet (OR 2.31, 95% CI 1.29-4.13; p = 0.005).
Conclusion: Job strain was not associated with cardiovascular health, but high job strain was related to obesity and poor diet. Given the high prevalence of poor CV health and lack of participants with ideal CV health, policies focusing on health education and lifestyle interventions are paramount to this population. (Arq Bras Cardiol. 2018; [online].ahead print, PP.0-0)
Keywords: Cardiovascular Diseases/epidemiology; Risk Factors; Prevention and Control; Amazonian Ecosystem; Stress,Psychological; Obesity; Eating Disorders.
Introduction
Cardiovascular diseases (CVD) remain the leading cause of death in both the developed and developing world.1-3 In order to combat CVD, the American Heart Association (AHA) launched the 2020 impact goal and the Ideal Cardiovascular Health initiative.4 Ideal Cardiovascular (CV) Health is defined as the presence of both ideal health behaviors (nonsmoking, body mass index (BMI) < 25 kg/m2, physical activity at goal levels, and pursuit of a diet consistent with current guideline recommendations) and ideal health factors (untreated total cholesterol < 200 mg/dL, untreated blood pressure < 120/80 mmHg, and fasting blood
glucose < 100 mg/dL). Subjects in ideal status have a lower incidence of CVD and an increased life expectancy when compared with those in poor status.4–6
CV health seems to be influenced by workplace conditions.7,8 In a study by Karasek et al.,8 high job strain was associated with higher chances of having CV disease.8 The authors proposed that demand and control at the workplace influence health status. Control is defined as how much leeway in decision making the employee has and how much intellectual skills are required when working. Demand is the intellectual pressure that can be either quantitative, for example, time and velocity to work, or qualitative, defined as conflicts between contradictory demands.7
Objective
The aim of this study is to evaluate the prevalence of ideal CV health and its relationship with job strain in a secluded area from a developing country.
Methods
The study was performed between 2012 and 2013 in Rio Branco, Brazil. All 759 employees at the Federal University of Acre were invited to participate. Employees received a call or email to setup an appointment with two trained researchers. A total of 478 employees accepted to participate, including 166(35%) faculty professionals and 312(65%) non-faculty staff. A questionnaire was used to collect information regarding demographics, CV behavior and risk factors. Weight, height, waist circumference and blood pressure were measured twice at different appointments. The average of the two measurements was considered the final value. We excluded those subjects who declined to sign an informed consent. Twenty-seven participants with missing data regarding job strain were not included in the comparisons among CV health factors and job strain. This study was approved by the Institutional Review Board at the Federal University of Acre. We used the validated Portuguese-language adapted Job Content Questionnaire based in Robert Karesek theoric model to assess job strain.9 It is composed of 6 questions to evaluate control, 5 questions to assess demand, and 6 questions to assess social support. Each question was composed of 4 possible answers ranging from 1 (strongly disagree) to 4 (strongly agree). We defined as having high demand those participants with scores above the 50th percentile on the Portuguese-language adapted Job Content Questionnaire; low control when below the 50th percentile; High job strain was defined as the combination of high demand and low control; low job strain as low demand and high control; active as high demand and high control; passive as low demand and low control.
This study selected seven health indicators proposed by the AHA as markers of CV health. These seven parameters include four lifestyle variables (smoking, physical activity, diet, and BMI) and three CV risk factors (diabetes, hypercholesterolemia, and high blood pressure). Smoking status was classified as never smoker, former smoker and current smoker. Ideal physical activity was defined by more than 150 minutes/week of moderate intensity exercise, any physical activity lower than 150 minutes/week as intermediate and no physical exercise as poor. BMI was calculated as body weight in kilograms divided by the square of body height in meters (kg/m2). Values lower than 25 were considered ideal, between 25 and 29.9 intermediate, and greater than 30 were considered poor. Diabetes and hypercholesterolemia were self-reported in a questionnaire as yes or no responses. Blood pressure was obtained by trained researchers. High blood pressure was defined as a measured value greater than 140/90 mmHg or self-reported high blood pressure in use of anti-hypertensive medication or not. Systolic blood pressure between 120 and 139 or diastolic blood pressure between 80 and 89 were classified as intermediate. Blood pressure < 120/80 was considered ideal. According to the AHA, an ideal diet pattern was defined as consumption of 4 portions or more of fruits
and/or vegetables per day, less than 1 liter of sugar-sweetened beverages per week and more than two 3.5-oz servings per week of fresh fish. We used a food frequency questionnaire previously validated in a Brazilian cohort.10 Sodium and fiber-rich whole grains consumption couldn’t be accessed by the questionnaire. Individuals were classified as having ideal CV health (ideal lifestyle and absence of CV risk factors), poor (when any of the seven factors was evaluated as poor) or intermediate (participants who did not belong to ideal or poor CV health group).
The covariates used for data analysis were age, gender, income, education level and occupation, which were self-reported in a questionnaire. Income was measured in US dollars and subjects were split in two categories, more or less than $20,000/year. Occupation was classified as teaching and non-teaching staff. We modeled education as a dichotomous variable with subjects classified as college or more or high school or less. Low social support was considered for those participants bellow 50th percentile on the adapted Job Content Questionnaire.
Statistical analysis
The study was designed to detect a difference in the proportion of poor CV health of 15% between high strain (85%) and low strain (70%). Considering a power set at 0.8, an alpha level of 0.05, we estimated a sample size of at least 121 patients per group and a total of 424 participants. We planned including 478 individuals, allowing for non-respondents or incomplete responses up to 12% of participants.
Categorical data was reported as percent frequencies and compared by chi-squared test. Continuous normally distributed variables were displayed as mean and standard deviation, and continuous non-normally distributed variables were displayed as median and 25th and 75th percentiles. Significant pairwise comparisons were adjusted for multiple testing using Bonferroni correction and are shown only for variables in which a significant global difference was detected using one-way ANOVA or Kruskal–Wallis tests. The association between job strain and CV health was assessed using multivariable logistic regression using the low strain group as reference. We also used multivariable logistic regression to assess the association between job strain and CV risk factors. We built two models for analyses; the crude analyses without any covariate and the adjusted analyses, which controlled for age, sex, education, income, and occupation. Exposures included high job strain and also high demand and low control, separately. All statistical analyses were performed with STATA version 13.1 (Stata Corp., College Station, TX, USA). P-values < 0.05 were considered statistically significant.
Results
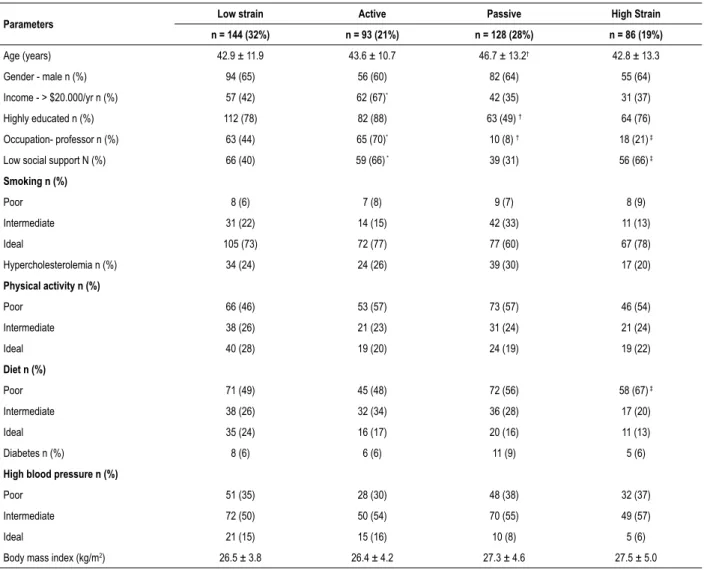
Table 1 – Characteristics of subjects according to job strain (active, passive, low strain, high strain)
Parameters Low strain Active Passive High Strain
n = 144 (32%) n = 93 (21%) n = 128 (28%) n = 86 (19%)
Age (years) 42.9 ± 11.9 43.6 ± 10.7 46.7 ± 13.2† 42.8 ± 13.3
Gender - male n (%) 94 (65) 56 (60) 82 (64) 55 (64) Income - > $20.000/yr n (%) 57 (42) 62 (67)* 42 (35) 31 (37)
Highly educated n (%) 112 (78) 82 (88) 63 (49) † 64 (76)
Occupation- professor n (%) 63 (44) 65 (70)* 10 (8) † 18 (21) ‡
Low social support N (%) 66 (40) 59 (66) * 39 (31) 56 (66) ‡
Smoking n (%)
Poor 8 (6) 7 (8) 9 (7) 8 (9)
Intermediate 31 (22) 14 (15) 42 (33) 11 (13)
Ideal 105 (73) 72 (77) 77 (60) 67 (78)
Hypercholesterolemia n (%) 34 (24) 24 (26) 39 (30) 17 (20)
Physical activity n (%)
Poor 66 (46) 53 (57) 73 (57) 46 (54)
Intermediate 38 (26) 21 (23) 31 (24) 21 (24)
Ideal 40 (28) 19 (20) 24 (19) 19 (22)
Diet n (%)
Poor 71 (49) 45 (48) 72 (56) 58 (67) ‡
Intermediate 38 (26) 32 (34) 36 (28) 17 (20)
Ideal 35 (24) 16 (17) 20 (16) 11 (13)
Diabetes n (%) 8 (6) 6 (6) 11 (9) 5 (6)
High blood pressure n (%)
Poor 51 (35) 28 (30) 48 (38) 32 (37)
Intermediate 72 (50) 50 (54) 70 (55) 49 (57)
Ideal 21 (15) 15 (16) 10 (8) 5 (6)
Body mass index (kg/m2) 26.5 ± 3.8 26.4 ± 4.2 27.3 ± 4.6 27.5 ± 5.0
*p < 0.05 active vs. low strain; †p < 0.05 passive vs. low strain; ‡p < 0.05 high strain vs low strain.
be among the high strain job group. No significant differences were found between high strain and low strain group in terms of age, sex, and income. Passive participants were more likely to be older and low educated than low strain subjects. Active participants had higher income and were more likely to be professors than low strain participants (Table 1).
Ideal CV health was not found in this sample. Intermediate CV health was found in 44 (9%) and poor in 434 (91%) individuals. Poor physical activity (53%) and poor diet (55%) were the factors with the highest prevalence among the participants. Poor BMI was found in 22% of participants, smoking in 7%, hypertension in 36%, hypercholesterolemia in 26%, and diabetes in 7% (Figure 1). Most participants had one to three CV health factors classified as poor (Table 2).
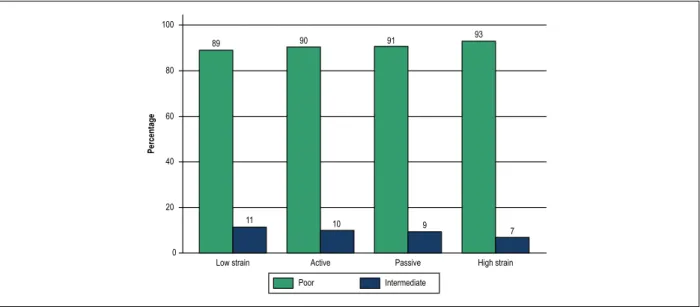
Considering the outcome CV health and low strain as reference group for comparisons, we found that high strain, active and passive individuals have a non-significant increase in the chances of having poor CV health (Table 3 and Figure 2). Either high demand or low control category
when analyzed separately or combined was not associated with poor CV health (Table 3). Individually, the active group had a trend to increase the odds of poor physical activity (OR 1.67, 95% CI 0.96-2.92; p = 0.07). High job strain increased the chance of poor diet by 2.3-fold in comparison with the low strain group (p = 0.005). Similarly, high job strain was associated with poor BMI (> 30 kg/m2), OR 2.11, 95%CI 1.06-4.22; p = 0.034. We did not find an association between job strain and poor smoking, high blood pressure, hypercholesterolemia, or diabetes (Table 4). When demand and control categories were analyzed separately, low control was associated with poor diet. (Table 5)
Discussion
CV health. High job strain was associated with a poor diet and obesity. These findings highlight the influence of workplace condition in CV health of employees and the need to implement policies to improve their health.
We found no individuals in our sample that would be classified as having ideal CV health as defined by the AHA guideline. More than 90% were classified as having poor CV health. Surprisingly, these findings are worse than those from studies in developed countries. In a United States community-based study with 1933 individuals, only one individual fulfilled criteria for ideal CV health. In the same study, 17% had intermediate CV health, and 83% had poor CV health.11 We would expect a better CV health profile in our population since we recruited employees from an academic center with wide access to health information, particularly given the presence of nutrition, medicine and other health-related disciplines on campus. Furthermore, our sampled population was approximately 10 years younger than
the population of other similar studies.11,12 In an Asian study, the prevalence of ideal CV health was 0.2%, intermediate 21% and poor 79% among hospital workers.13 Comparing this sample with the current study participants, the main difference of CV parameters can be explained by better blood pressure control and low index of overweight and obesity in the Asian population. Importantly, this worse scenario found in our sample could not be explained by differences in methodology among studies because we used similar definitions for CV health factors as defined by the AHA.4
In regards to the difference in job strain and CV health, no relationship between job strain and poor CV health was demonstrated. Previous studios with larger sample size than our study demonstrated that job strain was associated with CV health scores or established CV disease.14 The current study included 451 participants which limits the power to find small differences. Moreover, socio-cultural differences between this study sample and other studies mainly from developing
Figure 1 – Stacked bars showing the prevalence of cardiovascular risk factors. BMI: Body mass index (kg/m2).
100
80
60
40
20
0
Physical Activity Diet BMI Smoking Hypertension Cholesterol Diabetes
Percentage
23
25 26
53 55
19
35
43
22
22 71
7
11
53
36
74
26
7 93
Poor Intermediate Ideal
Table 2 – Distribution (count) of poor cardiovascular health factors according to job strain*
Number of poor CV factors Low strain n = 144(32%) Active n = 93(21%) Passive n = 128(28%) High Strain n = 86(19%)
0 16 (11) 9 (10) 12 (9) 6 (7)
1 52 (36) 31 (33) 27 (21) 18 (21)
2 37 (26) 23 (25) 35 27) 27 (31)
3 29 (20) 17 (18) 35 (27) 25 (29)
4 5 (4) 9 (10) 13 (10) 8 (9)
5 3 (2) 4 (4) 4 (3) 2 (2)
6 2 (1) 0 2 (2) 0
7 0 0 0 0
Mean of poor CV factors (n) 1.8 2 2.2 2.2
Figure 2 – Bar graph with percentages of intermediate and poor cardiovascular health according to tob strain categories are low strain (low demand and high control), active (high demand and high control), passive (low demand and low control), and high strain (high demand and low control). Ideal cardiovascular health is not represented because none individual was in this group.
100
80
60
40
20
0
Percentage
89 90 91 93
11 10 9
7
Poor Intermediate
Low strain Active Passive High strain
Table 3 – Association between job demand, control, or strain with poor cardiovascular health
Poor Cardiovascular Health (Crude) Poor Cardiovascular Health (Adjusted*)
n (%) Odds Ratio (95% CI) p Odds Ratio (95% CI) p
Isolated parameters
High demand 180 (40) 1.24 (0.64-2.39) 0.52 1.49 (0.76-2.94) 0.24 Low Control 229 (49) 1.29 (0.69-2.40) 0.43 1.09 (0.54-2.20) 0.81
Combined parameters
Low strain 144 (32) Ref - Ref
-Active 93 (21) 1.17 (0.49-2.76) 0.73 1.21 (0.49-2.97) 0.68 Passive 128 (28) 1.21 (0.55-2.66) 0.64 0.91 (0.38-2.18) 0.84 High strain 86 (19) 1.67 (0.63-4.44) 0.31 1.79 (0.65-4.92) 0.26
CI: confidence interval; *Adjusted for age, sex, income, education and profession.
countries might influence to change the impact of job strain in CV health. Other authors explored individual CV health factors and found association between high job strain and physical inactivity,15,16 diabetes, smoking and obesity.16
In the current study, diet pattern was associated with job strain, perhaps due to the fact that people with higher demand and lower control usually have less time to prepare or buy healthy food. We also found an association between job strain and obesity, which may be a consequence of a poor diet; it is reasonable to hypothesize that a poor diet is a mediator factor for the association between job strain and obesity. However, we did not found mediator effect for this association (data not shown). In addition, the control-demand model was built to evaluate psychosocial factors that affect mental health.7 Participants with job strain are more prone to have eating disorders resulting in weight gain, which may explain our findings. In our questionnaires, we did not
explore mental health disorders to add on this discussion. In the current study, physical inactivity was not associated with job strain, which is different from a previous publication that found it as the only risk factor associated with job strain.15 Our data showed a trend towards worse CV health factors and job strain, albeit without statistical significance. This is likely due to the lack of sample power given the relatively small sample size. In addition, it is also possible that the busiest and healthiest employees may have declined to participate in the study, introducing a bias towards the null. On the other hand, job stress might determine less influence in CV health in an academic environment in the Amazon region because employees would work in a less competitive behavior.
Table 4 – Odds ratio for cardiovascular health factors according job demand, job control and job strain
n (%) Crude Odds Ratio (95% CI) p Adjusted Odds Ratio (95% CI)* p
Poor physical activity
Low strain 66 (46) Ref - Ref
-Active 53 (57) 1.57 (0.93-2.65) 0.09 1.67 (0.96-2.92) 0.07 Passive 73 (57) 1.57 (0.97-2.53) 0.066 1.19 (0.70-2.04) 0.52 High strain 46 (53) 1.36 (0.80-2.32) 0.26 1.40 (0.80-2.46) 0.24
Poor diet
Low strain 71 (49) Ref - Ref
-Active 45 (48) 0.96 (0.57-1.62) 0.89 0.95 (0.55-1.65) 0.86 Passive 72 (56) 1.32 (0.82-2.13) 0.25 1.38 (0.81-2.35) 0.24 High strain 58 (67) 2.13 (1.22-3.18) 0.008 2.31 (1.29-4.13) 0.005
BMI > 30 kg/m2
Low strain 22 (15) Ref - Ref
-Active 21 (23) 1.62 (0.83-3.15) 0.16 1.75 (0.86-3.53) 0.12 Passive 34 (26) 2.01 (1.10-3.65) 0.023 1.83 (0.94-3.57) 0.07 High strain 23 (27) 2.02 (1.05-3.91) 0.036 2.11 (1.06-4.22) 0.034
Smoking
Low strain 8 (6) Ref - Ref
-Active 7 (8) 1.38 (0.48-3.95) 0.55 1.65 (0.53-5.11) 0.39 Passive 9 (7) 1.29 (0.48-3.44) 0.62 1.01 (0.34-3.04) 0.98 High strain 8 (9) 1.74 (0.63 (4.83) 0.29 2.06 (0.69-6.12) 0.19
High blood pressure
Low strain 51 (35) Ref - Ref
-Active 28 (30) 0.79 (0.45-1.37) 0.4 0.82 (0.44-1.51) 0.53 Passive 48 (38) 1.09 (0.67-1.79) 0.72 0.72 (0.41-1.28) 0.27 High strain 32 (37) 1.08 (0.62-1.88) 0.78 0.93 (0.51-1.71) 0.82
Dyslipidemia
Low strain 34 (24) Ref - Ref
-Active 24 (26) 1.13 (0.62-2.06) 0.7 1.23 (0.64-2.36) 0.53 Passive 38 (31) 1.42 (0.83-2.43) 0.2 0.92 (0.50-1.69) 0.78 High strain 17 (19) 0.80 (0.41-1.53) 0.5 0.72 (0.36-1.45) 0.35
Diabetes
Low strain 8 (6) Ref - Ref
-Active 6 (6) 1.17 (0.39-3.49) 0.78 1.05 (0.33-3.30) 0.94 Passive 11 (9) 1.60 (0.62-4.11) 0.33 1.20 (0.42-3.49) 0.73 High strain 5 (6) 1.05 (0.33-3.32) 0.93 1.07 (0.32-3.56) 0.91
CI: confidence interval; BMI: body mass index; *Adjusted for age, sex, income, education and profession.
diseases17 and the prevalence of CV risk factors may have been underestimated, which increases the concern regarding the burden of CVD among employees at the University. Importantly, this need to be addressed at a larger scale, as it may reflect a high prevalence of cardiovascular risk factors in Rio Branco, the Brazilian capital with the highest prevalence of obesity.18 However, the prevalence of these cardiovascular factors in our study was similar to data on cardiovascular risk factors reported in the literature.18-20 The food questionnaire
Table 5 – Association between job demand or job control with cardiovascular health factors
Demand Control
n (%) Adjusted Odds Ratio (95% CI) p n (%) Adjusted Odds Ratio (95% CI)* p
Poor physical activity
Low demand 99 (39) Ref - High control 121 (49) Ref -High demand 141 (59) 1.34 (0.90-1.98) 0.15 Low control 126 (51) 1.03 (0.68-1.56) 0.88
Poor diet
Low demand 160 (61) Ref - High control 123 (47) Ref -High demand 103 (39) 1.21 (0.82-1.80) 0.34 Low control 140 (53) 1.70 (1.12-2.58) 0.012
BMI > 30 kg/m2
Low demand 45 (44) Ref - High control 59 (58) Ref -High demand 58 (56) 1.49 (0.93-2.41) 0.1 Low control 43 (42) 1.50 (0.91-2.49) 0.12
Smoking
Low demand 18 (55) Ref - High control 18 (54) Ref -High demand 15 (45) 1.98 (0.91-4.29) 0.085 Low control 15 (45) 1.17 (0.52-2.65) 0.71
Hypertension
Low demand 31 (61) Ref - High control 17 (32) Ref -High demand 20 (39) 0.70 (0.37-1.35) 0.29 Low control 36 (68) 0.78 (0.38-1.60) 0.5
Dyslipidemia
Low demand 74 (64) Ref - High control 62 (52) Ref -High demand 42 (36) 1.00 (0.62-1.59) 0.99 Low control 58 (48) 0.83 (0.51-1.34) 0.44
Diabetes
Low demand 19 (63) Ref - High control 14 (44) Ref -High demand 11 (37) 1.01 (0.19-1.16) 0.98 Low control 18 (56) 1.21 (0.52-2.79) 0.66
CI: confidence interval; BMI: body mass index; *Adjusted for age, sex, income, education and profession.
employees responded the questionnaire(still representative of our community as most people invited to participate responded to the questionnaire). Moreover, unmeasured and residual confounding of the relationship between change job stress and CV health could not be completely addressed by multivariate modeling. Finally, as the design of the study is cross-sectional, only associations can be established. A further study with a longitudinal design would explore causality between job strain and CV health factors.
Conclusion
The findings of high prevalence of poor CV health provide important information to public health officials in middle-income countries. Furthermore, a trend to worse CV health in high strain jobs is of interest as these factors could potentially worsen overtime with poor working conditions in developing countries. Strategies for promoting healthy behaviors such as healthier foods offered on campus restaurants, fitness projects, education campaigns,
in conjunction with good primary care on campus could potentially have a great impact on life expectancy and improved CV health in this population.
Author contributions
Conception and design of the research: Muniz DD, Siqueira KS, Muniz PT, Silvestre OM; acquisition of data: Muniz DD, Siqueira KS, Muniz PT; analysis and interpretation of the data: Muniz DD, Cornell CT, Silva MMF, Silvestre OM; statistical analysis: Silva MMF, Silvestre OM; writing of the manuscript: Muniz DD, Cornell CT, Silvestre OM; critical revision of the manuscript for intellectual content: Muniz DD, Siqueira KS, Cornell CT, Silva MMF, Muniz PT, Silvestre OM.
Potential Conflict of Interest
1. Pagidipati NJ, Gaziano TA. Estimating deaths from cardiovascular disease: a review of global methodologies of mortality measurement. Circulation. 2013;127(6):749-56.
2. Santulli G. Epidemiology of cardiovascular disease in the 21st century: updated numbers and updated facts. J Cardiovasc Dis. 2013;1(1):1-2.
3. Stevens G, Mascarenhas M, Mathers C. Global health risks: progress and challenges. Bull World Health Organ. 2009;87(9):646.
4. Lloyd-Jones DM, Hong Y, Labarthe D, Mozaffarian D, Appel LJ, Van Horn L, et al. Defining and setting national goals for cardiovascular health promotion and disease reduction: the American Heart Association’s strategic impact goal through 2020 and beyond. Circulation. 2010;121(4):586-613.
5. Stamler J, Stamler R, Neaton JD, Wentworth D, Daviglus ML, Garside D, et al. Low risk-factor profile and long-term cardiovascular and noncardiovascular mortality and life expectancy: findings for 5 large cohorts of young adult and middle-aged men and women. Jama. 1999;282(21):2012-8.
6. Yang Q, Cogswell ME, Flanders WD, Hong Y, Zhang Z, Loustalot F, et al. Trends in cardiovascular health metrics and associations with all-cause and CVD mortality among US adults. Jama. 2012;307(12):1273-83.
7. Karasek RA. Job demands, job decision latitude, and mental strain: Implications for job redesign. Adm Sci Q. 1979;24(2):285-308.
8. Karasek R, Baker D, Marxer F, Ahlbom A, Theorell T. Job decision latitude, job demands, and cardiovascular disease: a prospective study of Swedish men. Am J Public Health. 1981;71(7):694-705.
9. Alves MG, Chor D, Faerstein E, Lopes CS, Werneck GL. Short version of the “job stress scale”: a portuguese-language adaptation. Rev Saude Publica. 2004;38(2):164-71.
10 Molina MC, Benseñor IM, Cardoso LO, Velasquez-Melendez G, Drehmer M, Pereira TS, et al. Reproducibility and relative validity of the Food Frequency Questionnaire used in the ELSA-Brasil. Cad Saude Publica. 2013;29(2):379-89.
11. Folsom AR, Yatsuya H, Nettleton JA, Lutsey PL, Cushman M, Rosamond WD, et al. Community prevalence of ideal cardiovascular health, by the American
Heart Association definition, and relationship with cardiovascular disease incidence. J Am Coll Cardiol. 2011;57(16):1690-6.
12. Wu S, Huang Z, Yang X, Zhou Y, Wang A, Chen L, et al. Prevalence of ideal cardiovascular health and its relationship with the 4-year cardiovascular events in a northern chinese industrial city. Circ Cardiovasc Qual Outcomes. 2012;5(4):487-93.
13. Chou LP, Tsai CC, Li CY, Hu SC. Prevalence of cardiovascular health and its relationship with job strain: a cross-sectional study in taiwanese medical employees. BMJ Open. 2016;6(4):e010467.
14. Rocco PTP, Bensenor IM, Griep RH, Moreno AB, Alencar AP, Lotufo PA, et al. Job Strain and Cardiovascular Health Score (from the Brazilian Longitudinal Study of Adult Health [ELSA-Brasil] Baseline). Am J Cardiol. 2017;120(2):207-12.
15. Griep RH, Nobre AA, Alves MGDM, Da Fonseca MDJM, Cardoso LDO, Giatti L, et al. Job strain and unhealthy lifestyle: results from the baseline cohort study, Brazilian Longitudinal Study of Adult Health (ELSA-Brasil). BMC Public Health. 2015;15:309.
16. Nyberg ST, Fransson EI, Heikkilä K, Alfredsson L, Casini A, Clays E, et al. Job strain and cardiovascular disease risk factors: meta-analysis of individual-participant data from 47,000 men and women. PLoS One. 2013;8(6): e67323.
17. Ning M, Zhang Q, Yang M. Comparison of self-reported and biomedical data on hypertension and diabetes: findings from the China Health and Retirement Longitudinal Study (CHARLS). BMJ Open. 2016;6(1):e009836.
18. Brasil. Ministério da Saúde. Vigilância De Fatores De Risco E Proteção Para Doenças Crônicas Por Inquérito Telefônico. VIGITEL. Brasilia;2016. [Citado 10 jun 2018]. Disponível em: http://portalsaude.saude.gov.br/images/ pdf/2015/ab.
19. Shaw JE, Sicree RA, Zimmet PZ. Global estimates of the prevalence of diabetes for 2010 and 2030. Diabetes Res Clin Pract. 2010;87(1):4-14.
20. Carroll MD, Kit BK, Lacher DA. Total and high-density lipoprotein cholesterol in adults: National Health and Nutrition Examination Survey, 2009-2010. NCHS Data Brief. 2012;92:1-8.
References
Sources of Funding
There were no external funding sources for this study.
Study Association
This study is not associated with any thesis or dissertation work.
Ethics approval and consent to participate