Carlos Manuel Oliveia Correia
Licenciado em Engenharia Informática
Improvements in the Geocoding Process in
Organizational Environments
Dissertação para obtenção do Grau de Mestre em Engenharia Informática
Orientadores :
Prof. Doutor Armanda Rodrigues, Prof. Auxiliar,
Universidade Nova de Lisboa
Miguel Marques, Senior Professional,
Novabase
Júri:
Presidente: Doutor Nuno Preguiça (FCT/UNL)
Arguente: Doutor Jorge Rocha (UMinho)
iii
Improvements in the Geocoding Process in Organizational Environments
Copyright cCarlos Manuel Oliveia Correia, Faculdade de Ciências e Tecnologia, Uni-versidade Nova de Lisboa
Acknowledgements
I would like to express my deepest gratitudes to both my Advisers. To the Auxiliary Professor Armanda Rodrigues, her guidance and calm and joyful disposition were of great comfort during this thesis, and absolutely essential on every moment. And to the Senior Professional Miguel Marques, who guided me through and taught me about the realities of a business environment, all the while enduring my many. . . particularities. Without their help this surely would not have been possible.
In addition, I would like give my deepest gratitude to João Silva, and to theCâmara Municipal da Amadora. Their support was imperative for the realization of this thesis. The data provided was immensely important and extremely useful. Without their help this thesis would certainly lose some of its essence.
Additional thanks to both organizations which have supported my endeavours, the
Faculdade de Ciências e Tecnologia da Universidade Nova de Lisboa, in particular, the Depart-ment of Informatics, and Novabase, the company which financed this project and which resources and environment have been greatly useful.
I would also like to thank my co-workers, who helped me through many hardships both related to this thesis and not. A special mention to Cosme Benito, both for giving me reasons to be angry at him and for letting me act on that anger, which was, in some ways, strangely therapeutic.
A huge thank you to my university friends, special mention to Paulo Ferreira, whose much too intricate thoughts always helped me to take my mind of things and to see them from other perspectives, and to Fernando Alexandre, who is also doing his thesis and has been a constant presence in my days, us both basking in the joys of finally overcoming a hurdle and cursing every living thing out of existence when Murphy’s Law takes a stab at one of us.
A resounding thank you to my closest friends, Margarida Mendes and Ricardo Serra, who have been with me in both the harsher and more fond moments, and a thunderous applause to João Carvalho, who unexpectedly entered my life and has grown to be my one reliance on just about everything slightly related to me.
viii
have been giving them all my life, for their ever-lasting support.
Abstract
The current geocoding technologies are only able to handle addresses which fit a gen-eral case for the location in consideration. The more edge-case addresses are mostly ig-nored or wrongly geocoded, leading to imprecision and errors in the results obtained. To try overcoming this problem the current geocoding services accompany their results with confidence values, but the values and scales used vary between services, and are hard to understand by users without knowledge in the area, and, as we discovered, are not truly to be trusted.
Novabase aims to make available to organizations a geocoding service which allows the improvement of the quality of the results obtained by mainstream geocoding services such as Google and Bing. The objective is to give quality results in the cases where we can act and, not being able to do, falling back to the results of other geocoding services.
We pretend to handle addresses in areas where results are of inferior quality, either because the areas are not fully covered by the services or because those same services are not prepared to handle the address formats which do not match the general case (one example are addresses which are numbered by the use ofLotes).
The geocoding is executed in two steps. The first one matches the address with a knowledge base owned by organizations, in which we assume full trust of the quality. If the knowledge base returns a valid result, it is output with maximum confidence. When it fails, we fall back to using the mainstream geocoding services, and use their results for output.
Resumo
As tecnologias de geocodificação actuais apenas conseguem lidar com endereços que encaixem nos casos gerais. Os mais particulares são maioritariamente ignorados ou mal geocodificados, o que leva a imprecisões e erros nos resultados obtidos. Para tentar col-matar este problema os serviços de geocodificação existentes disponibilizam valores de confiança com os resultados calculados, mas os valores e escalas usados variam entre serviços, são difíceis de compreender por utilizadores sem conhecimentos específicos na área, e, como viemos a descobrir, não são verdadeiramente de confiança.
A Novabase pretende disponibilizar um serviço de geocodificação aos seus clientes que permita melhorar a qualidade dos resultados fornecidos pelos serviços de geocodi-ficação de grande utilização como o Google ou o Bing. O objectivo é facultar resultados de qualidade nos casos em que tal é possível e, não o sendo, então usar os resultados de outros serviços de geocodificação.
Pretendemos então lidar com tipos de zonas cujos resultados sejam de qualidade in-ferior, por se encontrarem mal cobertas pelos serviços de geocodificação actuais, seja por estes não terem informação actualizada ou por os endereços dessas zonas usarem forma-tos específicos que diferem do caso geral (um exemplo é a utilização de lotes para definir os números dos edíficios).
A geocodificação é executada em dois passos. O primeiro pesquisa pelo endereço numa base de conhecimento em posse das organizações, na qual assumimos confiança máxima nos resultados. Se esta pesquisa completar com sucesso, o output será dado pelo serviço Novabase com o valor de confiança máximo. Se falhar,o endereço é passado para um dos serviços de grande utilização acima referidos, e os resultados deste serão ooutput.
Contents
1 Introduction 1
1.1 Motivation . . . 1
1.2 Problem Description . . . 1
1.2.1 The Geocoding Process . . . 3
1.2.2 The problems . . . 7
1.3 Context . . . 8
1.4 Objectives . . . 8
1.5 Contribution . . . 9
2 State of the Art 11 2.1 Application Analysis . . . 11
2.1.1 Geocoding Results Analysis . . . 12
2.1.2 Feature Analysis . . . 14
2.1.3 Application Usability . . . 16
2.2 API Comparison. . . 20
2.2.1 Google Geocoding Service API Analysis of Results . . . 22
2.3 Discussion . . . 25
3 Methodology 27 4 Implementation 31 4.1 Data Entry . . . 33
4.2 Geocoding Process . . . 36
4.2.1 Geocoding with the Database . . . 37
4.2.2 Geocoding with the Google Geocoding Service . . . 40
4.3 Data Output . . . 41
4.4 Feedback Analysis . . . 42
4.5 Extensibility . . . 46
xiv CONTENTS
4.5.2 Server Configuration . . . 48
4.5.3 Client Configuration . . . 52
4.6 Server Start-up and Finalization . . . 52
4.7 Conclusion . . . 52
5 Conclusion 53 5.1 Future. . . 54
5.1.1 Features . . . 54
List of Figures
1.1 Geocoding example of a simple address . . . 4
1.2 Example of address standardization . . . 5
1.3 Geocoding with linear interpolation alone . . . 6
1.4 Geocoding with linear interpolation and street offset. . . 6
1.5 Geocoding with linear interpolation, street offset and corner insets . . . . 6
1.6 Geocoding with geometric interpolation . . . 7
2.1 Street components information . . . 20
2.2 Different types of confidence information for each service and their values 21 2.3 Information given for each candidate result in both APIs . . . 22
2.4 Difference in distances from Google Geocoding Service coordinates to the real locations. . . 23
2.5 Variance of Google Geocoding Service’s confidence on its results. . . 23
2.6 Variance of Google Geocoding Service’s confidence on its results (not in-cluding failed results). . . 24
2.7 Difference in distances withROOFTOPconfidence . . . 25
2.8 Quality of Google’s results against real locations . . . 26
3.1 Work flow of our proposed solution . . . 28
4.1 Application components and flow . . . 32
4.2 Normalization example of a simple address . . . 38
List of Tables
2.1 Quality of the researched applications’ results . . . 13
2.2 Features of the researched applications. . . 15
2.3 Usability scores of the researched applications . . . 16
2.4 Usability scores of the researched applications . . . 19
Listings
4.1 SQL query for address matching . . . 39
4.2 Default Database Configuration. . . 47
4.3 Configuration example for Extractors and Dispatchers. . . 48
4.4 Configuration example for File Configurations . . . 49
4.5 Configuration example for Geocoding Strategies . . . 51
1 Configuration file for the application . . . 58
1
Introduction
1.1
Motivation
Both GIS (Geographic Information Systems) and geocoding are part of the everyday lives of most people. Setting a destination on a GPS (Global Positioning System), planning a trip on a computer, and looking up near pharmacies in a cell phone, are all examples of GIS and geocoding in action. Any time, anywhere and in such a simple way that most do not notice they are doing it.
As everything that becomes commonplace, it turns into an expected commodity from which users always expect better and more and, although in some areas the technology has been able to fulfill those expectations, in others it has been lacking. Geocoding ser-vices as they stand now are still unreliable; while they work well for general cases, there are many peculiarities which may lead to wrong results.
The aim of this project is not to replace current geocoding services, but to take advan-tage of what they can do and work in tandem with them to contribute to the improvement of tailored geocoding results.
1.2
Problem Description
Addresses are not an international standard. Each country has its own specificity in terms of addresses, each with its own edge cases and deviations from the norm. Cur-rent geocoding services will respond on international addresses, but will fail on edge case scenarios of specific countries. One example are newer quarter buildings in Lisbon, Portugal which have a new numbering schema.
1. INTRODUCTION 1.2. Problem Description
geocoding services. High importance tasks will often require high levels of accuracy, which these services cannot yet provide under all circumstances. Distribution companies are a good example: the level of accuracy for many addresses in Lisbon is, at best, a region of delivery (e.g. a street) instead of a full address (i.e. a building). Another example is calculating the reach and efficiency of a distribution network, wrong locations affect those calculations and errors are propagated, generating false results.
To demonstrate, let us use the example of a fictitious company, Porcupine, a new-comer to the telecommunications industry. They have developed an application that allows their users to write down their address and check their coverage for Porcupine services. If the geocoding service cannot explicitly geocode addresses in (the also ficti-tious) Spike Street, the result of submitting addresses on this street to the application will be an approximation to the same location: the center of the city. Now let us assume that the center of the city is a location covered by the company, but Spike Street is not.
For the application users, this means that they are unintentionally tricked into be-lieving they are covered, and adhere to the company’s service only to receive a sub par experience. For the company, it is an unreported source of prejudice. All the users are reported as covered by the geocoding service, so the company has no need to improve re-ception in the area. In addition, when the company receives complaints from users, they will be unable to locate the problem and provide adequate solutions, leading to wasted resources and loss of trust from the consumers.
This kind of problem can be slightly eased by making use of confidence levels, which are labels or numbers that accompany each result and indicate the level of confidence the service has on the particular result it is providing. Even if the service is not able to pin-point correctly a certain location, when the coordinates obtained come with a confidence level, organizations can act on that information and search to provide better services. In the example above, if confidence levels where present, customer service would have been able to better pinpoint the problem, enabling them to come with a plan of action while spending less resources.
Confidence levels served with geocoding results can help on mitigating the problem these inaccuracies carry. However, such analysis is difficult, even more so when com-paring results of different geocoding services, since they often do not carry the same information. Current services are not rigorous when it comes to sharing confidence re-sults with users. They are either too generic and uninformative, or delve too deeply into technical issues, which may prevent service users from understanding what they mean.
Geocoding results are not standardized among different geocoding providers, even if they carry the same information it may be presented in different formats.
When parsing a Bing geocoding response, the components of the provided address are indexed, and the application has direct access to them. The address comes in the following format:
1 [addressLine -> Main Street 17, locality -> Middle Town, postalCode -> 1234-567]
1. INTRODUCTION 1.2. Problem Description
This means that if we want to know the postal code of the result, we only need to look into thepostalCodeproperty.
When parsing a Google geocoding response, however, we need to look at all the com-ponents to find the desired one. The address comes in the following format:
1 [(Main Street 17, street), (Middle Town, locality), (1234-567, postalCode)]
This means that if we need the postal code, we will need to go through all parts of the address until we find the one namedpostalCode.
This discrepancy on the formats used by the different services leads to a situation where switching services, or trying to use more than one, will often lead to conflicting results.
To understand why these types of problems occur in the first place, some knowledge in the workings of geocoding is necessary.
1.2.1 The Geocoding Process
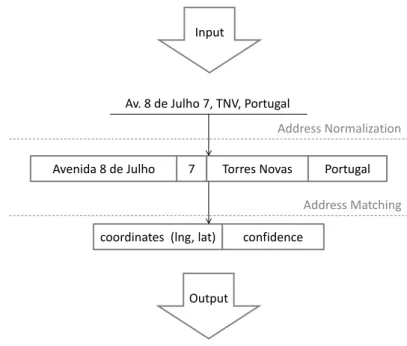
Taken literally, geocoding means “to assign a geographic code” [GWK07]. However, for the purposes of this document, the terms “Geocoding” and “Geocoding Process”, will be associated with the transformation of human readable addresses into geographic coordi-nates. This process, which is exemplified in Figure1.1, varies in complexity, but can be simplified into two main steps: address standardization and translation of normalized addresses into geographic coordinates. In the normalization step, a series of operations are applied to the address, reducing it into a format appropriate for the next step in the geocoding process. The translation step, also called address matching, is where a series of algorithms are applied to the address in order to to acquire the coordinates for the address.
1.2.1.1 Normalization
The first step of the geocoding process. It is the transformation of a human readable ad-dress into a programmatic representation of itself. This involves applying some transfor-mations [CCZ02] (such as lower casing the text, or removing punctuation) which convert the address into an internal format, rigidly defined, that the geocoder is expecting to find in the following step. Two main concerns are tackled in this step: name normalization and address components identification, as shown in Figure1.2
Technically, it is possible to build a geocoding service without address normalization. However, at the very best, the resulting service would be very lacking in terms of results, since the absence of normalization implies that addresses are matched exactly as they come from the source, character for character. Most services will implement at least some degree of normalization. As the normalization applied to the addresses improves, so do the results obtained in the following step.
1. INTRODUCTION 1.2. Problem Description
Avenida 8 de Julho 7 Torres Novas Portugal Av. 8 de Julho 7, TNV, Portugal
coordinates (lng, lat) confidence
Output Input
Address Normalization
Address Matching
Figure 1.1: Geocoding example of a simple address
substitutions could happen: Avn. : Avenue and St: Street. The same is valid for the
remaining parts of the address, such as locations and even street numbers: TNV:Torres
Novas, PT:Portugal and no7:7.
This step can have various degrees of complexity [GWK07]. Some transformations could be considered easy, such as token parsing and search in lookup tables, which could potentially be enough for most kind of word substitutions, and others are much more complex, such as probabilistic methods [CCW04] and machine learning techniques [CC02], which could be used to correct erroneous input and even fill missing information.
The next step involves the identification of the components of an address. It starts with the result of the name replacement step and goes from that line of text, which repre-sents an address, to the actual pieces that make it an address: door number, street name, postal code, and others. Each of these components are detected (if present) and stored for later use in the address matching step.
1.2.1.2 Matching
Translation of the normalized address into coordinates is performed using a variety of different algorithms. The most observed techniques being address lookup, hierarchical lookup and interpolation techniques, which will be described in the remainder of this section.
Address lookup is the simplest form of geocoding. A geocoder simply matches the normalized address with the information it contains in its knowledge base and returns the coordinates associated with it. If no match is found, other techniques are applied. One possible option is hierarchical lookup.
1. INTRODUCTION 1.2. Problem Description
Avenida 8 de Julho 7 Torres Novas Portugal Av. 8 de Julho 7, TNV, Portugal
Avenida 8 de Julho 7, Torres Novas, Portugal
street name door number locality country Name Normalization
Component Identification
Figure 1.2: Example of address standardization
Hierarchical lookup relies on the fact that addresses follow a hierarchical structure. Take for example the address “Avenida Júlio Dinis 7, Sacavém, Loures, Portugal”. There are four hierarchical levels present: street, two levels of administrative areas, and coun-try. A geocoder that fails to recognize the street can try to recognize the next step in the hierarchy instead of failing, which in this example would be the first administrative area. As a consequence, however, the accuracy of the result is decreased, which is why inter-polation techniques are used when there is enough information available. A concrete example of hierarchical lookup is the one used by Bing Geocoding API (Application Pro-gramming Interface), which includes reference to the use of this technique in the answers provided by the service [Bin13].
To provide better results, geocoding services may employ various techniques, such as linear interpolation, geometric interpolation, corner insets [Rat01, CT03] and street offset adjustments [Rat01]. Less common techniques include parceling and population distribution across areas [Gat89].
Linear interpolation is used when the geocoder can access information about street geometry and street numbers boundaries and positions. Let us take the street of the previous example, “Avenida Júlio Dinis 7”, and assume we know the street geometry, that the street buildings are numbered from one to twenty and that odd numbers are on the west side of the street and even numbers on the east side. With this information we can approximate the position of the building numbered seven: it will be on the west side of the street since it is and odd number, and it will be seven twentieths into the street, since there are twenty houses. The result of the application of this technique can be seen in Figure1.3.
1. INTRODUCTION 1.2. Problem Description
18 16 14 12 10 8 6 4 2 20
17 15 13 11 9 7 5 3 1 19
1 20
Figure 1.3: Geocoding with linear interpolation alone
road and into the locations of the houses. The new result can be seen in Figure1.4.
18 16 14 12 10 8 6 4 2 20
17 15 13 11 9 7 5 3 1 19
1 20
Figure 1.4: Geocoding with linear interpolation and street offset
This approach works well when buildings fill the whole street, but in streets starting (or ending) in a V-shaped bifurcation, houses often start later (or end earlier). In such cases there will be no buildings at the beginning (or end) of the street. To solve this problem, corner insets may be introduced. They force street numbering to begin (or end) only after a given distance and, in doing so, avoid the generation of results which locate buildings at street extremes. The final result is in Figure1.5.
The previous algorithms have a pre-requisite of information. It is assumed that infor-mation on street axis and street numbering and positioning is present. However, it may happen that some part of this information is not available, in which case they cannot be used. When this happens, one solution, before rising in the hierarchy, is to use geometric interpolation, to obtain the centroid of the street [VMN01]. The centroid of a street is the calculated center of the street, each point of the street is averaged and the results is the centroid.
18 16 14 12 10 8 6 4 2
20
17 15 13 11 9 7 5 3 1
19
1 20
Figure 1.5: Geocoding with linear interpolation, street offset and corner insets
1. INTRODUCTION 1.2. Problem Description
Calculated centroid moved
to street axis
Figure 1.6: Geocoding with geometric interpolation
The centroid will normally be calculated far away from a point on the street, because streets are no rectilinear. Because of this a new calculation is performed to find the street segment which is closer to the centroid, and the middle of that segment is the chosen position. This position is then returned as the approximate result. An example of appli-cation of this technique is shown in Figure1.6. Here, the calculated centroid is located almost behind the houses. To avoid this, the minimum distance between the centroid and the street axis was calculated, and the centroid was moved to the resulting position.
1.2.2 The problems
These and other techniques exist to improve the results of what is a very complex and error-prone process, and one of the problems of its complexity is that there are multiple points of failure.
Our research on the current geocoding services, presented in further Chapters, re-vealed some of those failures. The two most common errors where deduced to have their origins on out-of-date information and incorrect parsing of addresses.
1. Specific areas where every address failsare caused by out-of-date information or incorrect handling of address formats. This is normally seen in newly urbanized areas and is easy to detect, but hard to correct.
2. Full streets are geocoded to the same locationwhen the service being used does not correctly parse the street address.
1. INTRODUCTION 1.3. Context
The first problem is mostly a symptom of out-of-date information, it usually hap-pens on locations which have been recently constructed (or reconstructed), and when the services have not yet obtained the new information. The time it takes for the new information to replace the old old varies between services and their data providers.
The second problem is a symptom of both out-of-date information and incorrect pars-ing of addresses. It may happen when new streets are build, and a new format address is applied to them, in which case the geocoding service will not identify the street. When instead of having a new street built, an old one is remodelled and the street numbering updated, it may happen that services which have the old information incorrectly geocode the addresses based on it.
The third one is rarer, and harder to detect. It normally affects only one or two ad-dresses on unrelated locations, when, for some reason, incomplete information is ob-tained. One observed case was a building which had its numbering hidden from street view, and was not identified and included as a building in the street.
1.3
Context
Novabase is an international consulting and IT business which develops and integrates intellectual property with their partners and manufacturers. It offers business solutions in a wide array of areas, such as telecommunications and media, manufacturing and services, energy and utilities, aerospace and transportation, financial services, and gov-ernment and healthcare.
Novabase clients own and use georeferenced data, but it is being underused. They do not possess the means to correctly analyse and extract valuable information from it, and this prohibits them from gaining insights which can be attained through spatial analysis. There is a need to better explore the data these organizations possess. Insights on geographic analysis can greatly enhance the operations of the organizations, and are cur-rently becoming a central focus of their departments, with more and more organizations requiring the geographic analysis capabilities.
1.4
Objectives
The aim of this project to contribute to the improvement of geocoding results of organi-zational entities. We provide them a customizable framework which can both leverage the organization’s own intelligence and improve trust on the obtained results.
The target audience are small groups or single individuals within organizations who possess the potential to leverage geographic information but do not possess the required know how to accomplish it. The application will fill these users needs by opening the possibility to better understand their own information in its appropriate context, without the need to understand the GIS machinery behind it.
1. INTRODUCTION 1.5. Contribution
Our intention is to help improve the overall quality of the current geocoding services and technologies. We do not intend to replace the current set of solutions available, but to build an application which works with them to improve results. With that in mind we defined the following objectives:
• Allow the geocoding of a big number of addresses at the same time (batch/bulk geocoding)
• Decrease the barrier of entry and learning curve by providing abstractions over the GIS technologies
• Enabling and facilitating the use of information the organizations already possess
• Allow easy integration of new geocoding services into the process, thus allowing easy cooperation with future technologies
• Give access to the the results in such a way that facilitates its integration with other applications
• Permit quick and contextual visualization of results through the use of maps
• Allowing effortless detection and correction of geocoding problems
• Eventual inclusion of the resulting application both in other projects of Novabase and with their clients
• Provide great usability to facilitate the use of the application (This objective was posteriorly dropped due to time limitations)
1.5
Contribution
We hope to improve and contribute to the use of geographical information and spa-tial analysis within organizations. Transforming addresses, which organizations already have associated with their other information, into geographic coordinates is the first step which opens a myriad of possibilities.
Our solution is able to use as source various geocoding services already present, bringing the best of their results to a common application. One of its greatest advan-tages is its ability to leverage the information already owned by organizations and use it in cooperation with the results of the currently available geocoding services.
By bringing together the best results of the current services with owned information, the results can be improved upon without lost of quality, something which was previ-ously hard to do, when the choice was between using either of them, instead of using both.
1. INTRODUCTION 1.5. Contribution
our feedback system the application is able to detect problems before hand, and warn organizations about what it finds. This enables users to verify a big number of results with minimal effort, while still being able to pinpoint small irregularities which would otherwise be hard to detect. The biggest advantage of this feature is that it can be used with the results of mainstream geocoding services as well as the ones which comes from the knowledge base. This means that even without a knowledge base, quality and trust in the results of these services can still be improved upon.
By enabling organizations to use their already owned data and making them aware of the quality of the obtained results, we aim to improve their trust on GIS, thus propagating its wide-spread adoption in every organization.
2
State of the Art
To better understand the current standing of geocoding technologies Novabase required two different studies. One side objective of these studies was to allow us to grasp some of the fundamental concepts and to recognize common pitfalls.
One of the studies examines geocoding applications which are, at least partially, freely available for use by users. The applications are tested in various areas and results are compared between them. This allows us to considerate which are the practices that are worth emulating, and which we should avoid.
The second one studies two geocoding service APIs: Google Geocoding Service API and Bing Maps Geocoding Service. Both APIs results are analysed and evaluated, in an attempt to distinguish which would better server our purposes. Novabase showed interest in using the Google API, but if this analysis revealed the Bing API to be overall better suited, a move from one to the other would be done.
The conclusions derived from these studies are presented in the end of the Chapter, in Section2.3,Discussion.
2.1
Application Analysis
The current market of geocoding services was studied with the objective of better under-standing the current status of the technology. From this research we tried to learn which were bad practices we could try solve or avoid in our planned application.
2. STATE OF THEART 2.1. Application Analysis
1. Ability to geocoded addresses in bulkWe are testing in an organization environ-ment, for the use case where they need to geocode a big group of addresses
2. Ability to collect or visualize the resultsBecause we need someone way to verify the quality of those results.
3. Ability to geocode international addressesMany geocoders initially considerated only allowed for US addresses, but sample tests were composed of Portuguese ad-dresses
After the filtering we were left with five remaining applications:
• BulkGeocoder [Bul13]
• Find Latitude and Longitude [Fin13]
• Batch Geocoder [Bat13]
• GPS Visualizer [GPS13]
• Topo.ly [Top13]
The applications were tested on three aspects which were deemed to be the focus of our solution by Novabase: quality of results, features available, and usability.
Quality of results evaluates if the applications are able to geocode the given ad-dresses or if they fail, giving no results. It additionally evaluates whether the successfully geocoded addresses are actually correct or not. There are many case in which geocoders may give a wrong result, due to reasons described in previous Chapters, and these should not be considered as correct or valid.
Availability of features tested for additional features besides the geocoding of ad-dresses. We recognize that there is much value to be gained from whether or not appli-cations do something else to the results, such as showing them on a map or presenting them with a confidence level.
Functional aspects are not the only ones which influence the evaluation that users make of applications. Usability is a big part of it, and, unless users are severely con-strained, they will not choose an application with poor usability (even if it has slightly better results) over one with rich usability [RDA01].
Each area is discussed in detail in its own section:2.1.1,Geocoding Results Analysis,
2.1.2,Feature Analysisand2.1.3,Application Usability, respectively.
2.1.1 Geocoding Results Analysis
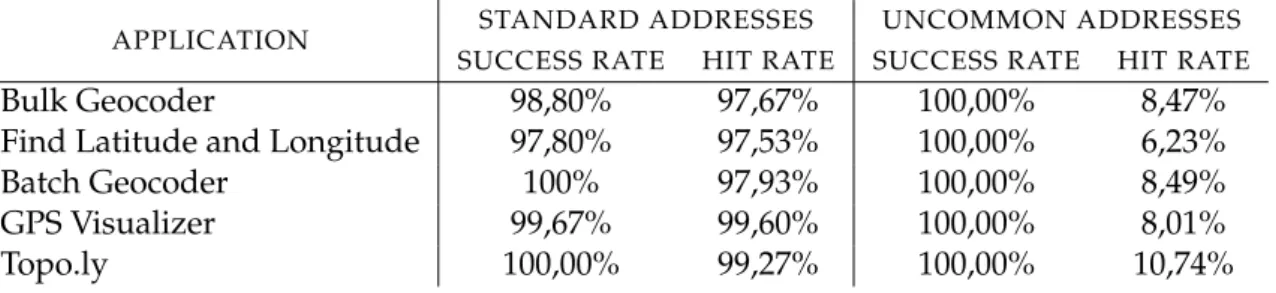
To test the quality of the results of the geocoding of addresses we produced two test cases. The first test case contained 1500 standard addresses, which is to say that no edge cases or newly constructed areas were included. The expectation was that the chosen
2. STATE OF THEART 2.1. Application Analysis
APPLICATION STANDARD ADDRESSES UNCOMMON ADDRESSES
SUCCESS RATE HIT RATE SUCCESS RATE HIT RATE
Bulk Geocoder 98,80% 97,67% 100,00% 8,47%
Find Latitude and Longitude 97,80% 97,53% 100,00% 6,23%
Batch Geocoder 100% 97,93% 100,00% 8,49%
GPS Visualizer 99,67% 99,60% 100,00% 8,01%
Topo.ly 100,00% 99,27% 100,00% 10,74%
Table 2.1: Quality of the researched applications’ results
applications would have no difficulties in geocoding these addresses, and that accuracy rate would be very high.
The second test case is more difficult. It contains 1117 addresses, all of which have some of the following properties:
• The address format is not the conventional for the country standards
• The area has been recently built or rebuilt, so information is likely to be out-of-date
• The area is cold, which is to say that is not very commonly searched for or otherwise interesting
The expectation for this file is that applications will have a hard time geocoding it, failing many results or otherwise appointing them wrong locations.
The results of the analysis are in Table2.1.
TheSUCCESS RATEcolumn stand for the percentage of addresses which were geocoded.
This does not mean that the addresses was mapped to its correct location, it indicates only that the geocoder gave some kind of result, even if wrong.
The HIT RATEcolumn makes the distinction. It contains the percentage of addresses
which were both successfully geocoded (the percentage of the previous column) and correctly located. This percentage is relative to the previous one. For example, if one geocoder has a 50%SUCCESS RATEand a 50%HIT RATE, this means that only 25% of the
addresses were geocoded to their correct locations.
As predicted, the first test case, composed of standard addresses, showed fairly good results. The application with the worse results was Find Latitude and Longitude, which failed in geocoding 2,20% of addresses. In this metric, the first three applications, Bulk Geocoder, Find Latitude and Longitude, and Batch Geocoder performance approached 98% while the other two, GPS Visualizer and Topo.ly approached 100%.
2. STATE OF THEART 2.1. Application Analysis
Nonetheless, when examining the results were led back to our expectations. Only around 10% or less of the addresses are correctly geocoded. What happened with most applications was that they recognized the streets in the addresses, but failed to provide correct building locations, either due to having no information on the actual disposition of buildings in the area, or because the parsing of the street number failed.
In most cases, in addresses with complex door numbering, such as 2.06.1.A, the num-ber was reduced to just the first or second numnum-ber, and the remaining discarded. This led to all addresses with similar door numbers being geocoded to the same position.
For undocumented areas the most common error was decreasing the precision of the street name. What we here call “decreasing of the precision of the street name” can be better described by an example. Think of the the address Street Channing and Crawford, which the geocoder does not recognize. What was observed was that some geocoders would drop parts of the address if that would increase the HIT RATE, and
in-stead give results in Street Channing or Street Crawford, if they existed. This lead to a higherSUCCESS RATEbut a lowerHIT RATE.
2.1.2 Feature Analysis
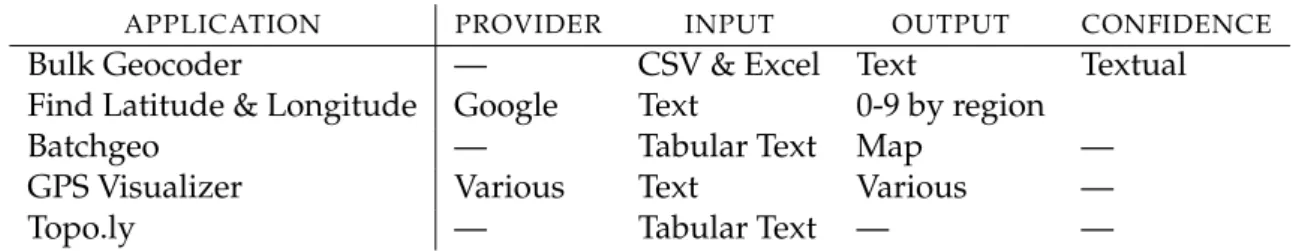
In this study, key features were identified and evaluated for all applications. These fea-tures were chosen based on the interests Novabase had for its solution. The results can be found in Table2.2, and the explanation of the features and their reasoning for selection is in the following list.
• ProviderThe name of the geocoding service the application uses. Since we intend to include the use of mainstream geocoding services in our solution, it is interesting to see how applications which also use them fare in their results.
• Input The formats in which the application accepts the information. Acceptance of many formats of data is considered important because it removes work load from users. The target users are businessmen which do not care for the problems involved in this, and expect their information to be simply accepted. Difficulties in this area would be considered a big downside for applications.
• Output the formats in which the application returns the geocoded information. This follows the same rational of the previous point, the most important point be-ing that the output is expected to be in the same format as the input, even though sometimes it is useful to have options which allow additional formats.
• ConfidenceWhether the application accompanies its results with confidence levels, and what kind of levels it uses. This is important to increase trust on the final results. It is widely known that geocoding results are not always accurate. The presence of confidence values may be the deciding factor on whether users trust the results of the application or not.
2. STATE OF THEART 2.1. Application Analysis
APPLICATION PROVIDER INPUT OUTPUT CONFIDENCE
Bulk Geocoder — CSV & Excel Text Textual
Find Latitude & Longitude Google Text 0-9 by region
Batchgeo — Tabular Text Map —
GPS Visualizer Various Text Various —
Topo.ly — Tabular Text — —
Table 2.2: Features of the researched applications
Of all the applications, only two of them discriminate their sources. Find Latitude and Longitude uses the Google Geocoding API, and GPS Visualizer gives users the option to choose either Google or Yahoo! BOSS PlaceFinder. Some of the applications considered in the initial phase of the research also used the Bing Geocoding Service or the MapQuest Geocoding API. Unfortunately they were not appropriate for testing. Some lacked the necessary features (e.g. not allowing batch address processing), others were limited to certain geographic areas (e.g. North America).
Bulk Geocoder is the only application supporting direct file upload, with the limita-tion that it must be in the CSV format or, if users require it, an Excel file sent vial email to the application’s team. After uploading the file, users have the ability to specify which columns of the file contain relevant information (e.g. which contains data on the address, locality or country). All other applications require text input through web forms. Find Latitude and Longitude accepts a syntax were each line represents a whole address, while Batchgeo and Topo.ly require a syntax similar to CSV, but where values are separated by a tab character instead of by a comma. GPS Visualizer and Topo.ly require the headers to have appropriate names, such as “Address”, while Batchgeo follows the example of Bulk Geocoder, and allows users to specify which columns contain which information.
The output of the applications is more diversified. Bulk Geocoder provides results in the same file format as they were sent, either CSV or Excel. Find Latitude and Longitude and GPS Visualizer deliver simple text, both using CSV syntax. Batchgeo is the only one which does not allow direct access to the geocoded information, instead it returns a URL. This link is to their domain, and leads to a page where a Google Map is displayed with the geocoded addresses. A relevant feature of this page is that it enables the manipu-lation of the appearance of the markers used to visualize the adresses, according to the data initially provided. It is even possible present additional information, which was not relevant for the geocoding process itself. GPS Visualizer is the most flexible application in this metric, it allows output in a myriad of formats: text with CSV syntax, geographic file formats such as KML or GPX, and various image formats such as JPEG or PNG.
2. STATE OF THEART 2.1. Application Analysis
APPLICATION INTERFACE INPUT GEOCODING OUTPUT TOTAL
Bulk Geocoder Neutral Good Neutral Good Good (2)
Find Latitude & Longitude Neutral N/A Neutral Good Good (1)
Batchgeo Good Good Good Good Good (4)
GPS Visualizer Bad N/A Good Bad Bad (-1)
Topo.ly Good Neutral Bad Good Good (1)
Table 2.3: Usability scores of the researched applications
the result, from 0 to 9, where 0 means that the geocoding failed and 9 that the result has precision to the building level.
2.1.3 Application Usability
Four usability features were analysed for each application. These four were determined to be the ones which would have the bigger impact on the evaluation of users. They are key points and users are certain to focus their attention on these areas.
A summary of the results are presented in Table2.3, where eachGoodadds one point to the classification of the application and eachBadsubtracts one point. The description of the meaning of the features (table columns) is as follows:
• InterfaceEncompasses several aspects of the application such as look and feel, ease of use and navigation, and error reporting and correction;
• InputDeals with everything the user has to do until the application is able to start the geocoding process, such as file uploading and structuring;
• GeocodingAnalyses user control of the geocoding process, for example, monitor-ing and network resilience;
• OutputExamines data retrieval and visualization capabilities of the application.
The following sections analyse the applications according to the chosen features. The analysis takes into account that a more feature-filled application will be more complex to develop and handling, providing more space to fail, while a less featured one will be able to efficiently do what it does better.
2.1.3.1 Bulk Geocoder
The interface demonstrates both good and bad practices, earning a Neutral score. It en-ables quick access to the geocoding process, even if with a lightly cluttered interface which easily distracts users. The instructions are clear and easy to follow but indistin-guishable from normal page text. There is no indication of which fields are required or not, and users are only notified when they try to start the geocoding process and fail due to incomplete requirements. Each field does, however, present information on what content it is supposed to be filled with.
2. STATE OF THEART 2.1. Application Analysis
The input step is one of the fields which earned a Good score. CSV files are the only ones supported for upload and the operation is well designed, with progress indicators and error handling. There is a step that allows the users to specify which columns contain which information, after which the geocoding process initiates.
The user does not, however, have any control over the geocoding process. There are no progress indicators or time estimations of any sort. Once the process starts, the only thing users can do is wait for an e-mail containing a link to the results. The only indication available is a note on the page, which refreshes every ten minutes, informing the user that the process is still ongoing. Despite that, the process is not affected by network instability, which gives it a ranking of Neutral.
Post-Geocoding improves the overall score, receiving a Good rating. Geocoding re-sults come with a confidence level, showing the precision of the rere-sults in text form (Building, Address, etc.). The results are safe on the application’s servers and can be verified before download. Unfortunately, there is no way for users to reach their results through the application, this is only possible by e-mail, when the geocoding process ends. Results can be downloaded in either CSV or Excel files after payment, which is based on the number of addresses processed. The downloaded files include all the original infor-mation, plus three additional columns: latitude, longitude and (optionally) confidence.
2.1.3.2 Find Latitude and Longitude
This Interface was rated as Neutral. It includes step by step, clear and easy to follow instructions. All the information about input of addresses and output of coordinates is described in detail and in an intuitive way. Although simple and concise, the interface is also disorganized and overly aggressive, which may scare potential users. Going through the main page in order to reach the one that does the batch geocoding is difficult, requir-ing the user to focus on an information dense area with potentially misleadrequir-ing names.
Input is inserted through a simple text area, which accepts one address per line. This is a case where usability can only be measured on the ability to copy and paste, and since that is something handled by the browser, not the application, it is not valid for this study. The Geocoding process received a Neutral rating. The process can be monitored, every time an address is geocoded, the results are always displayed and are immediately available for use. The whole process is susceptible to network failures, but when they happen the results are not lost. Resuming the process is realized manually and requires the users to check themselves where the process failed and resuming from there.
2. STATE OF THEART 2.1. Application Analysis
2.1.3.3 Batchgeo
This application’s interface received a Good rating. It gives the user a pleasant and fluid experience with direct and simple instructions. There are examples of the kind of input data the application expects and once users insert their own it is validated and can be verified.
The input step also earns a Good rating. Users can tell the application what is kept in which fields and there are examples both of what is expected and of the outcome of the process. Extraneous information is safely ignored by the application and does not impede the geocoding process.
The Geocoding process, once again, receives a Good rating. The progress can be mon-itored and is cancelable. When the operation is cancelled, the user still has access to the geocoded information, and can even continue to the output step with it. However, it does not tolerate network failures. When they do happen, it halts, and although the processed information is not lost, the steps to salvage it are not intuitive; it is also impossible to resume it without starting over.
Even though the output options are very limited, the one they do provide is very well designed, which gives this application a Good rating. Results are presented on a map enabling manual correction and the generated data is permanently stored within the application. Even though it no confidence indication is provided, verification of small sets of results are facilitated by the map visualization that the application provides.
2.1.3.4 GPS Visualizer
The Interface for this application evaluated to a Bad rating. Instructions are undifferen-tiated from main text and, once found, are unclear and hard to read. Input fields are disorganized and, aside from the label, no explanations for their purpose is provided.
As with Find Latitude and Longitude the input step on this application is handled by the browsers ability to copy and paste the information, and as such it can not be evaluated.
The Geocoding process earned the only Good rating of this application. It can be monitored and allows its cancellation, although not its resuming. It is susceptible to network failures and the process halts as if users had pressed the cancel button. Every time an address is geocoded the information is immediately shown to the user, both in text and on a map. Validation of information can be done using this map.
The output step comes back down again to a Bad rating. The only two factors in favour are that results are accessible within the application and are easy to export as textual CSV data, a geographic file type or as an image. This is, however, not enough to overcome the fact that data verification is hard for more than a small number of requests. Results are temporary and closing the site will void any work done.
2. STATE OF THEART 2.1. Application Analysis
APPLICATION RESULTS FEATURES USABILITY
Bulk Geocoder - · ·
Find Latitude and Longitude - · ·
Batchgeo - - +
GPS Visualizer - - ·
Topo.ly - · +
Table 2.4: Usability scores of the researched applications
2.1.3.5 Topo.ly
This application earned a Good rating on the Interface. Besides the fact that is has a few interface elements that are not intuitive and may confuse the user, it is well designed. The overall experience is smooth and pleasant, its use is easy and responsive, and there are clear and contextualized instructions on every step of the process.
The input step gained a Neutral rating. It accepts extraneous information on input, saving the user the trouble of its manual removal. It has a validation step but it is not user friendly. Most error messages are too cryptic for normal users, leaving them confused and without alternatives to proceed. To know which types of header the application expects, users need to leave the process and look for a solution in the FAQ page.
Failures in the Geocoding process bring it down to a Bad rating. The process can be monitored and cancelled, but when users cancel the process all data gathered until then is lost. The application has no way to recover from problems in the network and any of those problems voids the operations. There is an indicator showing the progress of the process, but no partial results are given.
In the output step it comes back to a Good rating once again. The visualization of data is highly simplified by using a map, the generated data is permanently stored, and results are accessible within the application without requiring its download. Unfortunately, we could not gather any information on file downloading, since every download option is blocked until payments are provided. Additionally, no confidence indicators of any kind are provided.
2.1.3.6 Analysis Conclusion
The overall evaluation of the five applications can be found in Table2.4. As mentioned before, every application performs poorly when geocoding edge cases addresses, posi-tion most addresses in the wrong locaposi-tions. In itself, failing to geocode is not necessarily bad, what brings the score down is that all the applications geocode almost every address on the wrong locations, leading the users into erroneously believing they got accurate re-sults. It is not wrong to fail, but it is wrong to give incorrect rere-sults.
2. STATE OF THEART 2.2. API Comparison
Avenue D 13, Mayhem 13 Avenue D Mayhem
full address door number locality street name
formatted address location address line
Avenue D 13, Mayhem Mayhem Avenue D 13
BING
Figure 2.1: Street components information
out wrong but with good confidence levels, only further misinforms users. Batchgeo and Topo.ly do not provide any confidence levels with their results, but compensate by al-lowing their cartographic visualization. This is an ad-hoc verification mechanism, and while is not as usable as confidence values, in this particular case, where most results come out wrong, it provides more accurate information to users. The lack of ability to really give useful and true confidence metrics is what stops the applications from being given higher scores.
While none of the applications have particular detrimental usability, most of them could be improved. The exception being Batchgeo, which earned positive evaluations on every front. The one downside of the application, in comparison with others, is the lack of access to the generated data, but for what the application was designed to do, its usability is an example to follow.
2.2
API Comparison
A requirement for this project was the detailed comparison of two different geocoding APIs: Google Geocoding API and Bing Maps Geocoding Service. Along with the exam-ination of the documentation of both [Bin13, Goo13], they were also tested to obtain a more deep knowledge on their inner workings and ease of use.
When they are not certain to provide a correct result, both services will answer with more than one set of coordinates. One of them will normally fit the query better than the others and will come in first place in the ordering of the results.
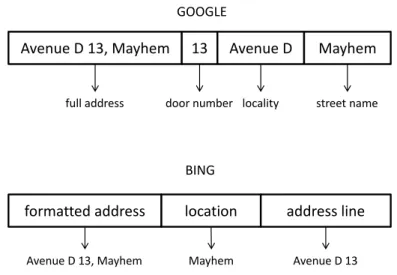
As can be seen on Figure2.1, both Google and Bing will provide information on the type of result (street, road, locality, etc) both for the full address and for each address component, but the data comes organized in a slightly different way.
While in Bing we have direct access to each component of the address, in Google developers are forced to search every component until they find the one they are looking
2. STATE OF THEART 2.2. API Comparison
BING
location type
confidence calculation method trust
• High
• Medium
• Low
• Exact
• Interpolation
• Interpolation + offset
• Geometric center
• Good
• Ambiguous
• Up In Hierarchy
• Exact
• Linear Interpolation
• Geometric Interpolation
• Approximate
Figure 2.2: Different types of confidence information for each service and their values
for. This comes at the cost of future flexibility. If a new type of address is created, Google does not need to change it’s data structure to accommodate for it, while Bing will have to introduce a new version of the API, which can represent it, or be forced to use a non-standard field.
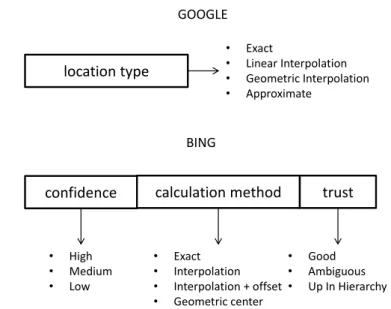
Both services have a field indicating how the value was calculated. Google only dif-ferentiates betweenexact,linear interpolationandgeometric interpolation. Results which do not fit into this category will appear asapproximate. Bing has one more option,linear inter-polation with offset, but the most inaccurate option isgeometric interpolation, which means the worse results will all gather under this value.
Bing comes with two more fields which can be used to infer confidence and accuracy on the results. The first one is a field called confidence, which can have the values of “Low”, “Medium” or “High”. The other,trust, has three possible values:Good, meaning the result has a good quality;Ambiguous, meaning there is more than one possible result for the address; andUp In Hierarchy, which indicates that the service was not able to find a result for the more precise address and instead returned the one above it (for example, returning the position of the location (e.g. the town) instead of the street). To have a clearer, less-textual idea of what each service has, check Figure2.2.
2. STATE OF THEART 2.2. API Comparison
BING
Best Match Candidate Match Candidate Match …
Full Information Coordinates + Calculation Method
Coordinates +
Calculation Method …
Best Match Candidate Match Candidate Match …
Full Information Full Information Full Information …
Figure 2.3: Information given for each candidate result in both APIs
requests will be made, while with Google there is no such need, since all the information comes in the first response.
Not as important for the results themselves, but still interesting while displaying them in a map, is that both services answer with a bounding box. This box has coordinates which make up a rectangle, which can be used as an appropriate viewport when focusing on the cartographic representation of a single result.
2.2.1 Google Geocoding Service API Analysis of Results
Becuase Novabase required the use of Google Geocoding Service API, a more thorough analysis was performed on this service’s results. The second sample file mentioned in
2.1.1, which had the more difficult addresses, had its results carefully analysed. The results are presented in this section.
The minimum accepted distance from a real location to a result given by a geocoding service varies with the intended use of the information, but for the purposes of these analysis, twenty five metres will be considered the maximum distance at which a location is considered correct. A larger difference will be interpreted as a geocoding failure.
Analysing Figure2.4it is possible to see that only 20% of the results fall within twenty five meters of the correct location. The remaining 80% are geocoded far away, rendering them erroneously located. If one assumes that results which are more than one kilometre away from the correct location are so because the address has been incorrectly parsed (and as such, can be corrected), there are still 50% of addresses which are positioned at a distance of more than twenty five metres from the real location.
Despite that, one could argue that Google results come with a confidence result asso-ciated, which can be used to avoid accepting wrong results as correct. Further analysis, shown in Figure2.5shows the confidence values which accompany Google results.
This analysis is somewhat skewed, since the data was purposely selected such that Google would fail many of the results. By removing the failed results it is possible to get
2. STATE OF THEART 2.2. API Comparison 8% 12% 22% 15% 11% 1% 30% 0% 5% 10% 15% 20% 25% 30% 35%
10m 25m 50m 100m 250m 1km 1km+
Per cen t o f ad d resse s w ith in d istan ce
Distance from real location
Distance from Google location to reality
Figure 2.4: Difference in distances from Google Geocoding Service coordinates to the real locations
29%
7% 1% 1%
61% 0% 10% 20% 30% 40% 50% 60% 70% ROOFTOP RANGE INTERPOLATED GEOMETRIC CENTER
APPROXIMATE NO RESULTS
P er cen t o f r esu sl ts w ith c o n fi d en ce Google confidence Google confidence results
2. STATE OF THEART 2.2. API Comparison
76%
18%
3% 3%
0% 10% 20% 30% 40% 50% 60% 70% 80%
ROOFTOP RANGE INTERPOLATED GEOMETRIC CENTER APPROXIMATE
Per ce n t o f r esu lts w ith c o n fi d en ce Google confidence Google confidence results
Figure 2.6: Variance of Google Geocoding Service’s confidence on its results (not includ-ing failed results)
a better idea of the results obtained. The modified graph is in Figure2.6.
From the graph it is possible to infer that in 76% of the results, the confidence value provided is the highest provided by the service. This was an unexpected result. The data being used for testing was chosen so that Google would have trouble geocoding the addresses, a behaviour which can be observed in the graph which does not omit the failed results (Figure2.6). It was, thus, to be expected that only a very small part of successful results would be accompanied of a good confidence value.
To better understand this behaviour further analysis was done on the obtained data. For each confidence level the distances from the results to the real locations was gathered. The most important results are displayed on the graph of Figure2.7.
Only 27% of the results are within the bounds of a valid location (an area with a radius of twenty five metres). The remaining 73% results are displaced from the true location by more than twenty five metres. Nonetheless, Google erroneously attributes them the best confidence value they attribute to any result that they generate, theROOFTOPconfidence level, which indicates that the result is in the exact location of the address.
From these results one can now understand how the service gives a 76% best-accuracy rate for areas which were explicitly selected to target its lack of accuracy. The Google Geocoding Service does indeed have a low accuracy on the areas, but it reports its results with high accuracy.
If one trusts only the best results from Google and disregards results which do not come with the best confidence level, ROOFTOP, then 29% of all given addresses passed onto it will have at least one result. Of those 29%, only 27% will be within the twenty five
2. STATE OF THEART 2.3. Discussion 12% 15% 27% 19% 13% 1% 13% 0% 5% 10% 15% 20% 25% 30%
10m 25m 50m 100m 250m 1km 1km+
Per cen t o f r esu lts
Distance from real
Distance of Rooftop locations from real
Figure 2.7: Difference in distances withROOFTOPconfidence
metre radius which we ascertained would be the area for a correct result. This means that of all the addresses passed onto the service, only 7,83% of them will carry an acceptable correct codification for the addresses. Taking into account that 71% of the addresses give no valid results, we end up with a total of 21,17% of the total addresses being erroneously geocoded.
Extending the previous analysis to also include results with confidence levels besides
ROOFTOPleads to another interesting development. As can be seen in Figure2.8, if one takes into account all valid results, there will be an almost threefold increase in the accu-racy of the results, which means that some results for which the service gives less than perfect accuracy do end up being correct. This leads us to the conclusion that the confi-dence is not correct, and that it should not be trusted.
2.3
Discussion
From the first study, Application Analysis, we concluded that all applications are cer-tainly usable if one assumes the data does not contain problematic addresses. However, it is not easy for users to distinguish between addresses which the applications are ex-pecting and which they are not, services are expected to answer all queries with the same quality, but this does not happen. The fact that applications do not provide any means for users to ascertain their trust on the results only worsens this, making most applications unusable at organizational levels.
2. STATE OF THEART 2.3. Discussion
71%
61% 21%
18% 8%
21%
Only Rooftop All Valid
Accuracy of Google's results
Failed Successfully and incorrect Successfully and correct
Figure 2.8: Quality of Google’s results against real locations
support for confidence values is still rudimentary, there is little variety and flexibility on service providers and ease of use is still constrained. All these are factors which keep users from using these applications and their geocoding technologies.
Our proposed solution helps solve these problems in two different ways. The first is by allowing the insertion of a knowledge base which is capable of augmenting the overall quality of the results, and the second is the ability the final application provides of allowing its users to correct the results obtained by the geocoding process.
As for the second study,API Comparison, it revealed that none of the APIs have an overall superiority over the other. Bing has more information on confidence results, but the added information, when compared with Google, is not enough to be of significance. Google responses come with more information on candidate addresses, but this is the standard result information which the user may not need, resulting only in wasted band-width.
In the end, the choice was made not from a perspective of the best technology but from a perspective of context and familiarity. This was a strategic choice by Novabase, the rationale being that as Google Maps are more widely used and recognized, it makes sense to choose the technology which most resembles what is already being used.
The further studies done on the results of the Google API revealed to be very interest-ing. The failure of the confidence levels was unexpected and if not resolved would be a serious problem for users’ trust in our proposed solution. However, the feedback module included in the final application handles this problem well. By voiding the trust in con-fidence levels and doing its own analytical analyses it provides users with the necessary hints and warnings which are a better fit for indicating confidence on the results.
3
Methodology
Geocoding is a complex process. Data, such as addresses and geographic coordinates, need to be collected in the field to be processed and inserted into a knowledge base. The address component of the data is not uniform, different countries have different rules for describing an address, and even a single country can have more than one way do to it.
To better understand this problematic and obtain insights which could be useful to the project, we took the initiative of collecting data in the field.
There was one type of address which was known not be handled correctly in main-stream geocoding services, due to it having a specific format, which breaks current rules of door numbering in Portugal. Further testing on some of those services, such as Google and Bing Maps, revealed that this was indeed the case. Of the affected zones we choose two inParque das Nações, Lisboaand visited them to collect the correct addresses and co-ordinates.
To collect the data, aerial images of the chosen zones were printed to take to the field. Once there, we would highlight in each sheet of paper each of the addresses found, and note down the street and door number. The compilation of addresses resulted in around three hundred addresses collected over the span of one week. The addresses were then georeferenced and converted into digital format using a GIS application. The locations of the addresses were plotted onto a digital aerial map, and from those the application was able to retrieve the geographic coordinates for each location.
The knowledge base now has three hundred addresses, but these only cover one very specific area, in which it was feasible to gather data via field work. To widen the spec-trum of our data we used geographic information on street addresses provided by the
3. METHODOLOGY
Geocoding
Analyses Mapping
Correction Coordinates
obtained Addresses
Corrections of address or of coordinates? Address
Coordinates
Geocoded addresses
Figure 3.1: Work flow of our proposed solution
our knowledge base.
With these two sources loaded into our knowledge base, the number of addresses available rose to eleven hundred. With these addresses it became possible to test main-stream geocoding services against real data. Of those available Google Geocoding Service was the chosen one.
Taking into account the previously established objectives and this information ob-tained through the studies done inState of the Art, we devised the work flow shown in Figure3.1. It is important to note that the knowledge base is not meant to cover every single address it may be thrown at it. It should be thought of as an improvement on the quality of the results of other geocoding services, to be used side by side with them to obtain the best quality data available.
However, to obtain the most accurate geographic coordinates, Novabase clients must provide a series of addresses to build the knowledge base for the application. The final product is still able to provide functionality even without it, but this knowledge base is the one with the potential to greatly increase the overall quality of the results.
The work flow is composed of six distinct steps:
1. AddressesThe provision of addresses to the application
2. Geocoding The process by which the application obtains coordinates for all the addresses
3. Coordinates obtainedThe coordinates are saved and made available