Mestrado em Física
Time-of-Flight Secondary Ion Mass Spectrometry: New
application for urinary stones analysis
Dissertação para obtenção do Grau de Doutor em Engenharia Física
Orientador: Orlando Manuel Neves Duarte Teodoro
Professor Associado
Departamento de Física
Faculdade de Ciências e Tecnologia
Universidade Nova de Lisboa
Júri:
Presidente: Prof. Doutora Maria Adelaide de Almeida Pedro de Jesus Arguentes: Prof. Doutor Reinhard Horst Schwarz
Doutor Paulo Jorge Amorim Madeira
Vogais: Prof. Doutora Maria Adelaide de Almeida Pedro de Jesus Prof. Doutor Orlando Manuel Neves Duarte Teodoro Prof. Doutor João Erse de Goyri O´Neill
Doutor Alexander Tolstoguzov
Copyright © Chaudhry Amjad Ali Ghumman, FCT/UNL, UNL.
i
I would like to thank my supervisor, Prof. Dr. Orlando M.N.D. Teodoro, who kindly provided me
the opportunity to work on this interesting, novel and valuable project. His abundant experience in
instrumentation helped me to sort out many difficulties, which I am very grateful. He also
introduced me to other groups and the departmental workshops, so that the co-operation with
them could be done in a smooth way. Furthermore, the thesis will not have been achieved to this
level without his direction.
I would also like to thank Prof. Dr. A.M.C. Moutinho, who provided me the scientific support
during whole this project, especially in the scientific discussions. His friendly companion and
suggestions in aspects other than research gave me many joys.
I would also like to thank Mrs. Olga M. T. Carreira (Serviço de Patologia Clínica do Hospital
Garcia de Orta, Almada) and Mrs. Clara Barrento (Grupo Joaquim Chaves, SGPS, S.A.) for
providing valueable urinary stone samples for this scientific research.
I would like to acknowledge my group members Dr. Alexander Tolstogouzov and Dr. Nenad
Bundaleski for providing me many useful suggestions to finalize the discussion of this thesis.
I would also like to acknowledge Mr. A. Santos and all the coworkers from CEFITEC for their
companionship.
I owe very much to my wife Mrs. Lubna who supported and encouraged me continuously.
Finally, I would like to acknowledge Foundation for science and Technology (Grant No.
iii
Time-of-flight secondary ion mass spectrometry was used to study the real urinary stones and the
results were compared with those from commercially available urinary calculi organic compounds
and minerals. Organic urinary stone components like uric acid and cystine were clearly identified by
their respective protonated molecules [M+H]+ and deprotonated molecules [M-H]-. With TOF-SIMS analysis we clearly distinguished between uric acid and its sodium/potassium urates. The mass spectra
of cystine stones were compared with those measured for the standard compounds, cystine and its
monomer cysteine. Similar spectra were obtained for the stones and cystine. The most important
identification was based on the existence of the protonated molecules [M+H]+ and deprotonated molecules [M-H]-.
The calcium oxalate (COX) stones were recognized by the presence Ca+2, Ca+, CaO+, CaOH+, Ca2 +
,
Ca2O +
, Ca2O2 +
, and Ca2O2H +
ions. The calcium phosphate stones were recognized with the presence
of aforementioned ion peaks for calcium oxalate along with additional phosphate containing ions.
Moreover, the phase identification of calcium phosphates was achieved in the positive SIMS mode on
basis of the PO+/POH+ and CaPO2 +
/Ca2O +
peak ratios. We also quantified the calcium phosphate (up
to < 3%) in the human calculi containing calcium oxalate as major or minor component, which is of a
great interest for medical community, and the reliable phase identification of calcium phosphates also
has potential application in bio-implant technology.
Struvite (NH4MgPO4.6H2O) stones, also known as infection stones due to their association with
urea-splitting bacteria were confidently identified by the presence of its major characteristic peaks of
NH4+, Mg+, PO2-, PO3-. We also observed uric acid, sodium/potassium urates, apatite
[Ca10(PO4)6(OH,CO3)] and tri-calcium phosphate [Ca3(PO4)2] in struvite stones.
In our studies we also identified unusual components namely calcium formate Ca(HCO2)2, metabolite
of vitamin B6 (4-deoxypyridoxine 5-phosphate) and iodine in three human stones.
Last but not least, the VG Ionex TOF-SIMS instrument used for this new application was upgraded
which enables us to perform extensive experimental work for this study and for plentiful collaborated
work published and being prepared for publications.
Table of Contents
1. INTRODUCTION ... 1
1.1 Urinary calculi ... 1
1.2 Current analytical approaches ... 3
1.3 Thesis overview ... 3
2. SECONDARY ION MASS SPECTROMETRY ... 7
2.1 SECONDARY ION YIELD ... 8
2.1.1 Sputtering of inorganic materials ... 9
2.1.2 Sputtering of organic materials ... 10
2.1.3 Ionization ... 10
2.2 Characterization of samples from the SIMS measurements ... 17
2.2.1 S-SIMS ... 17
2.2.2 G-SIMS ... 18
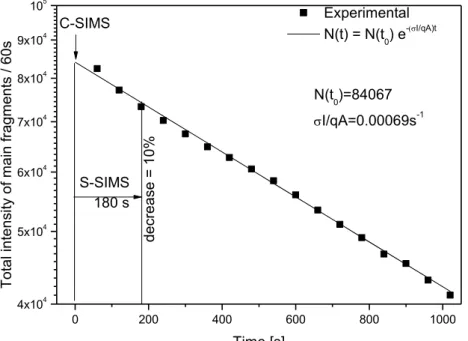
2.2.3 C-SIMS (Constructive-SIMS) ... 20
2.2.4 Chemical Imaging ... 25
2.2.5 Depth Profiling ... 25
3. TOF-SIMS instrumentation and sample preparations ... 27
3.1 Principles of Time of Flight-SIMS ... 27
3.2 The Poschenrieder analyzer ... 29
3.3 Primary ion sources ... 31
3.3.1 Field emission Liquid metal ion source (LMIS) ... 31
3.3.2 Gas ion source ... 33
3.4 VG IONEX TOF-SIMS instrument ... 34
3.4.1 Data acquisition and control system ... 37
3.4.2 Software ... 39
3.5 New tip wetting technique with gallium ... 41
vi
3.7 TOF-SIMS analysis reference chemicals and stones ... 45
4. TOF-SIMS analysis of organic calculi ... 49
4.1 Uric Acid stones ... 49
4.1.1 TOF-SIMS analysis of uric acid stones... 51
4.1.2 Comparison of uric acid stones by scattered intensity plots... 54
4.1.3 TOF-SIMS analysis of sodium and potassium Urate stones ... 56
4.2 Cystine stones ... 58
4.2.1 TOF-SIMS analysis of cystine stones ... 58
4.3 Cholesterol stone... 64
4.3.1 TOF-SIMS analysis of cholesterol stone ... 65
5. TOF-SIMS analysis of calcium oxalate urinary stones ... 69
5.1 Calcium oxalate stones ... 69
5.1.1 TOF-SIMS analysis of whewellite and weddellite ... 71
5.1.2 Identification of calcium formate in calcium oxalate stone ... 74
5.1.3 Core and shell as complementary calcium oxalate and uric acid ... 76
5.1.4 Compositional comparison of calcium oxalate stones with reference chemical ... 79
5.6 Doubly charged calcium ions yield enhancement ... 81
6. TOF-SIMS analysis of calcium phosphate stones ... 83
6.1 Calcium phosphate stones ... 83
6.1.1 TOF-SIMS analysis of brushite stone ... 84
6.1.2 TOF-SIMS analysis of hydroxyapatite stone ... 86
6.1.3 TOF-SIMS analysis tri-calcium phosphate ... 89
6.2 Phase identification of calcium phosphates ... 90
6.2.1 Matrix dependent ion yield observed for doubly charged calcium (Ca+2) ... 96
7. TOF-SIMS analysis of struvite stones ... 97
7.1 Struvite stones ... 97
7.2 TOF-SIMS analysis of Struvite stones ... 99
7.4 TOF-SIMS analysis of struvite stone containing calcium phosphate ... 104
7.5 Phase identification of calcium phosphate in struvite ... 106
7.6 Relative sensitivity factor and quantification of calcium phosphate in struvite ... 109
7.7 Sodium and potassium association with calcium phosphate and struvite components ... 112
8. CONCLUSIONS ... 115
9. Appendix A... 121
9.1 The constructive-SIMS analysis of reference glycerol ... 121
10. Appendix B ... 123
10.1 The TOF-SIMS analysis of synthetic Ca(H2PO4)2.H2O ... 123
List of Figures
Figure 2.1. Schematic diagram of the SIMS principle 8
Figure 2.2. Sputtering yields of Ni by different projectiles versus projectile energy. Also shown are values calculated using the transport of recoils and ions in matter (TRIM) Monte Carlo simulation program. 9
Figure 2.3. The relative normalized ion yield of Ca+, Ca+2 and Mg+ from the sample with Ca/Mg atomic ratio of 2.373 under Ga+ bombardment. Due to surface modification the ion yield of singly charged calcium (Ca+) increased while magnesium(Mg+) decreased, the decrease similar to magnesium was observed for doubly charged calcium (Ca+2) [from the present work]. 11
Figure 2.4. Energy-level diagram for an atom or molecule characterized by its highest occupied (image-potential-upshifted) valence level I and lowest unoccupied (downshifted) affinity level A interacting with a metal surface. The lowering of the affinity level allows a Fermi-level electron from the substrate to tunnel into the atom/molecule thus creating a negative ion. This possibility is turned on at a separation Zc where
the shifted affinity level coincides with the Fermi level. 12
Figure 2.5. Variation of an atomic affinity level Ɛa with distance Z from a metal surface. Ɛa crosses the Fermi level ƐF at Zc, and approaches the free atom affinity level –A. As the atom moves away from the
surface, the width Δ of the level decreases. 13
Figure 2.6. Positive TOF-SIMS spectra from the uric acid sample. Neutral Cs was deposited prior to
analysis. 17
Figure 2.7. Static SIMS spectrum from Fe3O4-cysteine used catalyst acquired at Ga+ impact energy of 9
keV. 19
Figure 2.8. Static SIMS spectrum from Fe3O4-cysteine used catalyst acquired at Ga+ impact energy of 5
keV. 19
Figure 2.9. scattered plot of the respective intensity ratios of Fe3O4-cysteine spectra at 5 keV to 9 keV using Ga+ ion beam with fixed extraction potential of +5 keV applied to sample. 20
Figure 2.10. Positive ion G2-SIMS of Fe3O4-cysteine spectrum, corresponding S-SIMS is shown in Figure
2.8. 20
Figure 2.11. Experimental and extrapolated total intensity of arginine characteristic ion peaks. [present
work]. 22
Figure 2.12. Intensities of selected peaks (m/z 43, 59, 60, 70, 87 and 175) of arginine sample as function of time (surface damage,) and the ion peak of m/z 27 is mainly from substrate (Al). 22
Figure 2.13. Positive ion TOF- SIMS mass spectrum (1) from arginine sample acquired at Ga+ impact
energy of 9 keV using data acquisition time of 5 minutes. 23
Figure 2.14. The follow-up TOF- SIMS spectrum (2) using same conditions from same area. 23
Figure. 2.15. Ratio of positive ion intensities from spectra shown above acquired form arginine on Al
substrate with impact energy of 9 keV Ga+. 24
Figure 2.16. C-SIMS spectrum, corresponding TOF-SIMS (spectrum#1) shown in Figure 2.13 [present
work]. 25
Figure 3.1. Positive ion TOF spectrum from molybdenum surface. 28
Figure 3.2a illustrates the focusing properties of the analyzer. An image of the source is projected into the centre plane of ESA and from there to detector. In other words, the system projects a stigmatic image from the sample to the detector. Electrostatic lenses can be employed to improve the angular acceptance
of the system. 29
x
Figure 3.3. Schematic diagram of gallium liquid metal ion source along with electrical connections (left),
Ion source assembly of MIG 300PB ion gun (right). 31
Figure 3.4: simulation of a Taylor Cone. 32
Figure 3.5: Schematic of duoplasmatron source. 33
Figure 3.6: Gas cluster ion source. 34
Figure 3.7.Schematic view of the upgraded TOF-SIMS VG Ionex IX23LS. 35
Figure 3.8. Ion beam column of MIG 300PB ion gun. 36
Figure 3.9. Schematic diagram of the newly developed data acquisition and control system. 38
Figure 3.10. The Call Library Function in LabVIEWTM interface. 39
Figure 3.11: VIs mainly used in the software to communicate with TDC and to acquire the registered time
events. 41
Figure 3.12. Secondary electron image giving topography of DLC sample (left), chemical image of Cs+ spots deposited on a niobium substrate (middle), and complementary image of Nb+. These images were
acquired and processed with new data acquisition system [from authors’ own work]. 41 Figure 3.13. Schematic of electro-polishing of tungsten tip for LMIS. 42
Figure 3.14. Powder on piece of Al foil (left) rasped and dusted, the resulting sample on right 44
Figure 3.15: Positive ion static TOF-SIMS mass spectrum of reference Al foil without any cleaning with
either chemically or sputtering with ion beam. 45
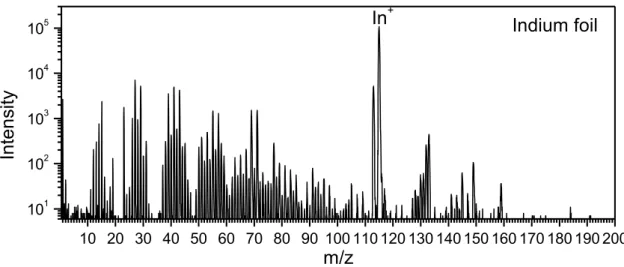
Figure 3.16: Positive ion static TOF-SIMS mass spectrum of reference indium foil scratched with clean
knife. 45
Figure 3.17. Variation of spectral intensity with secondary ion extraction/acceleration voltage, measured
for Mo+ from oxidized molybdenum sample [68]. 47
Figure 4.1. The molecular structure of uric acid; mol. wt. 168 51
Figure 4.2. Negative ion spectra of reference uric acid (a) and that of human stone UA1 (b) [48]. 52
Figure 4.3: Possible structure of negative ions observed at m/z 167 (a), 151 (b), and 124 (c). 52
Figure 4.4. Positive ion spectra of reference uric acid (a) and that of human stone UA1 (b). 53
Figure 4.5: Possible structure of positive ions observed at m/z 169 (a), 191 (b), 153 (c), and 126 (d). 53
Figure 4.6. Morphological appearance of the stones identified with TOF-SIMS as uric acid UA2 (a) and
UA3 (b). 54
Figure 4.7. The scattered plot comparison of UA1 with UA2 (a) and UA2 with UA3 (b). 55
Figure 4.8. The resulting intensity scattered plot after elimination of interfering peaks of glycerol with
uric acid in UA2 and UA3. 55
Figure 4.9. The urate stones (urate1) in the shape of spherical balls. 56
Figure 10. Negative (a) and positive (b) TOF-SIMS spectra of urate stone. 57
Figure 4.11. Morphological appearances of human stone (a) and dog stone (b). 59
Figure 4.12. The positive TOF-SIMS mass spectra of reference cysteine (a), cystine (b) and human kidney
stone (c). 60
Figure 4.13. Solubility of cystine at different urinary pH values. 61
Figure 4.14. The negative TOF-SIMS mass spectra of reference cysteine (a), cystine (b) and human
kidney stone (c). 62
Figure 4.15. The positive TOF-SIMS mass spectrum of dog stone. 63
Figure 4.17. The positive TOF-SIMS mass spectra of gallstone: (a) freshly prepared sample and (b) after
3 days of ageing in ambient conditions [28]. 66
Figure 4.18. The negative TOF-SIMS mass spectrum of the freshly prepared gallstone sample on Al (a)
and indium substrate (b). 67
Figure 5.1: Typical morphology of (a) whewellite (S2) (calcium oxalate monohydrate) and (b) weddellite
(calcium oxalate dihydrate) stones (S1). 71
Figure 5.2: Positive ions mass spectrum of weddellite (S1) shown in Figure 5.1b. 72
Figure 5.3: Positive ion mass spectrum of whewellite (calcium oxalate monohydrate) stone (S2). 72
Figure 5.4. TOF-SIMS positive ion spectra of S3 (a) and S4 (b). 74
Figure 5.5. TOF-SIMS negative ion spectra of S3 (a) and S4 (b). 75
Figure 5.6: visual appearance of stones (S5) with dark brown core and light yellow shell. 76
Figure 5.7: Positive TOF-SIMS spectra from (a) the core and (b) shell of stone S5 77
Figure 5.8: visual appearance of stone (S6) with light yellow core and dark brown shell of layered
texture. 78
Figure 5.9: Positive TOF-SIMS spectra from (a) the core and (b) shell of stone S6. 78
Figure 5.10. Positive ion mass spectrum of reference calcium oxalate. 80
Figure 5.11. The change in the relative intensity of indicated species from the reference calcium oxalate
chemical. 81
Figure 5.12. The relation of Ca+2/Ca+ observed for (a) Na+/Ca+, (b) CaPO2+/Ca+ observed for urinary stone samples (S1-S9), and average of all samples. Primary ion dose dependent (c) Ca+2/Ca+ for single
sample (S5). 82
Figure 6.1. The re-examined [29] negative ion TOF-SIMS mass spectra of (a) reference monetite (CaHPO4, dehydrated brushite) and (b) stone (S10) reported in reference [26]. 85
Figure 6.2. The re-examined [29] positive ion TOF-SIMS mass spectrum of (a) reference monetite
(CaHPO4) and (b) stone (S10) reported in reference [26]. 86
Figure 6.3. The morphological appearance of apatite stone (S11), two different views of same stone. 87
Figure 6.4. Negative TOF-SIMS spectra of (a) reference hydroxyapatite (HAP) and of (b) renal stone
(S11). 87
Figure 6.5. Positive TOF-SIMS spectra of (a) reference HAP and of (b) renal stone (S11) 88
Figure 6.6. Positive (a) and negative ions (b) TOF-SIMS spectra of reference TCP Ca3(PO4)2. 90
Figure 6.7. Secondary ion peak ratios of PO+/POH+ and CaPO2+/Ca2O+ measured for four calcium phosphate references versus their stoichiometric PO4/Ca ratio. 93
Figure 6.8. Secondary ion peak ratios of PO+/POH+ and CaPO2 +
/Ca2O +
measured for binary mixture of COX with DB [(a) and (b)] and HAP [(c) and (d)] versus their percentage in total mass. The pair of peaks ratios is also plotted for the real human calculi S1–S10, S12-S15 indicating by open circles, for renal stones cross reference with Ghumman et al. [29] look at Table 2. 94
Figure 6.9. Positive TOF-SIMS spectrum of reference binary mixture of COX (25%) and HAP (75%). 95
Figure 6.10. The relative ion yield of doubly charged ion (Ca+2) for different synthetic calcium
phosphates. 96
Figure 7.1: The visual appearance of struvite stones (STRU1). 99
Figure 7.2. Negative TOF-SIMS spectra of reference struvite (a) and of renal stone (STRU1) (b) shown in
Figure 7.1. 100
Figure7.3: Positive TOF-SIMS spectra of reference struvite (a) and of renal stone (STRU1) (b) shown in
xii
Figure 7.4. Negative ion spectra of STRU2a (a) and STRU2b (b) 102
Figure 7.5. Positive ion spectra of STRU2a (a) and STRU2b (re-analyzed) (b)[26]. 103
Figure 7.6: continuation of Figure 7.5b. 103
Figure 7.7: stone STRU3 showing layers of struvite (white slab) with calcium phosphate (brown)
developed on it top. 104
Figure 7.8: The positive ions spectra from the stone STRU3 corresponding to (a) white and (b) brown
parts. 105
Figure 7.9: The positive SIMS spectra of (a) struvite (50%) and calcium oxalate (50%), and (b)
struvite(50%) and monetite (dehydrated brushite) (50%). 107
Figure 7.10: the ratios of PO+/POH+ as function of calcium phosphate in struvite stones and that of
reference struvite. 111
Figure 7.11. The relative abundance found for Na+ (left) and K+(right) in real stones at respective concentrations of calcium phosphate and struvite components. 112
Figure 7.12. Calcium spatial distribution (a), magnesium distribution (b), Na+(%) distribution (c), and
K+(%) distribution (d). 113
Figure 7.13: Relative intensities of % Na+ (a), and % K+ (b) observed at respective calcium concentration
in the images shown in Figure 7.12. 114
Figure 8.1a. The mass spectra of uric acid, uric acid containing glycerol, and cystine stones (top to
bottom in respective order). 117
Figure 8.1b. The mass spectra of calcium oxalate, hydroxyapatite (containing 15% struvite), and struvite
stones (from bottom to top in respective order) 117
Figure 9.1. The constructive SIMS (C-SIMS) spectrum generated by multiplying the intensity of each peak in the mass spectrum shown in Figure 9.2 with respective constructive factor Fx.. 121
Figure 9.2. TOF-SIMS spectrum from glycerol sample acquired using Ga+ as primary ions with impact
energy of 9 keV and data acquisition time of 5 minutes. 122
Figure 9.3. Follow-up TOF-SIMS spectrum from glycerol sample acquired using Ga+ as primary ions with impact energy of 9 keV and data acquisition time of 5 minutes. 122
Figure 9.4. Ratio of positive ion intensities from spectra shown above acquired form glycerol on Al
substrate with impact energy of 9 keV Ga+. 122
List of Tables
Table 3.1. A brief resume of the upgraded data acquisition and control system. 37
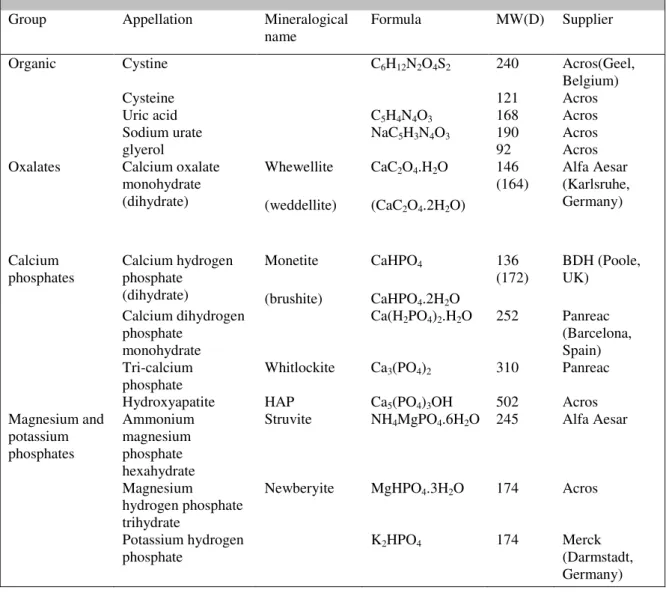
Table 3.2. List of the commercial kidney stone minerals used as reference samples in this work. 46
Table 4.1. Experimental conditions and classification of organic stones analyzed 51
Table 4.2. The intensity ratios of the characteristic ion peaks of cysteine, cystine, human stone [28], and
dog stone. 64
Table 5.1. Experimental conditions and classification of stones identified as calcium oxalate 70
Table 5.2. Positive secondary ions measured for urinary stones (S1-S5). 79
Table 5.3. Positive secondary ions measured for urinary stones (S1-S5), the average intensity of all nine samples (S1-S9), and calcium oxalate monohydrate (COX) reference chemical. 80
Table 5.4. Ionization energy of few elements [National Physical Laboratory web site]. 81
Table 6.1. Experimental conditions and classification of stones identified as calcium phosphates. 84
Table 6.2: Positive secondary ions measured for calcium oxalate monohydrate (COX), hydroxyapatite (HAP), tri-calcium phosphate (TCP), dehydrated brushite (DB) and calcium di-hydrogen phosphate
monohydrate (CDHP) reference chemicals. 91
Table 6.3. Names assigned to urinary stones in present work and reference [29]. 94
Table 7.1. Experimental conditions and classification of stones identified as struvite. 98
Table 7.2: relative abundance (%) of phosphate ions for reference chemicals and real stone samples. 100
Table 7.3: Relative peak intensities of calcium phosphates (TCP and HAP) and their compositional
contents in struvite stones. 108
Table 7.4. Relative sensitivity factors (RSF) of Ca+ and Ca+2 relative to Mg+ for produced mixtures of
known composition. 110
xiv
List of abbreviations
CaP Calcium phosphate
CDHP Calcium di-hydrogen phosphate monohydrate
COX Calcium oxalate
C-SIMS Constructive SIMS
DB Dehydrated brushite (monetite)
DLL Dynamic link library
ESA Electrostatic analyzer
G-SIMS Gentle SIMS
HAP Hydroxyapatite
LMIS Liquid metal ion source
S-SIMS Static secondary ion mass spectrometry
TCP Tri-calcium phosphate
TDC Time to digital convertor
TOF-SIMS Time-of-flight secondary ion mass spectrometry
UHV ultra-high vacuum
Publications
Published work included in Thesis
1. C.A.A. Ghumman, A.M.C. Moutinho, A. Santos, A. Tolstogouzov, O.M.N.D. Teodoro; TOF-SIMS VG Ionex IX23LS: upgrade and application for the urinary stones analysis. Surf. Interface Anal., 2013, 45, 532.
2. C.A.A. Ghumman, A.M.C. Moutinho, A. Santos, O.M.N.D. Teodoro, A. Tolstogouzov. An upgraded TOF-SIMS VG Ionex IX23LS: study on the negative secondary ion emission of III-V compound
semiconductors with prior neutral cesium deposition. Applied Surface Science 2012, 258, 2490. 3. C.A.A. Ghumman, A.M.C. Moutinho, A. Santos, A. Tolstogouzov, O.M.N.D. Teodoro; TOF-SIMS
study of cystine and cholesterol stones. J. Mass. Spectrom. 2012, 47, 547.
4. C.A.A. Ghumman, A.M.C. Moutinho, A. Tolstogouzov, O.M.N.D. Teodoro. Time-of-flight secondary ion mass spectrometric identification of calciumformate Ca(HCO2)2 andmetabolite of vitamin B6 in human stones. Rapid Commun. Mass Spectrom. 2011, 25, 997.
5. C.A.A. Ghumman, O.M. T. Carreira, A.M. C.Moutinho, A. Tolstogouzov, V. Vassilenko, O.M.N.D. Teodoro. Identification of human calculi with time-of-flight secondary ion mass spectrometry. Rapid
Commun. Mass Spectrom. 2010, 24, 185.
Other relevant published work
6. M.B. Gawande, P.S. Branco, I.D. Nogueira, C.A.A. Ghumman, N. Bundaleski, A. Santos, O.M.N.D. Teodoro, R. Luque. Catalytic applications of a versatile magnetically separable FeMo nanocatalyst.
Green Chem. 2013, DOI: 10.1039/C3GC36844K
7. M.B. Gawande, A.K. Rathi, P.S. Branco, A. Tolstogouzov, C.A.A. Ghumman, O.M.N.D. Teodoro, A. Velhinho. Nano-MgO-ZrO2 Mixed Metal oxides: Characterization by SIMS and application in the reduction of carbonyl compounds and in multicomponent reactions. RSC Advances 2013. DOI:10.1039/C2RA22511E
8. M.A. Neto, E.L. Silva, C.A. Ghumman, O.M. Teodoro, A.J.S. Fernandes, F.J. Oliveira, R.F. Silva. Composition profiles and adhesion evaluation of conductive diamond coatings on dielectric ceramics.
Thin Solid Films 2012, 520, 5260.
9. M.B. Gawande, A. Velhinho, I.D. Nogueira, C.A.A. Ghumman, O.M.N.D.Teodoro, P.S. Branco. facile synthesis of cysteine-ferrite magnetic nanoparticles for application in multicomponent reactions -
A sustainable protocol. Royal Society of Chemistry, 2012, 2, 6144
10. M.B. Gawande, A. Rathi, I.D. Nogueira, C.A.A. Ghumman, N. Bundaleski, O.M.N.D. Teodoro, P. S. Branco. A Reusable and Recyclable Ferrite-Co Magnetic Nanocatalyst for Oxidation of Alcohols to
xvi
11. M.B. Gawande, A.K. Rathi, P.S. Branco,I. D. Nogueira, A. Velhinho, J.J. Shrikhande, U.U. Indulkar,
R.V. Jayaram. C.A.A. Ghumman, N. Bundaleski, O.M.N.D. Teodoro; Regio- and Chemoselective Reduction of Nitroarenes and Carbonyl Compounds over Recyclable Magnetic Ferrite_Nickel
Nanoparticles (Fe3O4-Ni) by Using Glycerol as a Hydrogen Source, Chem. Eur. J. 2012, 18, 12628 12. M.B. Gawande, P.S. Branco, K. Parghi, J. J. Shrikhande, R. K. Pandey, C.A.A. Ghumman, N.
Bundaleski, O. M. N. D. Teodoro, R. V. Jayaram. Synthesis and characterization of versatile MgO– ZrO2 mixed metal oxide nanoparticles and their applications. Catal. Sci. Technol., 2011, 1, 1653. 13. R. Said, C.A.A. Ghumman, O.M.N.D. Teodoro, W. Ahmed, A. Abuazza, and J. Gracio ; Effects of
Bias Voltage on Diamond Like Carbon Coatings Deposited Using Titanium Isopropoxide (TIPOT) and
Acetylene/Argon Mixtures onto Various Substrate Materials. J. Nanosci. Nanotechnol. 2010, 10, 2552. 14. R. Said, N. Ali, C.A.A. Ghumman, O.M.N.D. Teodoro, and W. Ahmed; Characterisation of DLC Films Deposited Using Titanium Isopropoxide (TIPOT) at Different Flow Rates. J. Nanosci.
Nanotechnol. 2009, 9, 4298.
15. V.F. Neto, R. Vaz, N. Ali, M.S.A. Oliveira, J. Grácio, C.A.A. Ghumman and O.M.N.D. Teodoro. Carbon diffusion into steel during diamond chemical vapour deposition. Int. J. Nanomanufacturing.
2008, 2/ 3, 192.
16. V.F. Neto, R. Vaz, T. Shokuhfar, C.A.A. Ghumman, O.M.N.D. Teodoro, N. Ali, M.S.A. Oliveira, J. Grácio, Diffusion of critical elements in steel during thermal treatments in a diamond chemical vapour
1. INTRODUCTION
Since its early days SIMS (Secondary Ion Mass Spectrometry) has been extensively used
for material characterization. Applications of SIMS have included the study of metals and
semiconductors and, more recently, of oxides and other nonconductive samples. The potential of
SIMS for the study of biological samples is now being explored. The advent of time-of-flight
SIMS (TOF-SIMS) has brought increased power to the technique with a virtually unlimited mass
range, high mass resolution and the advantage of the low dose of primary ions needed to obtain
spectra from quasi-non destructive surface. Therefore, TOF-SIMS is now being used not only to
provide elemental (including isotopic) and molecular composition in a range of industrial
materials, but also for the characterization of an increased number of biomaterials. For instance, it
was used for biological structure investigations [1, 2] and the study of the distribution of inorganic
elements in the cells such as calcium, magnesium and boron [3]. Recently, we employed
TOF-SIMS for the characterization of MgO–ZrO2 mixed metal oxide nanoparticles [4] catalysts and the
catalysts supported on Fe3O4 [5-7].
Secondary ion mass spectrometers developed in the mid-80s still remain the right tools
for applied and fundamental research because of the quality of vacuum and analytical parts.
However, these machines are equipped with old-fashioned electronics and in many cases, lost the
operational technical support because the manufacturing companies moved to the newest
productions or were closed down. We will briefly discuss the modernization and upgrading of
data acquisition and control system of a TOF-SIMS VG Ionex IX23LS (Burgess Hill, UK) [8]
making this instrument suitable for qualitative and quantitative analyses of real urinary stones.
1.1 Urinary calculi
The generation of solid stones inside the kidney (nephrolithiasis) and the ureter
PhD Thesis 2
due to the breakdown of a delicate balance in the body. Renal stones are common in western
industrialized countries, whereas bladder ones are rather occasional. Worldwide, about 10% of the
population is affected by this pathology at some stage of their life with the maximum incidence
occurring between the ages of 20 and 40 [9].
The prevalence and incidence of nephrolithiasis are reported to be increasing across the
world. These increases were seen across sex, race and age [9]. The pathogenesis is still unclear. It
may be due to aspects of dietary intake, including the quality of drinking water. It may also be due
to an inherent metabolic disorder of the patient, such as association of cystine stones with
cystinuria. Nephrolithiasis is one of the most painful illnesses, because of the mechanical
irritation of the stones on the urinary tract tissues. Severity of pain depends upon the size and
surface roughness of the stone and varies from patient to patient. The ureteral stone passage study
[10] shows that patients with ureteral stones <10mm undergo spontaneous stone passage (with or
without medical therapy) while most of the patients with stones >10mm require surgical removal
of the stones followed by preventive treatment against recurrence. The selection of treatment to
prevent recurrence, which is about 50% [11], depends upon the chemical composition of patient’s
stone [12].
The chemical composition of urinary calculi is quite different; these can be composed of a
variety of organic and/or inorganic substances. The main groups of urinary stone components
include:
Inorganic crystalline substances: calcium oxalates, calcium phosphates and magnesium
ammonium phosphates.
Organic crystalline substances: uric acid, urates and purine derivatives.
Cystine and arginine.
Organic non crystalline substances: protein, matrix stones, blood coagulum.
Artifacts, falsifications.
A majority of kidney stones are calcium stones, with calcium oxalate and calcium
phosphate accounting for approximately 80% of all kidney stones, about 10-15% are Struvite
stones, occurrence rate of uric acid is about 5-10%, cystine is not that frequent with less than 1%,
but it is important because of the high recurrence rate without metaphylaxis (measures to
minimize or eliminate an expected occurrence) and rest are other components [13].
The management of stones found in humans requires a combined clinical and surgical
approach. In general, severe obstruction, infections, intractable pain and serious bleeding are
of the formation of urinary stones, attempting to identify promoting and inhibiting factors in their
growth. However, extensive interdisciplinary studies are required in order to correlate the calculi
composition with the pathophysiology of illness. A better understanding of the physiochemical
principles underlying the formation, promotion and inhibition of calculi needs more accurate
information on their chemical content. Imprecise chemical analysis can lead to wrong planning of
their treatment and of ways to stop their reoccurrence.
The compositional analysis of urinary stones is an important requirement for a successful
management of the disease, which implies not only a proper evaluation and treatment, but also
prophylaxis to prevent recurrence, which is impossible without knowing the composition of the
urinary stones involved.
1.2 Current analytical approaches
Currently, several chemical and physical techniques are available for the investigation
and routine analysis of urinary stones. These techniques include: wet/dry chemical methods[14]
although obsolete but still practiced, Fourier transform infrared spectroscopy but it may produce
complex spectra resulting from the interference of known biomaterial with unknown substances
[15,16, 17] common in such complex natural samples, X-ray diffraction but it is unsuitable for the
analysis of amorphous substances such as carbonate apatite [18 ,19], scanning electron
microscopy [18] but the material in urinary calculi is also prone to irradiation damage during
electron microscopy , laser induced plasma spectroscopy [20], X-ray photoelectron spectroscopy
[21], thermal decomposition suited for a few types of kidney calculi such as Struvite [22], X-ray
absorption near-edge spectroscopy with synchrotron radiation [23] and micro-computed
tomography [24,25]. However, only Fourier transform infrared spectroscopy and X-ray
diffraction are the methods recommended by the European Association of Urology (2011),
although, these techniques have also some limitations, which are beyond the scope of the present
study.
1.3 Thesis overview
In this work we have used time-of-flight secondary ion mass spectrometry (TOF-SIMS)
for the analysis of urinary stones as it is a well-established and widely applied surface analytical
PhD Thesis 4
Although TOF-SIMS is an acknowledged technique for biomaterial investigations, to the
authors’ knowledge there has been no report on its use for the investigation of human calculi
(except authors´ own recently reported work [26-29]). The aim of this work is to demonstrate the
applicability of TOF-SIMS for the identification of various inorganic and organic species in
human calculi. The simple sample preparation procedure combined with the capability of
detecting [M+H]+ or [M–H]- ions (in the case of organic calculi) and fragment ions (in the case of inorganic stones) makes TOF-SIMS suitable not only for routine analysis, but also for the
identification of trace elements, and imaging of such samples. Let us briefly describe chapter wise
the scheme of this comprehensive study.
In the following chapter (2) we will briefly describe the fundamentals of secondary ion
mass spectrometry; sputtering of organic and inorganic materials, ionization of sputtered materials
based on the ionization models. And finally different modes of SIMS analysis and some usefully
methodologies to characterize the sample from the SIMS measurements e.g. constructive-SIMS
(C-SIMS), a new methodology proposed in this work for molecular structure revelation.
In chapter 3, we will discuss the working principle of TOF-SIMS; mass analyzer, ion
sources. The instrumental description will also be presented including the upgrade of the
TOF-SIMS instrument made in the framework of the present study, especially the data acquisition and
control system designed and developed. New ion source tungsten tip wetting (with liquid metal)
methodology under ambient conditions will be presented. Finally, the presently used sample
preparation techniques will be discussed, especially from the powder samples. We will propose a
new sample preparation method for the non-conducting powders which is always considered to be
a challenging task to produce good SIMS results. The sample prepared by the proposed technique
gives very good molecular ion yield even without any charge compensation.
In chapter 4, the analysis of organic calculi (uric acid, sodium/potassium urates, cystine
and cholesterol) will be presented [26-28]. The results will be compared with that of reference
chemicals for the classification. The classified stones will be further compared within same class
for different individuals. In this study we clearly identified uric acid, and cystine form their
protonated [M+ H]+ and deprotonated [M-H]- molecules. The organic salts like sodium urate were identified by the more intense sodiated uric acid peaks as compared to protonated uric acid.
Cholesterol stone was recognized through its most abundant ion peak at m/z 269 [M-OH]+. The absence or presence of any additional components was also identified, e.g. metabolite of vitamin
B6 was identified in urate stone [27].
In chapter 5, the results of calcium oxalate stones will be presented, we clearly identified
formate (CaH2C2O4) in one of the calcium oxalate stone [27]. The results of stones identified as
core & shell as uric acid & calcium oxalate respectively and vice versa in stones of two
individuals will be presented. Finally, in this chapter we will present the overall difference
observed in the stones data by comparing with that of reference chemical resulting identification
of calcium phosphate in all stones (100%) classified as calcium oxalate, although in some of them
calcium phosphate was less than 10%.
In chapter 6, the new method of phase identification for calcium phosphates will be
presented. Only a limited number of authors have reported analysis of these important biological
materials using SIMS as complimentary technique. But according to our knowledge, there are no
publications on the SIMS quantification of these components, especially calcium phosphates and
calcium oxalate forming approximately 80% of real human stones [13]. To correlate the chemical
nature of the stones with appropriate medical diagnoses, the phase identification and
quantification of calcium phosphates in calcium oxalate are of a great importance for clinical
investigations because calcium phosphate contents could be a useful factor for the prediction of
recurrence [30]. The quantification makes possible to classify the stones by knowing the relative
contents, which is regarded as an important factor in general practice, especially in shock wave
lithotripsy treatments [31].
In the TOF-SIMS studies [32-35] of calcium phosphates, Chusuei et al. [34] and Lu et al.
[35] used polyatomic and monatomic primary ions for the phase identifications, the relative
intensities of molecular secondary ions PO2
and PO3
were used. However, the values of PO3
-/PO2- ratio for five out of six calcium phosphates were so close in pairs that they might be
indistinguishable in real samples. In our study [29] using Ga+ as primary ions, we demonstrated clear phase identification both for pure calcium phosphates and in their mixture with calcium
oxalate via proper selection of the characteristic positive secondary ions.
In chapter 7, the TOF-SIMS results of struvite stones will be presented which will be
compared with reference chemicals and with other stones classified as struvite. Again it might be
interesting to state that no TOF-SIMS study on struvite urinary stones, geological samples, or
standard samples was found (except the part of present study [26]). In our study we clearly
identified the pure struvite stones, mixed with calcium phosphates, and urates. The only calcium
phosphates we found in these stones were tri-calcium phosphate and hydroxylapatite. It might be
interesting to state here that in this work we revealed that it is possible to recognize calcium
oxalate from calcium phosphates present in struvite stones. We did not found calcium oxalate in
PhD Thesis 6
components was also revealed statistically in 13 struvite stones which we have also confirmed in
a single sample with micro-analysis TOF-SIMS chemical image mode.
In chapter 8, we will briefly summarize the results of total 38 stones including two dog
stones identified as struvite and cystine. We will also present our compositional statistical analysis
to estimate the occurrence frequency of different urinary components from the stone formers in
2. SECONDARY ION MASS SPECTROMETRY
Secondary Ion Mass Spectrometry (SIMS) is the mass spectrometry of secondary ions
which are produced when a surface is bombarded by energetic primary projectiles, typically ions
for example, Aun +
, Arn +
, Bin +
, Cs+, C60 +
, Ga+, O2 +
, O+, and O- etc. where n represents for number of atoms. The sputtered secondary particles are electrons; neutral species of atoms or molecules;
elemental, molecular and cluster ions. The vast majority of species emitted are neutral (~ 99 %)
but it is the secondary ions accounting for ca. 1% of sputtered species that are detected and
analyzed by a mass spectrometer. The resulting mass spectrum gives detailed chemical
composition of the subject material.
Time-of flight SIMS (TOF-SIMS) is a leading experimental choice of static SIMS that
emerged as a technique of potential importance in surface science as a result of the work of
Benninghoven and his coworkers in Münster in the late 1960s. The working principle is very
simple and is shown in Figure 2.1. When an energetic (1-30 keV) beam of ions bombards a
surface, the particle energy is transferred to the atoms or molecules of the surface at impact site. A
cascade of collision occurs between the atoms and molecules in the target material: some
collisions return to the surface and result in the emission of atoms, atomic clusters, molecules and
molecular clusters; some of which are ionized in the course of leaving the surface.
While the technique is apparently destructive, the essence of the static mode is to use an
extremely low dose of primary ions (< 1013 ions cm-2), such that the top surface layer of atoms or molecules do not receive more than one ion impact within the time scale of the experiment. The
spectral information arising in static mode is of representative of surface chemistry and can be
exploited in many fields of applications. In addition to static SIMS mode, TOF-SIMS is now
routinely used in imaging and depth profile modes. The mass spectrum is the essential part of all
modes of operation. To interpret the SIMS results one should consider secondary ion yield, which
depends on sputtering and ionization of sputtered material. Let us discuss these parameters
Figure 2.1. Schematic diagram of the SIMS principle.
2.1 SECONDARY ION YIELD
Sputtering and ionization are the basic processes in surface analysis by SIMS. More
extensive details concerning the sputtering and secondary ion emission can be found elsewhere
[36 and references therein]. SIMS is concerned with the analysis of secondary ions. Ionization
occurs at, or close to, the emission of particles from the surface with the consequence that the
matrix participates in the electronics processes involved. This means that the yield of secondary
ions is strongly influenced by the electronic state of the material being analyzed consequently
complicates the quantitative analysis. The signal intensity of particular species is governed by the
basic secondary ion yield equation (2.1) as follows;
Im+ = IpYmα+Cmη (2.1)
Where Im is secondary ion intensity of species m, Ip is the primary particle flux, Ym is the
2.1.1 Sputtering of inorganic materials
Sputtering of a target by energetic ions or recoil atoms is greatly reviewed by P. Sigmund
[36, 37] based on the cascades of atomic collisions. The parameter characterizing the sputtering
process is sputtering yield (Y), which is defined as the ratio of the average number of the ejected
to the number of bombarded particles. The parameter Ym in Equation (2.1) is the sputtering yield
and α+
.Ym is the average number of positive ionic particles of species m, per primary ion impact. It
also increases with primary particle mass, charge, and energy, although not linearly. Figure 2.2
shows the energy dependence of sputtering yields of Ni by a variety of ions at normal incidence
[38]. The target structure (crystallinity, texture), surface topography, beam-induced changes in
both structure and topography, target temperature, and incident angle affect the yield. The
threshold is not at the surface binding energy U (~3eV) but at a substantially higher energy.
Typical threshold of the sputtering occurs at about 15–40 eV primary particle energy [39, 40] and
yield tends to maximize with energy up to 50 keV. For lighter primary particles the maximum is
reached at ca. 1 kev. Beyond this energy, yield drops away as the primary particles penetrates
deeper into the solid and less energy returns to surface region.
2.1.2 Sputtering of organic materials
Sputtering is damaging process; consequently it is more difficult to measure sputtering
rates for the organic materials. The sputtering yield of elemental carbon and nitrogen can be
measured, but in static SIMS we are more interested in using the technique to detect and measure
the chemical structure. In sputtering of organic materials; atoms, structural fragments and
molecules are removed from the surface resulting destruction of chemical structure within area
from which these species are removed. In molecular materials, every impacted molecule will be
significantly destroyed, whether complete molecule or small fragment of the molecule is
removed. In polymer materials, the impacted monomer unit will be destroyed. Thus instead of
sputter rate the concept of damage cross-section, Ϭ, has found to be useful. The loss of
structurally important species from the SIMS spectrum as a function of accumulative
bombardment dosage in time ´t´ is taken to be measure of increasing damage. Obviously the
greater the damage cross section lesser will be the molecular ion yield. The relation between the
secondary ion intensity (Im) of specie m and damage cross section ´Ϭ´ is as follows [36];
Im= Ymexp(-ϬIp) (2.2)
W. Sicthermann and A. Benninghoven measured damage cross-sections of around 10-14 cm2 (or 1 nm2) from amino acid and other small molecules on the metal surface [41]. For elemental sputtering, secondary ion yields and damage cross sections for organic materials
increases with primary ion mass, energy and increasing angle of incidence away from the normal.
In recent years with the development of argon gas cluster ion sources at Kyoto University [42]
molecular ion yield boost up compared to other polyatomic and cluster ion sources [43]. The
enhancement in the molecular ion yield increase with increasing cluster size at same energy due
to more gentle impacts on the surface resulting low damaging.
2.1.3 Ionization
2.1.3.1 Ionization of inorganic materials
Ionization of sputtered secondary particles is strongly influenced by the electron
exchange processes between departing species and the originating surface. Thus the electronic
can vary by several orders of magnitude across the periodic table, and strongly depends on the
chemical state of the surface that is called matrix effect i.e. the strong dependence of the
secondary ion yields on the analysis conditions and on the characteristics of the target.
Matrix effect plays an important role in SIMS quantitative analysis. The inconsistency of
ion yields is the major problem as the surface composition changes. The same species will not
have same secondary ion yield in different chemical environment, making direct comparison
difficult among samples. The environment of a single sample can change during the analysis. As a
result, differential removal of particles from the specimen can occur due to preferential sputtering
[39]. Moreover, the probability of ion formation can vary as a result of change in the sputtering
process due to ion beam damage and implantation of bombarding species as shown in Figure 2.3.
Figure 2.3: The relative normalized ion yield of Ca+, Ca+2 and Mg+ from the sample with Ca/Mg atomic ratio of 2.373 under Ga+ bombardment. Due to surface modification the ion yield of singly charged calcium (Ca+) increased while magnesium(Mg+) decreased, the decrease similar to magnesium was observed for doubly charged calcium (Ca+2) [from the present work].
These variations in the ion yield are due to surface modification that can be explained on the basis
of well known [36] modifications of electronic state of the surface by oxidation and cesiation
commonly used for enhancement of positive and negative secondary ions respectively. Oxidation
can be achieved by oxygen flooding on the surface or by bombardment with oxygen species (O-, O+, and O+2 etc) while cesiation can be achieved by bombardment with cesium ions or neutral Cs deposition of sub-monolayer coverage.
In order to understand these useful surface modification effects and hence interpret the
SIMS results, one has to consider some fundamental ionization models. Before we discuss the ion
2.1.3.2 Electron Tunneling Model
In the electron-tunneling model [45], the discrete electronic level of the sputtered atom
interacts with the continuum of electronic states of the solid. The central feature of this continuum
of electronic states is the Fermi level which separates occupied and unoccupied states. During the
removal of the particle, while it is still in the vicinity of the surface, the atomic levels of the
sputtered atom overlap with the electronic levels of the metal. The Fermi Level EFof the metal
can be higher or lower than the atomic level after the sputtered atom has reached a certain
distance RC from the surface, and therefore an exchange of an electron is energetically possible as
shown in Figure 2.4.
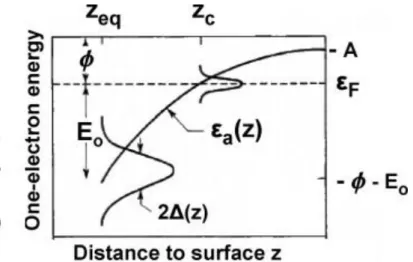
Figure 2.4. Energy-level diagram for an atom or molecule characterized by its highest occupied (image-potential-upshifted) valence level I and lowest unoccupied (downshifted) affinity level A interacting with a metal surface. The lowering of the affinity level allows a Fermi-level electron from the substrate to tunnel into the atom/molecule thus creating a negative ion. This possibility is turned on at a separation Zc where the shifted affinity level coincides with the Fermi level [46].
The direction of the charge transfer is depending on the values of the work function
Φ
ofthe metal and the ionization potential I (or the electron affinity A, respectively) of the sputtered
particle. A potential barrier between the electronic states inhibits the charge transfer, but tunneling
of the electron to/from the atom is possible with a probability that is exponentially dependent on
the distance where the energy levels become equal (determined by the work function
Φ
of themetal) and on the normal component of the velocity v⊥of the sputtered particle (determining the
time for interaction). The ionization probability for negative (P-) and positive (P+) ion formation can be described by following equations 2.3 and 2.4 for the tunneling of electron from the surface
and towards the surface, respectively.
P-∝ exp (-2∆(Zc)/ħ v⊥).exp(-(
Φ
-A
)/ Ɛn) (2.3)P+∝ exp (-2∆(Zc)/ħ v⊥).exp(-(I-
Φ
)/ Ɛp) (2.4) Where, ∆ (Zc) is a function describing the broadening of the atomic level at the distanceof the velocity at distance Zc; Ɛp, Ɛnare proportional to the normal component of the velocity, and
is a characteristic length parameter.
One way to make use of the exponential dependence of the ionization probability on the
work function of the surface is to lower the work function as much as possible to enable charge
transfer to the sputtered atom at low distances Zc. This increases the probability for negative ion
generation by several orders of magnitude. It can be obtained by covering the surface with a
sub-monolayer of alkali metals, e. g. from a Cs sputter ion gun performing used for SIMS analysis.
Figure 2.5. Variation of an atomic affinity level Ɛa with distance Z from a metal surface. Ɛa
crosses the Fermi level ƐF at Zc, and approaches the free atom affinity level –A. As the atom
moves away from the surface, the width Δ of the level decreases [46, 47].
From the equation (2.3) for P-, an exponential increase of the ionization probability with
Cs surface concentration is expected. The probability (P-)decreases when all sputtered atoms are
ionized or when the work function has reached its minimum value. For the emission of positive
ions (eq. 2.4), a low work function can be detrimental. If for example a positive ion is leaving the
surface, the first unoccupied atomic level can be lower than the Fermi level, making an electron
transfer from the surface to the ion possible, which re-neutralizes the emitted ion. This is
illustrated by the Cs+ intensity during Cs sputtering, which increases at low Cs coverage according to the increase in Cs concentration. As soon as the work function is lowered
significantly, the Cs+ intensity decreases again. At this stage, re-neutralization starts to suppress the increase by high concentration and therefore sputtered Cs atoms [48, 49]. Typically, this is the
case as soon as the work function is only about 0.5 eV higher than the ionization potential of Cs.
Whether or not the under Cs bombardment is depending on the sputter yield of the target material
at the given energy and angle of incidence, which determines the maximum Cs concentration and
hence the minimum work function decrease of the positive ionization probability is observed with
2.1.3.3 Bond Breaking Model
For oxides (and halides), which are present on almost all elemental targets or can be
formed by bombardment or chemisorption, the bond breaking model [50, 51] describes the
ionization as a consequence from the breakup of an ionic or covalent bond. An electropositive
atom leaving the surface is ionized by breaking its bond to another surface atom and leaving one
electron behind.
A very concise discussion of this model is given in the cited reference [52 and references
therein]. The practical result of this discussion is an expected exponential decrease of the
ionization probability with increasing ionization potential ‘I’. Electropositive elements in an oxide or halide environment will effectively be ionized by breaking the surface bonds, which is utilized
when a surface is bombarded or flooded with oxygen to incorporate it into the altered layer. Thus
the ionization probability for electropositive species is increased by up to three orders of
magnitude [45]. Oxygen bombardment and/or oxygen flooding is extensively used for all kinds of
materials. The sputter yield also depends on the degree of oxidation [53] resulting in a further
influence on the ion yield.
2.1.3.4 Recombination Model
In contrast to the two models described above, the recombination model is specifically
valid for cluster ions of matrix species with one or two Cs atoms originating from the sputter
beam or presence of alkali metals in the target surface. Basically, the model assumes the emission
of Cs+ ions together with sputtered neutrals M that (re)combine above the surface to form MCs+ or MCs2
+
cluster ions.
Although the strong emission of these clusters has been known longer [54], their
importance for some application like detection of rare gases [55] and the quantification of matrix
compounds [56, 57] was recognized only in early 1990s.
As already mentioned in electron tunneling model, a surface covered with a
submonolayer of Cs emits Cs+ ions with a very high degree of ionization. This high degree of ionization is virtually independent of the matrix, since the work function is mainly defined by the
Cs over-layer itself. Only if the Cs concentration becomes very high, the degree of ionization is
reduced and becomes dependent on the surface concentration.
The composition of the flux of sputtered particles from the target is representative of the
The yield of cluster ions formed by combining Cs+ ions with sputtered neutrals should therefore be independent of the chemical state of the surface.
YMCs +
∝YCs +
.Ytotal.CM. fMCs (2.5)
If at all, only a weak matrix effect is observed. Apart from fMCs(the formation probability
for the cluster ion), all factors in eq. (2.5) are constant and rather well understood. For
quantification purposes, the formation probability is assumed to be constant, and the yield YMCs +
divided by the Cs+ intensity should be directly proportional to the concentration CMof M.
2.1.3.5 Ionization of organic materials
Secondary ion formation from the organic materials can occur by a number of
mechanisms. Loss or gain of an electron to form an odd electron molecular radical ions M+ or M-, polar molecules may undergo acid base reaction to form protonated [M+H]+ or deprotonated [M-H]± molecules; cationization or anionization of neutral molecules may occur. These processes are mainly relevant to molecular species, low mass fragments also provide important information for
chemical structure determination, e.g. the molecules with OH terminals gives [M-OH]+ signals rather higher than protonated/deprotonated molecules. Ionization of these species probably occurs
via collision cascade mechanism due to direct interaction with primary ion or energetic recoil
atoms within the material. The exact location of these ionization processes is still mystery, but
likely in the emission region within or just above the surface. Matrix effects (surface coverage,
substrate) do influence secondary ion yields from organic materials, but they are generally not so
marked as from inorganic systems. Ion yields from copolymers have been observed to be
sensitive to identity of the components. Clearly cationization will be favored when suitable
cations (Ag, Na, K, and Cs etc) are present in the matrix. We will briefly discuss different types
of ions formation from the organic and inorganic materials; details can be found elsewhere [36].
2.1.3.6 Formation of protonated and deprotonated ions ([M+H]
+, [M-H]
-)
The analyte molecule mass m can be directly derived from the protonated and
deprotonated molecule observed. The formation of these molecular ions molecules strongly
depends on structure of the analyte. The emission [M+H]+ is often surface coverage dependent.
The protonated molecules are formed if analyte molecule contains basic groups. For
peptide (polymers of amino acids), for example, the signal intensity of [M+H]+ is most intense if they contains basic side chains (-NH2). No protonated molecules are formed if peptide does not
contain any basic side chain and additionally its N-terminus is blocked. In a few cases, the
glycerol-monostearate. An intermolecular proton transfer is supposed to be responsible for this
behavior, although a detailed understanding of the underlying mechanism is still unclear.
Deprotonated molecules can be produced if the analyte molecular structure contains
acidic groups (-COOH). All fatty acids show [M-H]- emission. In contrast to the [M+H]+, the formation of deprotonated ions is layer independent. However, it is influenced by the substrate
properties. Sometimes it has been observed as decomposition of Ag+(M-H)- complexes or by intermolecular proton transfer between adjacent molecules.
As the influence of chemical environment on the [M+H]+ and [M-H]- emission is strong, it is always worthwhile to tailor the substrate properties specifically in order to promote the
respective ion formation. Gusev et al. for example, reported on the enhanced [M+H]+ emission of peptide from HBr treated surfaces [see reference therein 36].
2.1.3.7 Formation M
+, M
-, and by loss of small functional groups
These ionization pathways are distinctively influenced by the chemical structure of the
analyte molecule and, generally, are only seldom observed in SIMS experiments. However, they
can be the only pathway in thick layers.
The formation of M+ and M- occurs mainly out of pre-formed states, for example if the molecule contains N+ centers or from pre-charged dyes. The ion like [M-CH3]
-, [M-OH]+ are observed by the loss of functional groups if such groups can easily be cleaved. For example,
glycerol and cholesterol forms [M-OH]+ ions by elimination of hydroxyl (OH) group, and signals of these peaks are intense that other molecular ions in neighboring m/z range.
2.1.3.8 Cationization by Alkali metals [M+alkali]
+If the surface of analyte molecules is bombarded with ion beam of Cs+ or if alkali metals like Li, Na, K, or Cs are present in the vicinity of analyte molecules under ion beam
bombardment, [M+alkali]+ are formed by attachment of molecule with these alkali ions, we observed such ion for uric acid sample as shown in Figure 2.6. The formation of alkali attached
ions is also dependent on the chemical structure of the analyte molecule. It can be observed if
analyte molecule contains basic groups or free electron pairs. In contrast to the [M+H]+ formation, which is also correlated with the existence of basic groups, the [M+alkali]+ formation normally do not depend on the coverage of the organic material on the metal support.
Most of the materials which show cationization with alkali metals can also be
Figure 2.6. Positive TOF-SIMS spectra from the uric acid sample. Neutral Cs was deposited prior to analysis [from author´s own work].
2.2 Characterization of samples from the SIMS measurements
The fundamental unit of information of SIMS is the mass spectrum; material can be
characterized directly from the experimental spectrum by assigning the observed peaks to analyte
component or after some treatment on the experimental data to achieve better level of
presentation.
2.2.1 S-SIMS
The mass spectrum from the inorganic samples resulting fewer peaks, are characterized
by the presence of their elemental peaks as well as from the few polyatomic peaks resulting in the
combination of different species present in the molecular formula of the analyte surface. In case
of unknowns, libraries search is useful to compare with known compositional spectrum. In
contrast in organic samples immense number of peaks arise in S-SIMS spectrum which is due to
the formation of different kind of heavy ions comparable to mass of the analyte molecules as
discussed before so called molecular ion peaks. These ions give direct identification of molecular
species present in the surface, beside these main peaks some peaks are the direct fragment of the
analyte molecule and in majority are those peaks arise due to the rearrangement of different
fragments sputtered and surface degradation. The relative intensity of the molecular ion peaks and
direct fragments highly depends on the many parameters already discussed e.g. primary ion mass,
and energy etc. resulting from different plasma temperature at impact site. Based on this physical
fact I.S. Gilmore and M.P. Seah proposed a method to extrapolate the mass spectral intensities at
low plasma temperature called gentle SIMS (G-SIMS) intensities. This procedure makes the mass
300 320 340 360 380 400 420 440
0 20 40 60 80 100 120 140
![Figure 2.6. Positive TOF-SIMS spectra from the uric acid sample. Neutral Cs was deposited prior to analysis [from author´s own work]](https://thumb-eu.123doks.com/thumbv2/123dok_br/16540222.736689/35.892.145.782.136.402/figure-positive-spectra-sample-neutral-deposited-analysis-author.webp)
![Figure 2.8. Static SIMS spectrum from Fe 3 O 4 -cysteine used catalyst acquired at Ga + impact energy of 5 keV [from the present work]](https://thumb-eu.123doks.com/thumbv2/123dok_br/16540222.736689/37.892.148.780.816.1098/figure-static-spectrum-cysteine-catalyst-acquired-impact-present.webp)
![Figure 2.10. Positive ion G 2 -SIMS of Fe 3 O 4 -cysteine spectrum, corresponding S-SIMS is shown in Figure 2.8 [part of present work]](https://thumb-eu.123doks.com/thumbv2/123dok_br/16540222.736689/38.892.123.756.629.893/figure-positive-sims-cysteine-spectrum-corresponding-figure-present.webp)
![Figure 3.3. Schematic diagram of gallium liquid metal ion source along with electrical connections (left) [69, 36], Ion source assembly of MIG 300PB ion gun (right)](https://thumb-eu.123doks.com/thumbv2/123dok_br/16540222.736689/49.892.152.781.601.979/figure-schematic-diagram-gallium-liquid-electrical-connections-assembly.webp)
![Figure 3.7. Schematic view of the upgraded TOF-SIMS VG Ionex IX23LS [8].](https://thumb-eu.123doks.com/thumbv2/123dok_br/16540222.736689/53.892.142.779.448.865/figure-schematic-view-upgraded-tof-sims-vg-ionex.webp)
![Figure 3.9. Schematic diagram of the newly developed data acquisition and control system [8]](https://thumb-eu.123doks.com/thumbv2/123dok_br/16540222.736689/56.892.118.752.435.703/figure-schematic-diagram-newly-developed-data-acquisition-control.webp)