Cláudia Sofia Vaz Crespo
Licenciada em Ciências de Engenharia do Ambiente
Optimization of the electrodialytic
phosphorus recovery from sewage
sludge ash
Dissertação para obtenção do Grau de Mestre em
Engenharia do Ambiente
Perfil de Engenharia Sanitária
Orientador: Professora Doutora Alexandra de Jesus
Branco Ribeiro, CENSE, DCEA, FCT-UNL
Co-orientador: Professora Doutora Lisbeth M. Ottosen,
BYG-DTU, Danmarks Tekniske Universitet
Júri:
Presidente: Professor Doutor António Manuel Fernandes
Rodrigues
Arguente: Mestre Paula Alexandra Rodrigues e Araújo
Guedes
Vogal: Professora Doutora Alexandra de Jesus Ribeiro
Branco
Optimization of the electrodialytical phosphorus recovery from sewage
sludge ash
Copyright © Cláudia Sofia Vaz Crespo, Faculdade de Ciências e Tecnologia,
Universidade Nova de Lisboa.
A Faculdade de Ciências e Tecnologia e a Universidade Nova de Lisboa têm o direito,
perpétuo e sem limites geográficos, de arquivar e publicar esta dissertação através de
exemplares impressos reproduzidos em papel ou de forma digital, ou por qualquer
outro meio conhecido ou que venha a ser inventado, e de a divulgar atraves de
repositôrios cientificos e de admitir a sua côpia e distnibuiçao com objectivos
educacionais ou de investigacao, não comerciais, desde que seja dado crédito ao
i
iii
Acknowledgements
The present work would not be possible without Erasmus+ mobility project, thus a big thank to
this programme. It is also impossible to make a good work by yourself. Therefore, I want to
thank to everyone that support and helped me during this journey.
My supervisor, Professor Alexandra Ribeiro from Faculdade de Ciências e Tecnologia – Universidade Nova de Lisboa (FCT-UNL), is thanked you for all her support, guidance during this period, and for all the help with bureaucracies. Thank for allowing me to make part of this project, and for being an example of hard work and rigor. A special thank goes to my co-supervisor, Professor Lisbeth M. Ottosen, Civil Engineering Department – Technical University of Denmark (BYG-DTU) for giving me this project, for her guidance, time and patience for all my questions and doubts. It was a pleasure working with you. I also want to thank to Ph.D. Gunvor Kirkelund for all her support and advices.
I would also like to thank to Ebba C. Scnell, for the guidance in the laboratory and for always being available to help. I cannot forget to thank Malene E. Grønvold, also for the help in the laboratory and for becoming such a good friend during my 5 months in Denmark. A big thank to the Sabrina Madsen for dealing with all of my samples analysis. A big thank also goes for all the E-Kin group that received me so well.
A big thanks goes for Faculdade de Ciências e Tecnolgia, this institution allowed me to grow academically and personally. A big thanks also to Doctor Eduardo Mateus, Cátia Magro and Paula Guedes for all the teaching and support, a learned a lot from you and I will always admire your fantastic work. In this institution I made friends for life and they have accompanied me and supported me during this incredible journey. Thus, thanks Carla, David, Rui, Ricardo, Rodri and Rafa for all the laughs, the tears, the pranks, the hard work, the nights without sleeping, and for being incredible human beings. Rita, you deserve thanks from the earth to the moon. Rita became my family and my biggest supporter. Thanks for being my dearest friend, for the support and for always calming me down, we make an incredible team. I also want to thank Rita´s parents for being my foster family, and Tiago for always encouraged me to get out of my comfort zone.
v
Sumário
O fósforo (P) está a tornar-se um elemento cada vez mais escasso devido à decrescente disponibilidade a partir de fontes primárias. Deste modo, a recuperação de P a partir de fontes secundárias, p.e. fluxo de resíduos, é extremamente importante. As cinzas de lamas de estações de tratamento de águas residuais (CLE) são uma fonte secundária viável de P. A aplicação directa das CLE como fertilizante apresenta várias restrições legais devido à presença de contaminantes inorgânicos, para além de que o P presente nas CLE não se encontra numa forma disponível para as plantas. O processo electrodialítico (ED) é um dos métodos usados para a recuperação de P e simultânea remoção de metais pesados. O presente trabalho teve como objetivo a optimização da recuperação de fósforo de CLE através de uma célula electrodialítica bi-compartimentada. A investigação foi dividida em três fases independentes. Na primeira fase foram realizadas experiências ED com duas CLE de diferentes estações, variando a duração de tratamento (2, 4, 6 e 9 dias). Durante as experiências ED, as cinzas foram suspensas em água destilada no anolito, tendo sido separadas do católito por uma membrana de troca catiónica. Após 6 dias de tratamento 90% do P de ambas as CLE foi extraido com sucesso. Relativamente à remoção de metais pesados, uma das CLE usadas apresentou uma melhor remoção comparativamente à outra. Assim, foi possível concluir que CLE de diferentes estações podem ser submetidas ao processo ED sob os mesmo parâmetros. Na segunda fase, as duas CLE foram expostas a alguma humidade e ar, com o intuito de as carbonatar. Embora este procedimento não tenha sido bem sucedido, foram realizadas experiências ED variando a duração tratamento (2 e 6 dias) e o tempo de exposição ao ar (7, 14 e 30 dias). Depois de 6 dias de tratamento e 30 dias de exposição ao ar, 90% de P foi extraído de ambas CLE. Concluiu-se que as CLE que foram expostas a alguma humidade e ar, p.e. CLE guardadas em depósitos abertos, durante 30 dias, podem ser tratadas sob os mesmo parâmetros do que as que foram recolhidas logo após o processo de incineração. Na terceira fase, foram conduzidas experiências EDcom uma duração de 6 dias, variando o tempo de agitação (0, 1, 2 e 4 h/dia). Após 6 dias de tratamento com uma agitação de 4 h/dia 80% e 90% do P foi extraido da CLE-A e CLE-B, respectivamente. Este valor muito próximo do obtido para 6 dias de tratamento agitando 24 h/dia.
vii
Abstract
Phosphorus (P) is becoming a scarce element due to the decreasing availability of primary sources. Therefore, recover P from secondary sources, e.g. waste streams, have become extremely important. Sewage sludge ash (SSA) is a reliable secondary source of P. The use of SSAs as a direct fertilizer has very restricted legislation due to the presence of inorganic contaminants. Furthermore, the P present in SSAs is not in a plant-available form. The electrodialytic (ED) process is one of the methods under development to recover P and simultaneously remove heavy metals. The present work aimed to optimize the P recovery through a 2 compartment electrodialytic cell. The research was divided in three independent phases. In the first phase, ED experiments were carried out for two SSAs from different seasons, varying the duration of the ED process (2, 4, 6 and 9 days). During the ED treatment the SSA was suspended in distilled water in the anolyte, which was separated from the catholyte by a cation exchange membrane. From both ashes 90% of P was successfully extracted after 6 days of treatment. Regarding the heavy metals removal, one of the SSAs had a better removal than the other. Therefore, it was possible to conclude that SSAs from different seasons can be submitted to ED process under the same parameters. In the second phase, the two SSAs were exposed to humidity and air prior to ED, in order to carbonate them. Although this procedure was not successful, ED experiments were carried out varying the duration of the treatment (2 and 6 days) and the period of air exposure that SSAs were submitted to (7, 14 and 30 days). After 6 days of treatment and 30 days of air exposure, 90% of phosphorus was successfully extracted from both ashes. No differences were identified between carbonated and non-carbonated SSAs. Thus, SSAs that were exposed to the air and humidity, e.g. SSAs stored for 30 days in an open deposit, can be treated under the same parameters as the SSAs directly collected from the incineration process. In the third phase, ED experiments were carried out during 6 days varying the stirring time (0, 1, 2 and 4 h/day) in order to investigate if energy can be saved on the stirring process. After 6 days of treatment and 4 h/day stirring, 80% and 90% of P was successfully extracted from SSA-A and SSA-B, respectively. This value is very similar to the one obtained for 6 days of treatment stirring 24 h/day.
ix
Abbreviations and symbols
2C – Two compartments
3C – Three compartments
2D – Two days
4D – Four days
6D – Six days
9D – Nine days
7D carb – Seven days of air exposure
14D carb – Fourteen days of air exposure
30D carb – Thirty days of air exposure
AN – Anion-exchange membrane
CAT – Cation-exchange membrane
ED – Electrodialytic
EDR – Electrodialytic remediation
EDS – Electrodialytic separation
EU – European Union
IC – Ion chromatography
ICP-OES – Inductively coupled plasma – optical emission spectroscopy
IWMI – International Water Management Institute
L/S – Liquid-to-solid
LOI – Loss on ignition
SSA – Sewage sludge ash
xi
Table of contents
Acknowledgements ... iii
Sumário ... v
Abstract ... vii
Abbreviations and symbols ... ix
Table of contents ... ix
List of figures ... xiii
List of tables ... xvii
1
Introduction ... 1
2
Literature review ... 3
2.1
Phosphorus
–
A scarce element ... 3
2.1.1
Global phosphorus cycle ... 3
2.1.2
Phosphate production worldwide ... 4
2.1.3
World demands for phosphorus in the future ... 6
2.2
Sewage sludge ash as a secondary source of phosphorus ... 7
2.2.1
Sewage sludge production ... 8
2.2.2
Incineration Process ... 9
2.2.3
SSA characteristics and potential use ... 11
2.3
Phosphorus recovery methods from SSA without an electric field ... 12
2.3.1
Dry thermal process ... 12
2.3.2
Wet chemical process ... 13
2.4
Electrodialytic process
–
A recovery method ... 17
2.4.1
General principle ... 18
2.4.2
Transport mechanisms ... 18
2.4.3
Electrodialytic P recovery from SSA ... 22
3
Research Plan ... 27
4
Material and methods ... 29
4.1
Sewage sludge ashes ... 29
4.2
Characterization methods ... 29
4.3
Carbonation ... 30
4.4
Electrodialytic experiments ... 31
5
Results and discussion ... 33
xii
5.2
Carbonated sewage sludge ash characteristics ... 36
5.3
Electrodialytic experiments
–
Annual variations in SSA characteristics ... 39
5.3.1
pH and conductivity ... 39
5.3.2
Phosphorus dissolution ... 42
5.3.3
Removal and separation of heavy metals ... 43
5.4
Electrodialytic experiments
–
carbonated SSA ... 48
5.4.1
pH and conductivity ... 48
5.4.2
Phosphorus dissolution ... 51
5.4.3
Removal and separation of heavy metals ... 52
5.5
Electrodialytic experiments
–
Variation on stirring time ... 57
5.5.1
pH and conductivity ... 57
5.5.2
Phosphorus dissolution ... 60
5.5.3
Removal and separation of heavy metals ... 61
6
Conclusions ... 65
7
Future developments ... 67
8
References ... 69
xiii
List of figures
Figure 2.1 Geological and organic phosphorus cycle including human impacts ... 4
Figure 2.2 Global phosphate rock output per country in millions of tonnes. ... 7
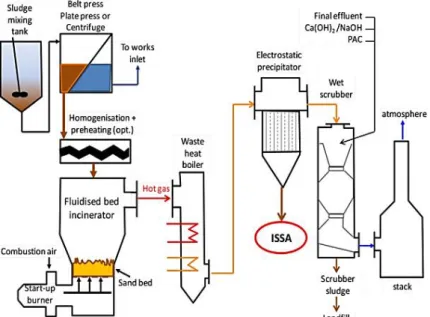
Figure 2.3 Overview of the sludge incineration process in a typical modern fluidized bed. ... 10
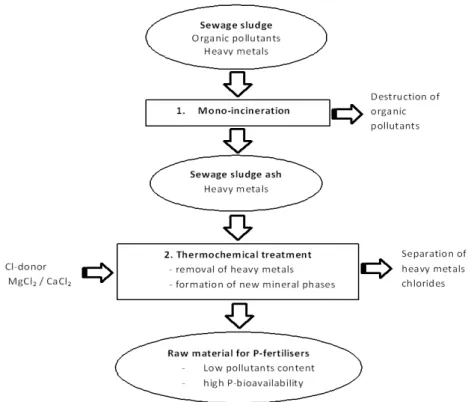
Figure 2.4 Schematic of the pathways of organic and inorganic pollutants during the dry thermal treatment. ... 13
Figure 2.5 Schematic representation of sequential precipitatio. ... 15
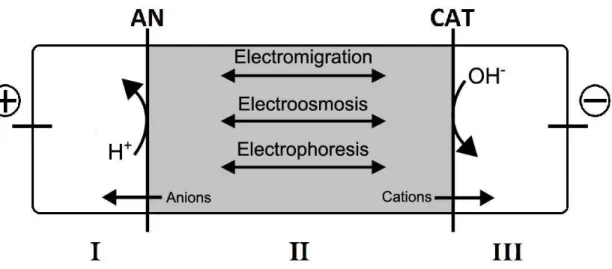
Figure 2.6 Schematic presentation of the ED principle in a 3 compartment cell. I - anode compartment; II - central compartment; III - cathode compartment. ... 18
Figure 2.7 Sketch of an ion-exchange membrane. ... 21
Figure 2.8 The (a) three and (b) two compartment cell setup, 3C and 2C, respectively, for electrodialytic (ED) remediation of the ash suspension. ... 23
Figure 3.1 Schematic representation of the research plan. ... 27
Figure 4.1 Pictures of the SSA during the carbonation process ... 30
Figure 5.1 Appearance of the SSA under studied. ... 33
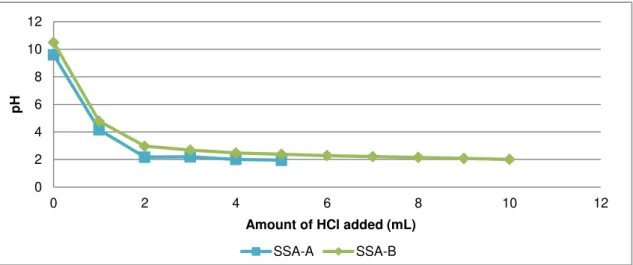
Figure 5.2 Desorption of: a) P; b) Cu; c) Pb; d) Zn for a wide pH range for SSA-A and SSA-B.35 Figure 5.3 Buffer capacity of SSA-A and SSA-B. ... 36
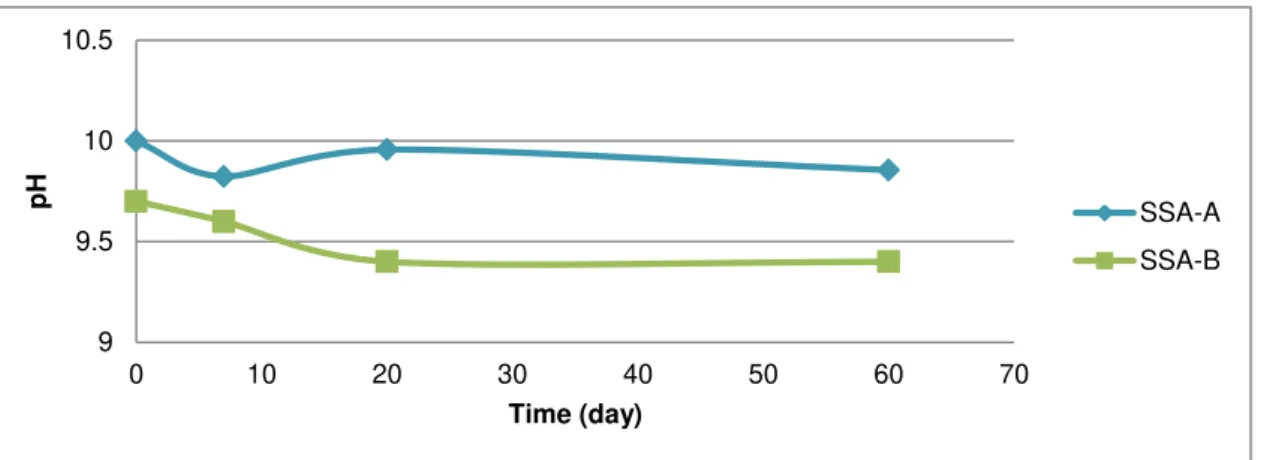
Figure 5.4 pH of SSA-A and SSA-B carbonated ashes during 7, 20 and 60 days of air exposure. ... 37
Figure 5.5 Buffer capacity of SSA-A and SSA-A carbonated. ... 37
Figure 5.6 Buffer capacity of SSA-B and SSA-B carbonated. ... 37
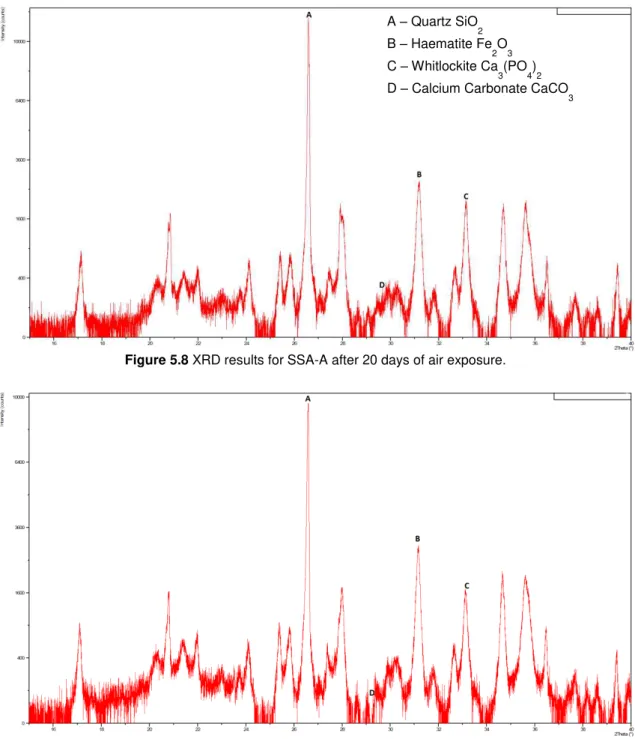
Figure 5.7 XRD results for SSA-A after 20 days of air exposure. ... 38
Figure 5.8 XRD results for SSA-B after 20 days of air exposure. ... 38
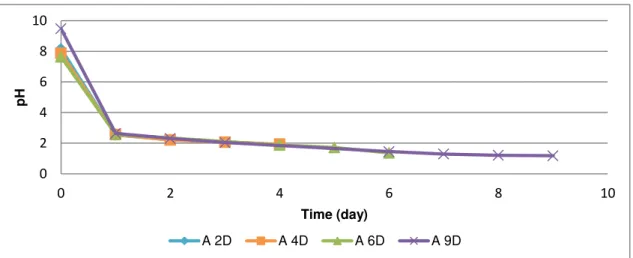
Figure 5.9 pH of ED experiments after 2, 4, 6 and 9 days, for SSA-A. xD – x period of the experiments) ... 40
Figure 5.10 pH of ED experiments after 2, 4, 6 and 9 days, for SSA-B. xD – x period of the experiments) ... 40
Figure 5.11 Conductivity of ED experiments after 2, 4, 6 and 9 days for SSA-A. (xD – x period of the experiments) ... 41
Figure 5.12 Conductivity of ED experiments after 2, 4, 6 and 9 days for SSA-A.(xD – x period of the experiments) ... 41
Figure 5.13 Percentage of total P in the different cell compartments along 9 days: a) SSA-A; b) SSA-B. ... 43
Figure 5.14 Percentage of total Cu in the different cell compartments along 9 days: a) SSA-A; b) SSA-B. ... 45
Figure 5.15 Percentage of total Pb in the different cell compartments along 9 days: a) SSA-A; b) SSA-B. ... 46
xiv
Figure 5.17 pH of: a) SSA-A over 2 days of ED experiment; b) SSA-B over 2 days of ED experiment (xD carb – x period of air exposure; SSA xD – x duration of ED experiment, non-carbonated SSA). ... 49Figure 5.18 pH of: a) SSA-A along 6 days of ED experiment; b) SSA-B along 6 days of ED experiment (xD carb – x period of air exposure; SSA xD – x duration of ED experiment, non-carbonated SSA). ... 49
Figure 5.19 conductivity of: a) SSA-A over 2 days of ED experiment; b) SSA-B over 2 days of ED experiment. (xD carb – x period of air exposure; SSA xD – x duration of ED experiment, non-carbonated SSA). ... 50
Figure 5.20 Conductivity of: a) SSA-A over 6 days of ED experiment; b1) SSA-B over 6 days of ED experiment. (xD carb – x period of air exposure; SSA xD – x duration of ED experiment, non-carbonated SSA). ... 50
Figure 5.21 Percentage of total P in the different compartments of the ED cell, after 2 days of treatment: a) SSA-A and b) SSA-B. (xD carb – period of air exposure; SSA xD – x period of ED experiment, non-carbonated SSA) ... 51
Figure 5.22 Percentage of total P in the different compartments of the ED cell, after 6 days of treatment: a) SSA-A and b) SSA-B. (xD carb – period of air exposure; SSA xD – x period of ED experiment, non-carbonated SSA) ... 52
Figure 5.23 Percentage of total Cu in the different compartments of the ED cell, after 2 days of treatment: a) SSA-A and b) SSA-B. (xD carb – period of air exposure; SSA xD – x period of ED experiment, non-carbonated SSA) ... 53
Figure 5.24 Percentage of total Cu in the different compartments of the ED cell, after 6 days of treatment: a) SSA-A and b) SSA-B. (xD carb – period of air exposure; SSA xD – x period of ED experiment, non-carbonated SSA) ... 54
Figure 5.25 Percentage of total Pb in the different compartments of the ED cell, after 2 days of treatment: a) SSA-A and b) SSA-B. (xD carb – period of air exposure; SSA xD – x period of ED experiment, non-carbonated SSA ) ... 54
Figure 5.26 Percentage of total P in the different compartments of the ED cell, after 6 days of treatment: a) SSA-A and b) SSA-B. (xD carb – period of air exposure; SSA xD – x period of ED experiment, non-carbonated SSA) ... 55
Figure 5.27 Percentage of total Zn in the different compartments of the ED cell, after 2 days of treatment: a) SSA-A and b) SSA-B. (xD carb – period of air exposure; SSA xD – x period of ED experiment, non-carbonated SSA) ... 56
Figure 5.28 Percentage of total P in the different compartments of the ED cell, after 6 days of treatment: a) SSA-A and b) SSA-B. (xD carb – period of air exposure; SSA xD – x period of ED experiment, non-carbonated SSA) ... 57
Figure 5.29 pH of: a) SSA-A and b) SSA-B over 6 days of treatment. (xh – hours of stirring per day; 6D – stirring 24 h/day) ... 58
Figure 5.30 conductivity of: a) SSA-A and b) SSA-B over 6 days of treatment. (xh – hours of stirring per day; 6D – stirring 24 h/day) ... 59
Figure 5.31 Percentage of total P in the different compartments of the ED cell, for: a) SSA-A and b) SSA-B after 6 days of treatment. (xh – hours of stirring per day; 6D – stirring 24 h/day) ... 60
xv
Figure 5.33 Percentage of total Pb in the different compartments of the ED cell, for: a) SSA-A and b) SSA-B after 6 days of treatment. (xh – hours of stirring per day; 6D – Stirring 24 h/day) ... 62xvii
List of tables
Table 2.1 Overview of typical fertilizers ... 4
Table 2.2 Range of concentration for Cu, Zn and Pb in phosphate rock for fertilizer production found in literature. ... 5
Table 2.3 Annual phosphate rock productions in the most important countries worldwide for the year 2013 and 2014 and current reserves. ... 5
Table 2.4 Concentration rages of ISSA reported on literature. ... 11
Table 2.5 Percentage of P dissolved through wet chemical treatment reported in literature. .... 16
Table 2.6 Percentage of dissolved P and found in the anode end through EDS process of SSA, reported in literature. ... 24
Table 2.7 Summary of advantages and disadvantages of P recovery methods from SSA. ... 26
Table 4.1 Experimental conditions for the different EDS experiments with a 2 compartment cell ( L/S = 14, Current 50 mA). ... 32
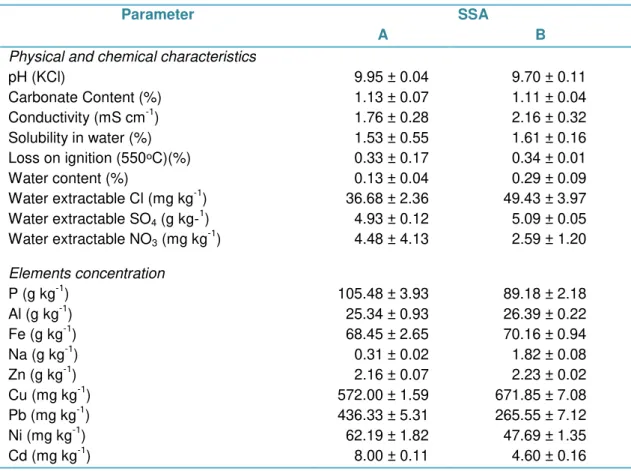
Table 5.1 Physical and chemical characteristics and element concentration of the February and July sewage sludge ash (mean ± STD), n=3. ... 34
Table 5.2 Water content of carbonated ashes after 7 days of air exposure in different moments ... 36
Table 5.3 Recovery rates of Cu, P, Pb, Zn for the ED experiments with a period of 2, 4, 6 and 9 days for SSA-A and SSA-B ... 42
Table 5.4 Percentages of Cu, Pb and Zn found in the cathode compartment. ... 44
Table 5.5 The duration and ash type varied between experiments. Ash dissolution, final pH and concentrations of Cu, Pb and Zn. ... 47
Table 5.6 Coefficient of variation for SSA-A and SSA-B experiments with carbonated and non-carbonates ashes (n = 3) ... 51
Table 5.7 Coefficient of variation of Cu for SSA-A and SSA-B experiments with carbonated and non-carbonates ashes (n = 3) ... 53
Table 5.8 Coefficient of variation of Pb for SSA-A and SSA-B experiments with carbonated and non-carbonated ashes (n = 3) ... 55
1
1 Introduction
Phosphorus (P) is an essential element to life, a limiting nutrient to the majority of the terrestrial ecosystems and it is a non-renewable element. Phosphorus compounds are massively used worldwide as inorganic fertilizers to increase crop productivity. In a world with 7 billion people and with an estimated population of 9-9.5 billion by 2050 (IWMI, 2006) the P primary sources will quickly disappear. In fact, the existing phosphate rock could be exhausted in 50-100 years (Steen, 1998) and numerous articles sugested that phosphorus reserves will be depleted in the 21st century (Cordell, Dragert and White, 2009; Haes et al., 2009; Vaccari, 2009). Thus, it is extremely important to develop methods for P recovery from other sources.
Humans excrete to sewage on average 1.2-1.4 g/day/capita of P in the developed countries, (Smill, 2000). The European population in 2009 was around 506 million (Eurostat (2009) -EU-28 countries) which gives a 220,000 t annual input of P to sewerage system. Sewage sludge has been used in agricultural fields worldwide, but it can contain pollutants. European Union legislation (Council Directive 86/278/EEC) restricts the direct use of sewage sludge, and thermal treatment became a major option for this type of waste.
Sewage sludge incineration has several advantages comparing with other options i.e. land-spreading and landfill, as there is a significant reduction of its volume to a small and stabilized amount of ash and thermal destruction of toxic organic compounds (Vesllind and Ramsey 1996). Accrding to Donatello et al. (2013) 1.7 Mt of sewage sludge ash (SSA) is produced every year around the world. The concentration of P in SSA is about 10-20 % per weight ( Donatello et al., 2010) proving the potential of SSA as a secondary source of P.
Over the years several options have been studied to extract P from SSA. These methods are acid and base treatment (Oliver and Carey, 1976; Levlin et al., 2003; Donatello et al., 2010 and Ottosen et al., 2013), thermochemical treatment (Adam et al., 2009) and electrodialytic remediation (Sturm et al., 2010).
For the recovery of P, the method used in this M.Sc. is new, based on electrochemical extraction and separation of P, more precisely in a two-compartment (2C) electrodialytic P recovery cell (Patent WO2015032903), which was developed at the Technical University of Denmark. Ebbers et al. (2015) showed that it is possible, with this new method, to extract 95% of P from SSA, and at the same time separate P from heavy metals.
2
i. What are the annual variations in the ash characteristics?
ii. Do annual variations in the ash characteristics influence the electrodialytic separation (EDS) process?
iii. Do carbonated ashes influence the EDS process?
3
2 Literature review
2.1 Phosphorus
–
A scarce element
Phosphorus is one of the vital components of DNA and is an essential nutrient for life. Justus von Liebig identified P as one limiting factor for plant growth. Thus, as a vital cell component, P cannot be replaced by another element (Cornel and Schaum, 2009).
The world population growth requires an increased supply of staple food. To guarantee these requirements the agricultural soils need a sufficient nutrient level, obtained by application of soil fertilizers. However, it is expected that in the 21st century the primary source of P will be exhausted (Cordell et al., 2009; Haes et al., 2009; Vaccari, 2009).
In food production, P has no substitute, and the European Union is entirely dependent upon imports. Global phosphate reserves are mainly controlled by China, Morocco and USA (U.S. Geological Survey, 2015). Phosphate rock is one of the critical raw materials (CRM) identified in the 2014 EU CRM list, therefore it is necessary to find ways to recover P for reuse.
Sewage sludge ashes (SSA) are a reliable second source of P since the concentration of P in SSA is about 10-20% per weight (Donatello et al., 2010) and will be further discussed in this chapter.
2.1.1 Global phosphorus cycle
The P - cycle is similar to several other mineral nutrient cycles as it exists in soils, minerals, living organisms and water, although P is not found by itself in its elemental form (Guedes et al. 2014a). The P - cycle can be divided into: inorganic and organic parts. Figure 2.1 shows the geological and organic P cycle.
The inorganic part is described by erosion, transport to the oceans, sedimentation, tectonic uplift and alteration of phosphate-containing rocks into phosphates in soil that are plant-available. In this part of the P-cycle the interactions occur in a geological scale-time (Cornel and Schaum, 2009).
4
Figure 2.1 shows that phosphate rock is mined and used in industry in and agricultural applications. Without P-recovery techniques P ends up in the sewer system and P enriched waste is produced by sewage treatment.
Human activities have increased the global P-cycle by an average of 400% (Falkowski et al., 2000). Profound ecosystem-level changes are now evident (e.g. eutrophication), as a result of anthropogenic distortion of this macronutrient balance (Guedes et al., 2014a)
2.1.2 Phosphate production worldwide
The products that are mainly based on phosphate can be divided into two categories: agricultural and non-agricultural applications. Approximately, 95% of the global phosphate production is used in agricultural productions, mostly in the fertilizer industry (Desmidt et al., 2015). Table 2.1 presents an overview of typical fertilizers. The phosphates used to produce fertilizers are obtained from phosphate rocks.
Table 2.1Overview of typical fertilizers (Desmidt et al., 2015)
Compound Acronym Formula Nutrient content
(%P)
Ordinary superphosphate OSP Ca(H2PO4)2 + CaSO4 8-9
Triple superphosphate TSP Ca(H2PO4)2 19-20
Monoammonium phosphate MAP NH4H2PO4 21-24
Diammonium phosphate DAP (NH4)2HPO4 20-23
5
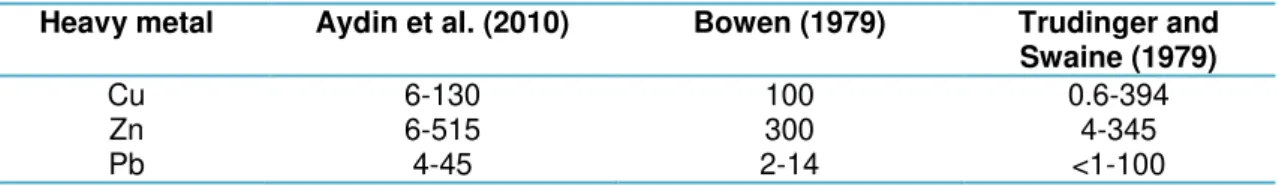
Depending on its region, heavy metals can be present in the phosphate rock (Ribeiro and Serrão, 1996) and the range of concentrations for Cu, Zn and Pb are shown in Table 2.2.
Table 2.2 Range of concentration for Cu, Zn and Pb in phosphate rock for fertilizer production found in literature.
Heavy metal Aydin et al. (2010) Bowen (1979) Trudinger and Swaine (1979)
Cu 6-130 100 0.6-394
Zn 6-515 300 4-345
Pb 4-45 2-14 <1-100
Phosphate rocks can be divided into two major groups: sedimentary and igneous. The largest sedimentary reserves of phosphate rock are situated in northern Africa, China, Middle East, and United States. The igneous reserves are found in Brazil, Canada, Russia, and South Africa (Desmidt et al., 2015).
According to U.S Geological Survey (2015), about 180-190 million tons of phosphate rock are mined globally each year. World production was estimated to be slightly lower in 2014 because of lower output from China (U.S. Geological Survey, 2015).
Table 2.3 shows the annual phosphate rock production in the most important countries worldwide for the years 2013 and 2014. The last column shows an estimation of the existing reserves. Morocco and Western Sahara have the major phosphate reserves (around 70% of the remaining world phosphate reserves) (U.S. Geological Survey, 2015).
Table 2.3 Annual phosphate rock productions in the most important countries worldwide for the year 2013 and 2014 and current reserves (in 1000 metric tons) (data from U.S. Geological Survey, 2015)
Countries Mine Production
2013 2014e
Reserves
United States 31,200 27,100 1,100,000
Algeria 1,500 1,500 2,200,000
Australia 2,600 2,600 1,030,000
Brazil 6,000 6,750 270,000
Canada 400 -- 76,000
China 108,000 100,000 3,700,000
Egypt 6,500 6,000 715,000
India 1,270 2,100 35,000
Iraq 250 250 430,000
Israel 3,500 3,600 130,000
Jordan 5,400 6,000 1,300,000
Kazakhstan 1,600 1,600 260,000
Mexico 1,760 1,700 30,000
Morocco and Western Sahara 26,400 30,000 50,000,000
e
6
Table 2.3 (cont.) Annual phosphate rock productions in the most important countries worldwide for the year 2013 and 2014 and current reserves (in 1000 metric tons) (data from U.S. Geological Survey, 2015)e
Estimated values.
Phosphate rocks are primary sources of P. However, there are others sources (secondary sources) from which it is possible to extract phosphorus, such as: livestock manure, sewage sludge and organic waste. In Denmark, nowadays, a total of 2.6 Mt of sewage sludge, 32 Mt of livestock manure and 0.7 Mt of organic waste are produced. Together, this waste contains around 50,000 t of phosphorus (Danish Government, 2013).
2.1.3 World demands for phosphorus in the future
The world population is increasing, estimated to be about 9-9.5 billion by 2050 (IWMI, 2006) and, as a consequence, the P demands will increase as well.
Figure 2.2 shows the output per country of phosphate rock in the world. In North America and Asia, although they are big producers of P, the consumption rates are much higher, leading to a need to import. Thus, Morocco becomes the most important producer in the world. In the figure is possible to notice that Europe as no significant phosphate rock reserves, which implies that all the soctks are imported from outside the continent. This makes phosphate rock a CRM, as already referred.
Countries Mine Production
2013 2014e
Reserves
Peru 2,580 2,600 820,000
Russia 10,000 10,000 1,300,000
Saudi Arabia 3,000 3,000 211,000
Senegal 800 700 50,000
South Africa 2,300 2,200 1,500,000
Syria 500 1,000 1,800,000
Togo 1,110 1,200 30,000
Tunisia 3,500 5,000 100,000
Vietnam 2,370 2,400 30,000
Other countries 2,580 2,600 300,000
World total (rounded) 225,00
0
7
Several reasons are influencing the increase on the cost of phosphate rock, such as: decline in quality, greater expense on extraction, refinement, transportation and environmental management (Desmidt et al., 2015).
Considering that in the EU-15 the net per capita consumption is 4.7 kgP/yr, but only 1.2 kg/yr reach the consumer (Ott and Rechberger, 2012), and according to Ott and Rechberger (2012) the main losses occur at:
i. accumulation in agricultural soils - 2.9 kgP/yr; ii. losses to landfills – 1.4 kg/yr;
iii. to the hydrosphere – 0.55 kg/yr.
Only 0.77 kg P/yr is recycled. In order to reduce Europe’s import dependence on phosphorus is necessary to optimize P fertilization, recover P for recycling from P-rich wastes, and increase the connection of households to sewer systems, as well as, implementing tertiary wastewater treatment (Ott and Rechberger, 2012).
2.2 Sewage sludge ash as a secondary source of phosphorus
Since the 70’s environmental concern has been growing worldwide, is noticeable in the increasing environmental legislation since then. In the European Union (EU), one of the
8
environmental legislations is Council Directive 91/271/EEC of 21 May 1991, concerning urban wastewater treatment, and was created to protect the environment from the adverse effects of the wastewater discharges. Legislative barriers regarding sewage sludge disposal and application in agricultural land were developed as well (86/278/EEC). Thus, due to the restrict legislation for sewage sludge disposal, other alternative had to be studied. The disposal of SSA into landfill is restricted by the Council Directive 1999/31/EC of 26 April 1999 on the landfill of waste, since all member states shall reduce the biodegradable waste going to landfill. According to Donatello et al. (2013) the major alternative to land-spreading and landfilling is incineration.
The ashes produced in incineration are separated from exhaust gases in filter bags. The separated fly ash contains high levels of phosphate, around 10-20% mass as P2O5 (Donatello et
al., 2010). The disposal of SSA to landfill represents a loss of phosphates and a possible cement replacement material (Donatello et al., 2010). Thus, the main advantages of re-using ashes are: the use of a zero-cost raw material, the conservation of natural resources, and the elimination of waste (Ferreira et al., 2003).
2.2.1 Sewage sludge production
The Directive 91/27/EEC encouraged cities with more than 2000 person equivalent to implement secondary wastewater treatment leading to an increase in sewage sludge production.
The EUproduces around 10 Mt of dry solid sludge per year (Eurostat, 2005). According to Smill (2000), daily humans excrete about 1.2 to 1.4 g per capita of P in developed countries. In the year of 2009 the EU population was around 506 million people (Eurostat, 2009), leading to an annual P input of 220,000 tonnes on the sewerage system.
9
values for concentrations of heavy metals in the soil, in sludge and for the maximum annual quantities of heavy metals which may be introduced into the soil.The disposal of sewage sludge in landfills is a true loss of a reliable secondary source of phosphorus. According to Mihelcic (2011), if collected, the P available from human excreta could account for 22% of the global P fertilizer demand.
2.2.2 Incineration Process
The increase in sewage sludge production and EU directives from the last two decades, above discussed, led to an increase in incineration process (Donatello and Cheeseman, 2013), at least in some countries as Denmark.
According to Directive 2000/76/EC of the European Parliament and Council, incineration plants correspond to any stationary or mobile technical unit dedicated to the thermal treatment of wastes with or without recovery of the combustion heat generated. This includes the incineration of waste as well as other thermal treatment process such as pyrolysis or gasification, in so far as the substances resulting from the treatment are subsequently incinerated.
Phosphorus recovery from SSA is only possible if the sewage sludge were incinerated in a mono-sewage sludge incineration plant. Co-incineration in cement furnaces and coal-burning power plants should not be accepted with regard to P recovery (Cornel and Schaum, 2009).
10
Waste Incineration Directive (2000/76/EC), the flue gas is treated using a wet scrubber with acid, alkali and possibly activated carbon.
The incineration process presents several advantages like:
Significant reduction of sewage sludge volume and mass (90% and 70%, respectively), to a small and stabilized amount of ash (Hjelmar, 1996; Kirby & Rimstidt, 1993; Medici et al., 2000);
Enrichment of P in the ashes (Cornel and Schaum, 2009)
Thermal destruction of toxic organic compounds and pathogenic agents (Marani et al., 2003; Porteous, 2005);
Generation of thermal energy that can be reused (Marani et al., 2003; Porteous, 2005).
Considering that around 300 to 400 kg of ashes are produced per t of dried sludge, and as mentioned before, the EU produces 10 Mt of dry solids per year (about 15% is incinerated), about 0.5 Mt of ashes must be managed each year in EU (Cyr et al.,2006). In order to achieve a circular economy is importante not to forget the potential re-uses of this type of material.
11
2.2.3 SSA characteristics and potential use
In a world towards to zero-waste production, that starts to reflect on waste management policies, it is clever to find ways besides landfilling to waste like SSA.
Characterization and potential re-use applications of SSA has been the subject of significant research. SSA is mainly composed of Si, Ca, P and Al (Cyr et al. 2007). SSA are, as well, composed by significant amounts of heavy metals such as Zn, Cu, Cr and Pb. The incineration of organic matter leads to an enrichment of P in the ashes (Cornel and Schaum 2009). The P2O5 content on SSA is ca.10-20% per weight (S Donatello et al., 2010). The Table 2.4 shows
concentration ranges of elements in SSA reported in literature.
Table 2.4 Concentration rages of ISSA reported on literature (adapted from Ebbers et al., 2015).
Element SSA
a
(g kg-1)
Fe 47 - 200
Al 22 - 218
P 39 - 92
Cu 417 – 678
Cd 0.4 – 3.9
Cr 102 – 136
Ni 50 – 93
Pb 18 - 158
Zn 448 - 2737
a
Range of literature values (Levlin et al., 2003; Franz et al., 2008; Donatello et al., 2010 and Ebbers et al., 2015).
Sewage sludge ash, due to their characteristics, presents several potential uses such as:
i. Clay or sand substitute for the brick manufacture (Anderson et al., 1996; Okuno and Takahashi, 1997)
ii. Tiles (Lin et al., 2008; Chen and Lin, 2009); iii. Ceramics (Merino et al,. 2007; Park et al. 2003);
iv. Lightweight aggregates (Wainwright and Cresswell, 2000; Cheeseman & Virdi 2005); v. Cement replacement material and pozzolanic addictive to cement mortars (Cyr et al.,
2007; Garcés et al., 2008; Donatello et al., 2010)
The above applications mentioned do not make use of the valuable P present in the ashes. As referred before SSA contain about 10-20% mass of P2O5 (Donatello et al., 2010), proving that
12
as fertilizer since P is not plant available (Ottosen et al. 2013). In order to extract P from SSA several methods were developed since the 70´s, and they will be further discussed.
2.3 Phosphorus recovery methods from SSA without an electric field
Due to P scarcity, discussed in section 2.1, P recovery methods from secondary sources were studied and developed over the years.
The majority of the methods developed aimed at separating heavy metals from valuable P and for converting P into a plant-available form, for reuse in P-industry (Petzet et al., 2012). These P-recovery technologies can be divided into three categories:
1. Dry thermal process; 2. Wet chemical process;
3. Electrodialytic process – involve an electric field, thus it will be further discussed in section 2.3.3.
2.3.1 Dry thermal process
Mono-incineration destroys all organic pollutants present in the sewage sludge (Adam et al. 2009). The resultant ashes have a high amount of P and heavy metals. The issue is that the content of heavy metals is still above the legal limits for ashes reuse as inorganic fertilizer (Adam et al. 2009).
The dry thermal approaches separate P and heavy metals at temperatures between 1000 – 2000 °C (Adam et al., 2009; Mattenberger et al., 2008). In order to obtain a P-recovery product with low content of heavy metals, besides high temperatures, is necessary to add chlorine donors (MgCl2 and CaCl2) to the SSA. The amount of needed chloride donors depends of the
13
The experiments conducted by Mattenberger et al. (2008) and Adam et al. (2009) revealed a relevant removal of heavy metals and a P recovery of almost 100%.
Schipper et al. (2001) studied, as well, the thermal process and the feasibility of SSA as an alternative of Ca3(PO4)2 and concluded that the use of the SSA is limited due to the need to
maintain the maximum Fe content of the phosphate feed at less than 10,000 mg/kg to minimize the formation of unwanted FeP by-products (Donatello and Cheeseman, 2013)
Thermochemical recovery of P from SSA presents some concerns e.g the costs of the procedure and the equipment lifetime, due to the highly corrosive generated conditions (Donatello et al. 2010).
2.3.2 Wet chemical process
For P-recovery through wet chemical process, H2SO4 is the main acid used because of his low
cost. The first studies on this subject were made by Oliver and Carey in 1976, they used H2SO4
and HCl. At that time, they concluded that it was too expensive to recover P through an acid extraction.
14
In this method, in acid leaching P, heavy metals and some major cations such as Fe, Al and Ca are dissolved into the solution. The dissolution of P occurs for a pH value below 2 (Takahashi et al. 2001). The aim, of many studies carried out on wet chemical treatment (Oliver and Carey 1976; Takahashi et al., 2001; Franz 2008; Donatello et al., 2010; Ottosen et al., 2013), was to separate P from the heavy metals, and have a P-recovery product available to use in agriculture.
The composition of the raw SSA influences the amount of heavy metals dissolved as well as the type and amount of acid added (HCl and H2SO4) (Petzet et al., 2012). The P present in this type
of ashes is usually in the form of calcium phosphate (Ca-P), iron phosphates (Fe-P) and aluminium phosphates (Al-P) (Petzet et al., 2012).
In order to separate the dissolved heavy metals, Fe and Al from the dissolved P, many technologies were developed:
i. Sequential precipitation (Takahashi et al., 2001);
ii. Liquid-Liquid extraction (Pinnekamp et al., 2010) and sulfidic precipitation (Franz, 2008; Ottosen et al., 2013);
iii. Cation ion exchanger ( Donatello et al., 2010; Franz, 2008); iv. Nano-filtration (Niewersch et al., 2009).
i. Sequential precipitation:
Takahashi et al. (2001) presented a sequential precipitation method where the dissolution was break-up in three steps. In the first step, H2SO4 is added to the ashes in order to obtain a pH
below 2. A pH below 2 allows the separation of the valuable P and heavy metals from the insoluble SSA residue. The second step is separating the eluted P and heavy metals from the acid-insoluble residue by filtration. This separation is possible by adding sodium bicarbonate that increases the pH to around 4. At this pH phosphate was selectively precipitated as AlPO4.
In the third step the heavy metals are precipitated with NaOH or Ca(OH)2, which increases the
pH of the eluted solution to 10 (Takahashi et al., 2001). A schematic representation of this technology is shown on Figure 2.5. Since all P has to be precipitated as Al-P, sequential precipitation can be directly applied to Al-rich SSA (Petzet et al. 2012). One limitation of the process used by Takahashi et al. (2001) was the marketability of the AlPO4 product. High purity
applications tend to work with concentrated H3PO4 and the release of soluble Al 3+
15
ii. Liquid-liquid extraction and sulfidic precipitation
Liquid-liquid extraction and sulfidic precipitation are procedures that successfully remove dissolved heavy metals from the acid leachate (Petzet et al., 2012). The heavy metals form sparingly soluble sulfide compounds, which mean that they precipitate very easily (Franz, 2008). After this step, CaO is added to the heavy metal-free solution, causing the precipitation of calcium phosphates. It is important to note that in the heavy metal-free solution Al still remains. Thus, when CaO is added at least 50% of the P do not precipitate as Ca-P but as Al-P (Petzet et al., 2012).
iii. Cation ion exchanger
An ion exchanger material can be defined as an insoluble matrix containing labile ions capable of exchanging with ions presents on the surrounded environment without major physical change taking place in its structure (Animesh et al., 1993).
In the experiments carried out by Donatello et al. (2010), a cation exchange resin was used to remove cation impurities from the filtrate where P was dissolved. It was possible to concentrate up to 85% H3PO4. Franz (2008) used cation exchange resins to remove heavy
metalsfrom the leach solution.
The cation ion exchanger is a very successful technology to remove all cations, including Al. This method was reported by Donatello et al. (2010) and Franz (2008), but both authors referred that the regeneration of the columns was not economically feasible.
16
iv. Nano-filtration
Nano-filtration allows P to separate from multivalent cations by membranes. The results reported so far are not satisfactory, since the membranes retain too much P, due to the high ionic strength of the acidic leachate which is mainly caused by dissolved Al3+ (Niewersch et al., 2009).
Petzet et al. (2012) developed a process called SESAL that is an alternative to the process used by Takahashi, as this ultimately produces a solid Ca-phosphate precipitate and soluble AlCl3 solution. The by-product can be used in waste water treatment plants, for chemical
precipitation of P from sewage effluent, representing a closed loop for Al cycling. The process involves maintaining a pH of 3 with HCl, which the authors claim that under this condition Ca-P compound dissolve and Al-P compounds simultaneously precipitates (Petzet et al., 2011). The Al phosphates are retained in the filter bag along with acid insoluble SSA residues. The soluble heavy metals and Ca+ pass to the filtrate. The solid fraction is then treated with NaOH at pH 13, and under this condition Al-phosphate is dissolved and separated from the insoluble silicate, aluminosilicate and hematite components of SSA. As a last step, the Al - phosphate filtrate is treated with CaCl2 to precipitate P as Ca-phosphate and the soluble Al pass to the filtrate as
AlCl3 (aq) (Donatello and Cheeseman, 2013).
Table 2.5 presents the percentage of P dissolved trough wet chemical treatments reported in literature.
Table 2.5 Percentage of P dissolved through wet chemical treatment reported in literature.
a
Franz (2008) used cation exchange resins to remove heavy metals from sulphuric acid leach solution.
b
Donatello et al. (2010) used cation exchange resin to purified the filtrate.
Today sufficient conclusive data is only available for liquid-liquid extraction, sulfidic precipitation, and sequential precipitation. The first two procedures are only efficient in Fe-rich SSA, failing to remove Al from the acidic leachate, while for Al-rich SSA only sequential precipitation can be applied (Petzet et al. 2012).
Ottosen et al. (2013) reported gypsum formation during extraction with H2SO4. The ashes with
acid addition had a much higher concentration of gypsum crystals. The main problem is that the
Method Author(s) Acid Dissolved P (%)
Acid Extraction
Oliver and Carey (1976)
H2SO4
76
Franz (2008)a 83
Donatello et al. (2010)b 91
Ottosen et al. (2013) 100
Oliver and Carey (1976) HCl 61 Alkaline
Treatment + Acid Pre-Treatment
17
gypsum formation will influence the reuse options of the treated ash, e.g. construction materials (Donatello et al., 2010).
Donatello et al. (2010) had a different approach on the acid extraction of P. The main goal was to produce a technical grade phosphoric acid from SSA. The major costs of this approach concerned the sulfuric acid to dissolve the phosphates, hydrochloric acid to regenerate the cation-exchange resin and the energy to evaporate the excess water from the dilute filtrate.
2.4 Electrodialytic process
–
A recovery method
Electrokinetic phenomenon is not a recent discovery. This phenomenon was discovered by Reuss in 1808 and first treated analytical by Helmholtz in 1879. This theory was later modified by Smoluchowski in 1922 (Ribeiro, 1998).
The electrodialytic remediation process (ED) for fine particular materials is a combination of the electrokinetic principle with the use of an ion-exchange membrane. This method was first developed in the 90’s for remediation of heavy metal polluted soil at the Technical University of Denmark (Patent PCT/DK95/00209). The ED process was already tried, with success, in other solid matrices, besides soil, such as:
Harbour sediments (Nystrøm et al. 2005); Impregnated waste wood (Ribeiro et al. 2000); Mine tailings (Hansen et al. 2004)
Sludge (Ottosen et al. 2007);
Different ash residues (Ferreira, 2005; Lima, 2008; Lima et al. 2012; Kirkelund et al., 2013; Guedes et al., 2014).
According to Velizarova et al., 2002 the ED processs presents several advantages:
i. application of a low-level direct current to move the charged species;
ii. use of ion-exchange membranes allowing to regulate the direction and magnitude of the ion fluxes;
iii. possibility to control the degree of elements removal by adjusting the flow rates of the solutions contacting with the membranes;
iv. the elements removed might be recycled; v. the “cleaned” matrix might be further used.
18
2.4.1 General principle
The general principle used in ED process is that ions, including heavy metal ions, move under the presence of an electric field. This process uses a low-level direct current to create an electric field between a pair of electrodes placed in a system containing charged particles, such as, a water saturated sewage sludge ash matrix. Thus, the pollutants and natural species presents in the system are driven towards the electrodes, depending on their charges (Ribeiro, 1998).
On inert electrodes, the reaction can be controlled in order to produce H+ in the anode and OH -ions on the cathode (Ribeiro, 1998). Ion-exchange membranes are used to separate the contaminated soil volume, or in this case of study, water saturated SSA from the electrolyte solutions. Thus, the ED process allows concentrating and confining contaminants to an electrode compartment from where they may be removed (Ribeiro, 1998). Further it will be discussed the use of the ED process, besides a remediation technique, as a recovery technique.
2.4.2 Transport mechanisms
When an electric field is applied in a system containing charged particles three main mass transport mechanisms are involved: electromigration, electroosmosis and electrophoresis. The transport processes are schematized in Figure 2.6.
19
ElectromigrationElectromigration is the physical transport mechanism that allows ions and ionic complexes to move towards the electrodes with the opposite charge, under an electric field (Ribeiro, 1998). The electric current tends to go where the electrical resistance is lower.
The electromigration, Jm, is given by:
𝐽𝑚 = − µ ∗ 𝑐Φ𝑒 (2.1)
Where:
µ* and c– ionic mobility and concentration of species;
Φ𝑒– gradient of electric potential.
According to Acar and Alshawabkeh (1993) the most important transport mechanism for ions in porous media is electromigration, and the electromigration flux is dependent on ionic mobility, tortuosity factor, porosity of the material, and charge of the ions.
Electroosmosis
Electroosmosis is the most important mechanism of removal of uncharged and or weakly dissociated organic contaminants (Ribeiro, 1998). This mechanism is based on the movement of the pore water under the influence of an electric field (Ottosen, 1995). The direction of the flow in electroosmosis is usually towards to the cathode. However a low pH can cause a change in the charge of the solid matrices, causing a reverse in the flow-direction (Jensen, 2005).
Electromigration will dominate in coarse sands and high plasticity clays with low water content, where the electroosmotic transport component will almost disappear. Electroosmosis would be a significant transport mechanism in fine sands, silts and low activity clay with high water content and low conductivities (Ribeiro and Maroto, 2006)
Electroosmotic flow depends on the electroosmotic coefficient of permeability and the electrical potential gradient (Ribeiro 1998) as described in the following equation:
20
Where:
𝑘𝑒– electroosmotic permeability of soil;
𝑐– concentration of species;
Φ𝑒– gradient of electric potential.
Electrophoresis
Electrophoresis is an opposite mechanism to electromigration. Electrophoresis is the movement of charged colloids towards to the electrode with the same charge, under an electric field (Ribeiro 1998). The charged particles are electrostatically attracted to one of the electrodes (e.g. negatively charged clay particles move towards the anode) (Ribeiro, 1998).
In the EDR of a consolidated matrix of particles, electrophoresis is not a significant mass transport mechanism (Jensen 2005). On the other hand electrophoresis is very significant when an electric field is applied to a slurry, as well as in unconsolidated soils (Ottosen, 1995).
Diffusion
The main idea of diffusion is that compounds will migrate from regions of high concentrations to low concentration regions. This means that the species will move under a concentration gradient (Ribeiro, 1998). The diffusion flux in porous media is represented by the Flyck’s first law:
𝐽𝑑𝑖𝑓𝑓= 𝐷𝑖∗∇. (−𝑐𝑖) (2.3)
Where:
𝐷𝑖∗ − effective diffusion coefficient of species (cm2
/s);
∇. (−𝑐𝑖)– concentration gradient.
In usual conditions for the electrokinetic treatment this is a secondary treatment, only important in some areas with high gradients (Ribeiro & Rodriguez-Maroto, 2006).
Electrodialysis
21
the pore water of the membranes. Due to the electric current and the co-ions the counter-ions will be transported through the membrane (Ottosen, 1995).
In the ED process two types of membranes are used: the cation exchange membrane and the anion-exchange membrane. The anion exchange membrane is placed between the water saturated SSA or soil and the electrolyte solution at the anode end, while the cation exchange membrane is placed at the cathode end (Guedes et al., 2014a).
The ion-exchange membranes used in the ED process should have a high selectivity for oppositely charged ions and high permeability (Ottosen, 1995). Figure 2.7 shows a representation of an ion-exchange membrane.
Electrodes reactions
The inert electrodes used in ED process are usually made of carbon, platinum or titanium, in order to not interfere with the electrodes reactions (Nystrøm, 2001)
The ED process occurs with several interacting mechanisms. The main electron transfer reaction, during the ED process, happens at the electrodes and is called electrolysis of water. The primary reactions are the following:
Cathode: 2H2O + 2e
→ H2(g) + 2OH -
(2.4)
Anode: 2H2O → O2(g)+ 4H +
+ 4e- (2.5)
Hydrogen is formed in the anode. Therefore an acid front is carried towards the cathode by electrical migration, diffusion and advection. Thus, a pH increase occurs near to the cathode and a pH decrease near to the anode, due to hydroxide formation (Virkutyte et al., 2002).
22
Other electrode processes may take place at the surface of the inert electrodes, when the ion concentration in the electrolytes is increased, such as precipitation of a metal at the electrode surface:
Cathode: H+ + e- → 1
2 H2 (2.6)
Cathode: Men +
+ ne- → Me (2.7)
Cathode: Me(OH)n + ne
→ Me + nOH- (2.8)
Chloride gas can be produced in case of presence of chloride in the electrolyte:
Anode: 2Cl- → Cl2 (g) + 2e- (2.9)
2.4.3 Electrodialytic P recovery from SSA
As previously referred, SSA are a P secondary source. As previous described several methods, without applying an electric field, have been developed for P recovery.
The ED process has been used as a remediation technique (EDR). EDR is aiming at detoxification for reduction of the amount of hazardous waste (Ottosen et al., 2014). Recently ED process has been used as a separation method (EDS) and as a P recovery method (Guedes et al., 2014;Ottosen et al., 2014; Ebbers et al., 2015). The aims of EDS are widened and the emphasis is on the recovery of resources through the separation of chemicals from particulate waste (Ottosen et al., 2014).
If the pH is not strongly acid, phosphate in the pore water exists as an anionic species, e.g. H2PO4
-, contrary to most heavy metals (e.g. Cu2+and Pb2+). Therefore, if a direct current is applied to water saturated SSA the phosphates and other anions will be carried to the anolyte, while most heavy metals will accumulate in the catholyte (Guedes et al., 2014a).
The efficiency of the electrokinetic P recovery can be influenced by the solubility of P compounds, once it is strongly pH-dependent. Thus, phosphate mineral dissolution is increased under acidic conditions (Sturm et al., 2010). Furthermore, in an electric field, the transport velocity is influenced by ionic charge, and four speciation states, H3PO4, H2PO4
-, HPO4
2-, PO4
23
Strum (2010) used the electrokinetic process in a packed bed to extract P from sewage sludge ash. The investigation showed that it is possible to concentrate a small part of the P in the processing solutions at the anolyte. However the setup used was not feasible from the point of energy demand.
Figure 2.8 (a) shows a 3 compartment (3C) cell (Ottosen et al., 2014; Guedes et al., 2014b; Ebbers et al., 2015) and Figure 2. ((b) shows a 2 compartment cell (2C) (Ebbers et al., 2015; Ottosen et al., Submitted). These cells have been used for EDS P recovery and simultaneous heavy metals removal.
Figure 2.8 The (a) three and (b) two compartment cell setup, 3C and 2C, respectively, for electrodialytic (ED) remediation of the ash suspension. In the 3C-ED cell setup, the anode (+) is separated from the ash suspension by an anion exchange membrane (AN,) whereas in the 2C-ED cell setup, the anion exchange membrane is removed and the anode is placed in direct contact with the ash suspension (Ebbers et al., 2015).
Ottosen et al. (2014) conducted an experimental screening of a combination between acid extraction and electrodialytic separation, using two different ashes: one rich in Fe and the other rich in Al. The experiments with the Fe-rich ash were well succeeded; it was possible to separate P into one processing solution, heavy metals (Cu, Zn, Ni, Pb) into another, keeping the ash suspended in a third solution (which still contained P after 1 week of EDS). In the EDS experiments with the Al-rich ash only a minor part of P was transported into the anolyte and the major part stayed in the ash suspended solution, due to the formation of uncharged species between P and Al. At high acid addition (11.4 mole H+/kg ash) P was transported equally into the anolyte and catholyte and thus no separation was obtained in the Al-rich ash. At lower acid addition the separation was better, but the major part of P was in the ash, and the separation was not achieved during the week that experiments lasted. For both ashes a good heavy metal separation was obtained, as the major fraction of the mobilized heavy metals were transported into the catholyte.
24
cathode end. Almost 98% P was present in the anolyte composition. The highest heavy metal removal was achieved for Cu (80%) and the lowest for Pb and Fe (between 4% and 6%).
Ebbers et al. (2015) made adjustments to the 3C ED cell setup by removing the anion exchange membrane. This brings the anode in direct contact with the stirred ash suspension. Through this adjustment, half-reactions at the anode contribute to the acidity of the stirred ash suspension resulting in the increased dissolution of both phosphorus and heavy metals (Cd, Cu, Cr, Zn, Ni) and better separation of most heavy metals from the stirred suspension. The combination of ED in a two compartment setup and initial acidification of the stirred suspension is most effective in dissolving of phosphorus and separating heavy metals. Almost 96% of the phosphorus in the ash was dissolved after 7 days, in this setup.
Ottosen et al. (Submitted) also made ED experiments with 2C cells. The overall aim was to recover P from SSA and produce a phosphorous salt with a high concentration of water soluble P and a low concentration of heavy metals to be used in fertilizer production. Two different SSA were treated. The SSA was suspended in water in the anolyte, which was separated from the catholyte by a cation exchange membrane. After the treatment the SSA suspension was filtered and a phosphorous salt was produced by evaporating the water from the filtrate. Almost 95% of P was extracted from both ashes, and the extracted heavy metals were transported into the catholyte to a high extent. A salt with a good quality for use in fertilizer production was obtained. The water solubility of P, in this salt, was high (92%) and the concentration of heavy metals lower.
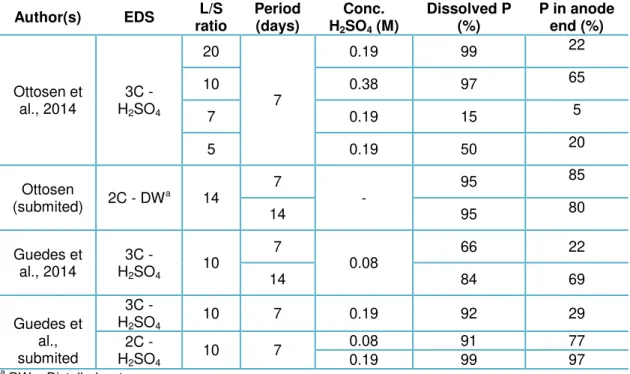
In Table 2.6 summarizes percentages of P dissolved and found in the anode end, reported in literature.
Table 2.6 Percentage of dissolved P and found in the anode end through EDS process of SSA, reported in literature.
Author(s) EDS L/S
ratio Period (day) Conc. H2SO4 (M) Dissolved P (%) P in anode end (%) Ebbers et al.,2015
2C - DWa
10
7
-
80 -
14 95 -
2C - H2SO4
7
0.19
93 -
14 96 -
3C - DWa
7
-
43 43
14 29 29
3C - H2SO4
7
0.19
90 49
14 95 50
a
25
a DW – Distelled waterEDS is a truly competitive method among the P recovery methods from SSA studied. However, as the other P recovery methods, EDS presents some concerns related to the costs of the procedure. The EDS involves consumption of acids and electricity (mainly pumps and stir), as shown in Table 2.7. The stirring was an improvement of the ED treatment (compared to treatment of a stationary matrix) made by Pedersen et al. (2003), allowing better removal efficiencies and faster treatment. However, in a full scale treatment stirring 24 hours per day could represent a significant consumption of energy.
The characteristics of the ashes used in the EDS can, as well, highly affect the costs of the procedure. Thinking in a full scale treatment, if ash characteristics significantly varied characterization of the ashes and EDS adjustments would have to be done regularly. Optimization of this process can allow to turn it more competitive, not only technically, but also economically. Furthermore, EDS process can be more viable as a full scale treatment.
Author(s) EDS L/S
ratio Period (days) Conc. H2SO4 (M) Dissolved P (%)
P in anode end (%)
Ottosen et al., 2014
3C - H2SO4
20
7
0.19 99 22
10 0.38 97 65
7 0.19 15 5
5 0.19 50 20
Ottosen
(submited) 2C - DW
a
14
7
-
95 85
14 95 80
Guedes et al., 2014
3C -
H2SO4 10
7
0.08
66 22
14 84 69
Guedes et al., submited
3C -
H2SO4 10 7 0.19 92 29
2C -
H2SO4 10 7
0.08 91 77
0.19 99 97
26
Table 2.7 Summary of advantages and disadvantages of P recovery methods from SSA.Method Advantages Disadvantages
Wet chemical process
P recovery of 60 – 100%1;
Relevant removal of heavy metals.
Formation of gypsum crystals; Acid consumption; Selectiviness2; Need of several
steps.
Dry thermal process
Separation of P from heavy metals in 1 step;
Relevant removal of heavy metals;
P recovery around 100%3.
Low lifetime of equipment;
Highly corrosive conditions.
EDS
Separation of P from heavy metals in 1 step;
P recovery of 77 – 96%4
Energy consumption; Acid consumption.
1
Range of values presented in Table 2.5;
2
Liquid-liquid extraction and sulfidic precipitation, procedures are only efficient in Fe-rich SSA, while in Al-rich SSA only sequential precipitation can be applied (Petzet et al., 2012);
3Value from Adam et al. (2008);