Grey Relational Analysis of Thin Wall Ductile
Iron Casting
Bharat Ashok Tare
P.G.Student, Textile and Engineering Institute, Ichalkaranji 416115, Maharashtra (India),
Vasudev D.Shinde
Professor, Textile and Engineering Institute, Ichalkaranji 416115, Maharashtra (India)
Abstract- Development of thin wall ductile iron is essential to permit designers for energy consuming equipment to choose the most appropriate material based on material properties, and not solely on weight or density. This paper analyzes various significant process parameters of the casting process. An attempt has been made to develop thin wall casting in order to obtain good mechanical properties.In the present work, ductile iron castings with varying thickness from 2 to 6mm were cast with suitable casting design to assure accurate mold filling. The process parameters considered are: Chemical composition (% Cu variations), Pouring Temperature, Type of inoculants and section thickness. The effect of selected process parameters and its levels on the Tensile Strength, Vickers hardness and percentage Elongation and the subsequent optimal settings of the parameters have been accomplished using Taguchi’s parameter design approach. The result indicates that the selected process parameters significantly affect the thin wall ductile iron castings. GRA is employed to search for grey relational grade (GRG), which can be used to describe the relationships among the factors and to determine the important factors that significantly influence some defined objectives. The estimation of the optimum performance characteristics of thin wall casting at the optimum levels of parameters is achieved by using grey relational analysis and the results are verified by confirming with practical experiments.
Keywords: Ductile iron, thin wall casting, Taguchi, grey relational analysis, optimization.
I. INTRODUCTION
To achieve fuel economy in automotive industry, reducing the vehicle weight has been a major thrust research area over the last few decades. Although the general trend has been to use low density materials (aluminum, magnesium and composites) instead of cast iron and steel in the automotive industry, numerous examples have been recently noted in the literature where iron castings started again to replace aluminum in this industry. Applications for ductile iron have increased steadily due to its relatively low production cost and ability to achieve a range of microstructures with different mechanical properties. In particular, there has been an increase in demand for thin-wall ductile iron castings to provide components with high strength-to-weight ratios [1]. The need to save weight in the automotive industry calls for development of lighter constructions. This can be achieved either by using lighter materials or by optimizing existing constructions so that they become lighter e.g. by reducing the wall thickness or removing superfluous material [2]. Thin-walled ductile cast iron has good mechanical properties and is more economical in production compared with many other materials. By geometrical optimization of the casting it can be favourable to replace traditionally light materials with thin-walled ductile cast iron [3].
When mechanical properties, density and cost are included in material evaluation, ductile iron may offer more advantages than aluminum, particularly if thin wall ductile iron parts could be produced without further heat treatment processes[4]. The potentials for ductile iron applications for lightweight automotive components have been limited by the capability to produce as-cast carbide free thin wall parts (2-3 mm) [5]. Production of thin-wall ductile iron castings still represents a daily challenge in modern foundries due to casting defect produced during casting process [6]. Review of the recent literature shows that thin-wall ductile iron has been successfully produced for many years, thanks to the optimization of some critical production parameters: pouring temperature, chemical composition and thermal conductivity of the molding materials, type and amount of inoculating material in combination [7].
to develop manufacturing systems that are robust or in sensitive to daily and seasonal variations of environment machine wear and other external factors [9]. His methods focus on the effective application of engineering strategies rather than advanced statistical techniques. It includes both upstream and shop-floor quality engineering. Upstream methods efficiently use small-scale experiments to reduce variability and cost-effective, robust designs for large scale production and market place. Shop-floor techniques provide cost-based, real time methods for monitoring and maintaining quality in production. The further upstream a quality method is applied, the greater leverages it produces on the improvement, and the more it reduces the cost and time. Taguchi proposes an “off-line” strategy for quality improvement in place of an attempt to inspect quality into a production the production line. He observes that poor quality cannot be improved by the process of inspection; screening and salvaging. No amount of inspection can put quality back into the product. Taguchi recommends a three-stage process: system design, parameter design and tolerance design [10]. Taguchi's method is focused on the effective application of engineering strategies rather than advanced statistical techniques. The primary goals of Taguchi method are [11]:
· A reduction in the variation of a product design to improve quality and lower the loss imparted to society.
· The proper product or process implementation strategy reduces the level of variation.
Taguchi method is used as tool for optimization of sand casting, process parameters of the castings manufactured in iron foundry by maximizing the signal to noise ratios and minimizing the noise factors. The process parameters considered are moisture, sand particle size, green compression strength, mould hardness, permeability, pouring temperature, pouring time and pressure test. The results indicated that the selected process parameters significantly affect the casting defects in the foundry [12].
Grey relational analysis (GRA) has been widely applied in analyzing multivariate series data as a solution to the traditional statistical limitations. GRA, which has been proven to be simple and accurate method for analysing relationship in multivariate series data and broadly used in various disciplines such as economics, sociology and engineering. GRA is employed to search for grey relational grade (GRG), which can be used to describe the relationships among the factors and to determine the important factors that significantly influence some defined objectives [13].
In the grey relational analysis, experimental results were first normalized and then the grey relational coefficient was calculated from the normalized experimental data to express the relationship between the desired and actual experimental data. Then, the grey relational grade was computed by averaging the grey relational coefficient corresponding to each process response. The overall evaluation of the multiple process responses is based on the grey relational grade. As a result, optimization of the complicated multiple process responses can be converted into optimization of a single grey relational grade. In other words, the grey relational grade can be treated as the overall evaluation of experimental data for the multi response process. Optimization of a factor is the level with the highest grey relational grade [14, 15]. In the present work Taguchi-Grey rational analysis (TGRA) is used for parameter design approach to study and optimize the effect of process parameters on the mechanical properties of thin wall ductile iron casting.
II. PROCESS PARAMETERS
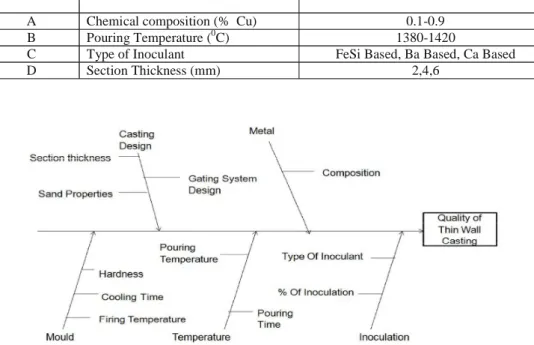
An Ishikawa diagram (cause and effect diagram) was constructed as shown in Figure 1 to identify the casting process parameters which influence quality of casting. The process parameters can be listed in five categories as follows:
· Mould machine related parameters
· Cast metal related parameters
· Casting design parameter
· Inoculation related parameters
· Temperature related parameters
Table-1 Process parameters with their ranges Parameter
designation
Process parameters
Range
A Chemical composition (% Cu) 0.1-0.9
B Pouring Temperature (0C) 1380-1420
C Type of Inoculant FeSi Based, Ba Based, Ca Based
D Section Thickness (mm) 2,4,6
Figure 1.Cause and effect diagram
III. SELECTION OF ORTHOGONAL ARRAY (OA)
For analysis of thin wall ductile iron casting, the four casting process parameters each at three levels have been selected (Table 2).The selection of a particular orthogonal array is based on the number of levels of various parameters. Now, the Degree of Freedom (DOF) can be calculated by using the equation as:
Where,
(DOF)R = degree’s of freedom P = number of parameters
L = number of levels of each parameter
Table-2 Taguchi L9 standard orthogonal array matrix
Expt. No Parameter 1 Parameter 2 Parameter 3 Parameter 4
E 1 1 1 1 1
E 2 1 2 2 2
E 3 1 3 3 3
E 4 2 1 2 3
E 5 2 2 3 1
E 6 2 3 1 2
E 7 3 1 3 2
E 8 3 2 1 3
E 9 3 3 2 1
Table-3 Response parameters and control parameters with levels
Response Parameter
Tensile Strength (N/mm2) Vickers Hardness (VN)
% Elongation Sr.
No. Control Parameters
Levels
1 2 3
1 Chemical Composition (%Cu) 0.1 0.4 0.9
2 Pouring Temperature (0C)
1420 1400 1380
3 Type of base Inoculant FeSi based Ba based Ca Baesd
4 Section Thickness (mm) 2 4 6
IV. EXPERIMENTAL WORK AND ANALYSIS
bottom covered with steel scrap. The tapping temperature of molten metal was 14650C. At this time the sample was taken from the melt for final chemical analysis. The treated iron was poured into furan resin shell molds bonded with epoxy resin and catalyst as shown in Figure 4. Similarly all melts were prepared with varying chemical composition, Pouring temperature, type of inoculants. The in-mould inoculation processing method is used for all the experimentation carried out in this work wherein the weighted amount of inoculant is placed at the bottom of the sprue well.
Table-4 Elemental analysis of three set of experiments Melt /
Elements
Chemical Composition (%)
C Si Mn S P Cr Cu Mg
A1 3.61 2.55 0.410 0.005 0.051 0.056 0.10 0.035
A2 3.60 2.47 0.407 0.009 0.045 0.024 0.40 0.048
A3 3.64 2.50 0.411 0.003 0.071 0.027 0.90 0.031
The tensile specimen is prepared according to the ASTM E8-04 standard; the final geometry is as below shown in Figure 5. Tensile test specimens were repapered from each step casting poured and tensile strength and elongation were measured using Universal Testing Machine as shown in Figure 6 (model- UNITEK 9450, max.capacity-50 KN, Make-Fuel Instruments & engineer’s pvt.ltd, Maharashtra, India) as per ASTM standard. The hardness test is taken on middle cut section of all the casting for respective thickness as shown in Figure. 7. Experiments were conducted as per L9 orthogonal array, assigning various values of the levels to the process parameters. The experimental results are shown in Table 5.
Figure 6.Tensile testing of casting Figure 7. Vickers Hardness testing
Table-5 Experimental Results
Expt. No.
Chemical Composition
%Cu
Pouring Temperature
(oC)
Type of Inoculant
Section Thickness
(mm)
Tensile Strength (N/mm2)
Hardness
(VN) %
elongation
1 0.1%Cu 1420 FeSi-Based 2 535 223 8.05
2 0.1%Cu 1400 Ba-Based 4 520 193 8.63
3 0.1%Cu 1380 Ca-Based 6 513 181 9.20
4 0.4%Cu 1420 Ba-Based 6 611 232 7.50
5 0.4%Cu 1400 Ca-Based 2 660 265 5.98
6 0.4%Cu 1380 FeSi-Based 4 653 253 6.90
7 0.9%Cu 1420 Ca-Based 4 705 285 2.63
8 0.9%Cu 1400 FeSi-Based 6 677 250 3.20
9 0.9%Cu 1380 Ba-Based 2 740 315 2.01
V. OPTIMIZATION USING GREY RELATIONAL ANALYSIS
The steps involved in Taguchi`s Grey Relational Analysis are:
1. The “Larger-the-better” is a characteristic of the original sequence, and it is used to compare levels in the GRA
2. The “smaller-the-better” is a characteristic of the original sequence, and it is used to compare levels in the GRA.
Table-6 S/N ratio with Normalized S/N ratio for conducted experiments Expt.
No.
S/N ratios Normalized S/N Ratios
Tensile
Strength Hardness Elongation
Tensile
Strength Hardness Elongation
1 54.567 46.966 18.793 0.115 0.377 0.963
2 54.320 45.711 18.720 0.037 0.116 0.958
3 54.202 45.154 19.276 0.000 0.000 1.000
4 55.721 47.310 16.922 0.477 0.448 0.822
5 56.391 48.465 15.534 0.688 0.688 0.717
6 56.298 48.062 16.777 0.659 0.604 0.811
7 56.964 49.097 8.399 0.868 0.819 0.177
8 56.612 47.959 9.832 0.757 0.583 0.285
9 57.385 49.966 6.064 1.000 1.000 0.000
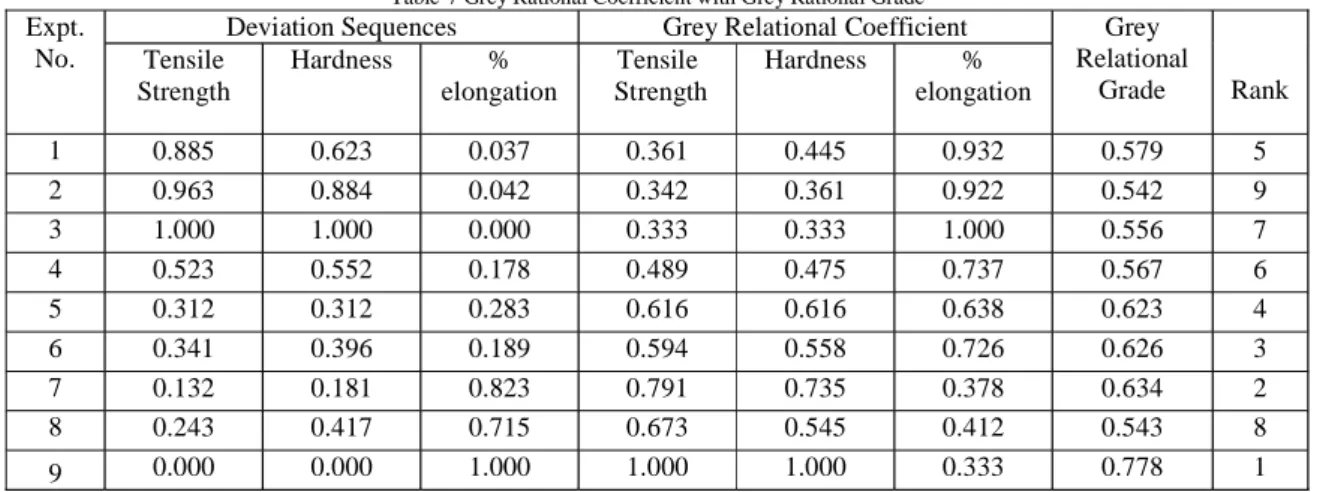
Step 2: Determination of deviation sequence: The deviation sequence is the absolute difference between
the reference sequence and the comparability sequence after normalization. It is determined using equation as shown below. The values of deviation sequence are shown in Table 7.
Step 3: Calculation of Grey Relational Coefficient (GRC): GRC for all the sequences expresses the relationship between the ideal (best) and actual normalized S/N ratio. If the two sequences agree at all points, and then their Grey relational coefficient is 1. The Grey relational coefficient can be expressed by equation as shown below. The values of GRC are shown in Table 7.
Where,
, , is the deviation sequence and
and for present study, is set as 0.5.
Step 4: Determination of Grey Relational Grade (GRG): The overall evaluation of the multiple performance characteristics is based on the Grey relational grade. The Grey relational grade is an average sum of the Grey relational coefficients, which can be calculated using equation as shown below. The values of GRG are shown in Table 7.
Table-7 Grey Rational Coefficient with Grey Rational Grade Expt.
No.
Deviation Sequences Grey Relational Coefficient Grey
Relational
Grade Rank
Tensile Strength
Hardness %
elongation
Tensile Strength
Hardness %
elongation
1 0.885 0.623 0.037 0.361 0.445 0.932 0.579 5
2 0.963 0.884 0.042 0.342 0.361 0.922 0.542 9
3 1.000 1.000 0.000 0.333 0.333 1.000 0.556 7
4 0.523 0.552 0.178 0.489 0.475 0.737 0.567 6
5 0.312 0.312 0.283 0.616 0.616 0.638 0.623 4
6 0.341 0.396 0.189 0.594 0.558 0.726 0.626 3
7 0.132 0.181 0.823 0.791 0.735 0.378 0.634 2
8 0.243 0.417 0.715 0.673 0.545 0.412 0.543 8
9 0.000 0.000 1.000 1.000 1.000 0.333 0.778 1
VI. RESULT AND DISCUSSION
The higher grey relational grade will have better multi response characteristics. With the help of Table 7, the optimal parameter combination was determined as A3 (Chemical composition % Cu), B3 (1380 0C) and C2 (Ba Based Inoculant), D1 (2mm Section Thickness)
Figure 8.Assigning Grey Relation Grade to experiments
Table-8 The Main Effects of the Factors on the Grey Relational Grade
Parameter Level 1 Level 2 Level 3 Max-Min Rank
Chemical Composition(% Cu) 0.559 0.605 0.652 0.093 2
Pouring Temperature 0.594 0.569 0.653 0.084 3
Type of inoculant 0.583 0.629 0.604 0.046 4
Section Thickness 0.660 0.601 0.555 0.105 1
The confirmation tests for the optimal parameters with its level were conducted to evaluate quality characteristics for development of thin wall casting. Table 7 shows highest grey relational grade, indicating the initial process parameter set of (A3B3C2D1) for the best multiple performance characteristics among the nine experiments. Table 9 shows the comparison of the experimental results for the optimal conditions (A3B3C2D1) with predicted results for optimal (A3B3C2D1) casting parameters. The predicted values were obtained by,
Predicted Response = Average of A3 + Average of B3 + Average of C2+ Average of D1 – (3 x overall Mean of response)
= (0.652+0.653+0.629+0.660)-(3 x 0.605) = 0.778
Finally, three confirmation experiments were conducted using the optimal process parameters (A3, B3, C2 and D1). The measured mean value at optimal parameters for Tensile Strength (N/mm2), Hardness (VN) and %elongation as shown in Table 9.
Table-9 Predicted and experimental values
Sr. No Machining characteristics Predicted Value Experimental value
1 Optimal parameter A3B3C2D1 A3B3C2D1
2 Tensile Strength(N/mm2) 740 742
3 Hardness(VN) 315 316
4 %elongation 2.01 2.09
5 Grey Relational Grade 0.778 0.783
VII. CONCLUSIONS
A TGRA was proposed to study the optimization of thin wall ductile iron casting process parameters. Tensile strength, ductility and Vickers hardness were selected as quality targets.Results indicated that the selected process parameters of casting significantly affect the selected mechanical properties. It also shows that the grey relational analysis tool can be effectively adopted for the analysis of physical processes to explain the relationships between various casting parameters.Also, the experiments give a clear picture of every process parameter contribution to the development of thin wall casting. Twenty-seven experimental runs based on OA were performed. The conclusions based on the single optimization and multi-optimization using TGRA are summarized as follows:
1. Using TGRA, Chemical composition, Pouring Temperature, type of inoculants and section thickness were optimized individually.
2. Using GRA, with optimal set A3B3C2D1 predicts the value 0.778 whereas the experimental value archived is 0.783.
3. The predicted results were checked with experimental results and a good agreement was found.
REFERENCES
[1] Javaid A. and Thomson J. Effect of microstructure on the mechanical properties of thin wall ductile iron castings. American Foundry Society Transactions 2001, 82(1), 1-18.
[2] Shinde V.D., Ravi B., Narasimhan K. Solidification behavior and mechanical properties of ductile iron castings with varying thickness. International Journal of Cast Metals Research 2012, 25 (6), 364-373.
[3] Shinde V.D., Ravi B. and Narasimhan K. Effect of Orientation, Thickness, and Composition on Properties of Ductile Iron Castings.
[4] Stefanescu D.M. and Ruxanda R. Lightweight iron castings-can they replace aluminum castings; In Proceedings of the 65th World Foundry Congress, Gyeongju, Korea, Oct 20-24, 2002.
[5] Fras E., Gorny M. and Kapturkiewicz W. Thin Wall Ductile Iron Castings: Technological Aspects. Archives of Foundry Engineering 2013, 13(1), 23-28.
[6] Labrecque C., Gange M. and Javaid A. Optimizing the mechanical properties of thin-wall ductile iron castings. American Foundry Society Transactions 2005, 116(5), 1-10.
[7] Jamkar S., Deshmukh M. And Vidhate N. Optimization of Green Sand Casting Process Parameter by Taguchi Method: A Review. International Journal of Mechanical Engineering 2004, 4(1), 1-7.
[8] Syrcos G. Die casting process optimization using Taguchi methods. Journal of Materials Processing Technology 2003,135(1), 68-74.
[9] Barua P., Kumar P. and Gaindhar J. Optimization of mechanical properties of V-process castings by Taguchi method. Indian Foundry
Journal 1997, 17-25.
[10] Upadhye R. and Keswani I. Optimization of Sand Casting Process Parameter Using Taguchi Method in Foundry. International Journal of Engineering Research & Technology 2012, 1(7), 1-7.
[11] Muthuramalingam T. and Mohan B. Taguchi- Grey Relational Based Multi Response Optimization of Electrical Process Parameters In Electrical Discharge Machining. Indian Journal of Engineering and Material Science 2013, 20, 471-475.
[12] Chang K. Grey-relational analysis based approach for data clustering”, IEEE Visual Image Signal Process 2005, Vol.152, 165-172. [13] Balasubramanian S. and Ganapathy S. Grey Relational Analysis to determine optimum process parameters for Wire Electro Discharge
Machining (WEDM). International Journal of engineering Science and Technology 2011, 3(1), 95-101.
[14] Raghuraman S., Panneerselvam T., Thiruppathi K. and Santosh S. Optimization of EDM Parameters using Taguchi Method and Grey Relational Analysis for Mild Steel IS 2026. International Journal of Innovative Research in Science 2013, Engineering and Technology, 2(7), 3095-3104.