ABSTRACT
Objective: To derive reference equations for spirometry in healthy Black adult never smokers in Brazil, comparing them with those published in 2007 for White adults in the country. Methods: The examinations followed the standards recommended by the Brazilian Thoracic Association, and the spirometers employed met the technical requirements set forth in the guidelines of the American Thoracic Society/European Respiratory Society. The lower limits were defi ned as the 5th percentile of the residuals. Results: Reference equations and limits were derived from a sample of 120 men and 124 women, inhabitants of eight Brazilian cities, all of whom were evaluated with a fl ow spirometer. The predicted values for FVC, FEV1, FEV1/FVC ratio, and PEF were better described by linear equations, whereas the fl ows were better described by logarithmic equations. The FEV1 and FVC reference values derived for Black adults were signifi cantly lower than were those previously derived for White adults, regardless of gender. Conclusions: The fact that the predicted spirometry values derived for the population of Black adults in Brazil were lower than those previously derived for White adults in the country justifi es the use of an equation specifi c to the former population.
Keywords: Spirometry; Reference values; African continental ancestry group.
Spirometry reference values for Black
adults in Brazil
Tarciane Aline Prata1,a, Eliane Mancuzo2,3,b, Carlos Alberto de Castro Pereira4,c,
Silvana Spíndola de Miranda2,d, Larissa Voss Sadigursky5,e, Camila Hirotsu6,f, Sérgio Tufi k6,g
Correspondence to:
Tarciane Aline Prata. Rua Piumí, 66/301, Cruzeiro, CEP 30310-080, Belo Horizonte, MG, Brasil.
Tel.: 55 31 98797-5978 or 55 31 2510-8859. E-mail: [email protected]
Financial support: This study received fi nancial support from the Brazilian Conselho Nacional de Desenvolvimento Científi co e Tecnológico (CNPq, National
Council for Scientifi c and Technological Development; Grant no. 310174/2014-7).
INTRODUCTION
Spirometry plays an essential role in the diagnosis and follow-up of respiratory diseases. The values obtained by spirometry should be compared with those predicted
for nonsmokers without cardiopulmonary disease.(1-3)
Reference equations for spirometry in White adults
in Brazil were derived in 2007.(4) The reference values
obtained by using those equations were found to
differ signifi cantly from those obtained by using other
equations.(5-7)
Several studies have shown that reference spirometric values (corrected for anthropometric characteristics) are lower in Black individuals than in White individuals, and
this has led to the recommendation that race-specifi c
equations be used.(3,7,8) Before spirometric reference
equations were available for use in Black individuals, reference values originally derived for White individuals
were used for Black individuals by applying an adjustment factor whereby the values for White individuals were reduced by 10-15%; however, the adjustment was found
to be inadequate.(9)
According to the 2015 Brazilian National Household Sample Survey, 45.11% of Brazilians described themselves as White (Caucasian); 45.06% described themselves as Brown (biracial); 8.86% described themselves as Black (African); 0.47% described themselves as Yellow (Asian);
and 0.38% described themselves as Red (Indigenous).(10)
In two studies conducted in Brazil, Black adults were studied in an attempt to obtain reference spirometric values, which were found to be similar to those for White
adults in the country.(11,12) All spirometry tests were
performed with spirometers that are currently obsolete.
(4,13) Race can be determined by genetic ancestry or
self-report. In a large study conducted in the USA and
1. Programa de Pós-Graduação das Ciências Aplicadas à Saúde do Adulto, Universidade Federal de Minas Gerais – UFMG – Belo Horizonte (MG) Brasil. 2. Departamento de Clínica Médica,
Faculdade de Medicina, Universidade Federal de Minas Gerais – UFMG – Belo Horizonte (MG) Brasil. 3. Laboratório de Função Pulmonar,
Hospital das Clínicas, Universidade Federal de Minas Gerais – UFMG – Belo Horizonte (MG) Brasil. 4. Centro Médico Brasil, Guarulhos (SP)
Brasil.
5. Laboratório de Função Pulmonar, Hospital Cárdio Pulmonar, Salvador (BA) Brasil. 6. Departamento de Psicobiologia,
Universidade Federal de São Paulo – UNIFESP – São Paulo (SP) Brasil. a. http://orcid.org/0000-0002-4765-2685 b. http://orcid.org/0000-0003-3891-875X c. http://orcid.org/0000-0002-0352-9589 d. http://orcid.org/0000-0001-7245-4472 e. http://orcid.org/0000-0002-5561-8794 f. http://orcid.org/0000-0002-6760-0663 g. http://orcid.org/0000-0002-4012-4951
Submitted: 13 March 2018. Accepted: 8 June 2018.
Study carried out under the auspices
of the Programa de Pós-Graduação em
Ciências Aplicadas à Saúde do Adulto, Universidade Federal de Minas Gerais –
involving individuals who identifi ed themselves as
African American, spirometric values (corrected for age, sex, and height) were found to be lower in those with
a higher percentage of African ancestry.(14) Similarly,
in a study involving a large cohort of individuals in Brazil followed from birth to age 30 years (at which time they underwent pulmonary function testing), FVC
and FEV1 (corrected for height and other factors) were
found to be lower in males and females with a higher
percentage of African ancestry.(15) Regardless of genetic
ancestry, anthropometric characteristics (in particular, a lower ratio of trunk length to standing height in Black individuals) and environmental factors (such as nutrition and socioeconomic status) can contribute to
these differences.(15-17)
The objective of the present study was to derive reference equations for spirometry in Black adults in Brazil and compare them with those published in 2007
for White adults in the country.(4)
METHODS
All data were collected under the auspices of the
Respire e Viva (Breathe and Live) program in the cities of São Paulo, Rio de Janeiro, Belo Horizonte, Porto Alegre, Curitiba, Santos, Brasília, and Recife, Brazil, in
2004 and in Salvador, Belo Horizonte, and a quilombo
(a community established by escaped or freed slaves) in the state of Minas Gerais, Brazil, in the 2015-2017 period.(4) All of the participants volunteered for the study,
in response to a verbal invitation or to advertisements placed in various locations. Initially, all participants completed an American Thoracic Society (ATS) Division of Lung Diseases respiratory questionnaire previously translated into Portuguese and validated for use in
Brazil.(18,19) Subsequently, they underwent testing at
designated facilities. The study project was approved by the local research ethics committee (Protocol no. CAAE 60844316.0.0000.5149).
The inclusion criteria were as follows:
• being over 20 years of age (for females) or over 25 years of age (for males), ages at which peak
FVC is achieved(20)
• having a body mass index (BMI) of 18-30 kg/m2
• having no significant respiratory symp-toms, as determined by the aforementioned
questionnaire(19)
• having had no lung disease (including the fl u)
in the last seven days
• having no history of respiratory disease potentially resulting in permanent pulmonary dysfunction, including tuberculosis, asthma, and thoracic
surgery, with asthma being defi ned as a lifetime
history of two or more episodes of wheezing relieved by bronchodilators
• having no history of physician-diagnosed heart disease
• not having been diagnosed with uncontrolled hypertension
• not having worked (for 1 year or more) in envi-ronments in which the concentration of dust was high and therefore posed a risk of lung disease • having never smoked
• having identifi ed themselves as Black (African)
and showing phenotypic characteristics (as determined by the investigators) such as skin color, eye color, hair color, hair texture, nose
shape, and lip shape(21)
The exclusion criteria were as follows: a history of pneumonia and hospitalization in the previous year; exposure to smoke from wood-burning stoves; exposure to cigarette smoke in the bedroom; and divergence between self-reported race and individual phenotypic characteristics (as determined by the investigators). Weight and height were measured with participants standing barefoot and wearing light clothing. Spirometry was performed with participants in a sitting position and wearing a nose clip, Multispiro spirometers (Creative Biomedics, San Clemente, CA, USA) being used in 2004 and Koko spirometers (Pulmonary Data Service Inc., Louisville, CO, USA) being used in the 2015-2017 period. All spirometers met the technical
requirements set forth in the ATS guidelines.(2) All
spirometry tests were performed in accordance with the standards and acceptability and reproducibility criteria proposed by the Brazilian Thoracic Association
(BTA)(1) and the ATS/European Respiratory Society.
(22) A back-extrapolated volume of < 0.15 L or 5% of
FVC (whichever was greater) was accepted. Peak fl ow
was used in order to assess the initial effort.(1) Debris,
condensed water vapor, or mucus deposition on the sensor can increase the pressure gradient and result
in high fl ows and volumes after integration (resistance error). Tests with peak fl ows above 14 L/s in males
and 11 L/s in females were excluded,(4) as were those
in which peak fl ow was low in comparison with FEV1,
indicating inadequate effort, i.e., an FEV1 (mL)/PEF (L/
min) ratio > 8.5 in males and > 8.8 in females. The aforementioned values are above the 99th percentile
found in the Respire e Viva (Breath and Live) study,
which was conducted in 2004 and included Black and White participants, 413 of whom were male and 447 of whom were female (unpublished data). In that study, in addition to the standard reproducibility
criteria for FEV1 and FVC (0.15 L), at least two peak
fl ow values lower than the highest value by 10% or
less were required.(4)
After the acceptability and reproducibility criteria
were met, the highest FVC, FEV1, and PEF values
were recorded. Expiratory fl ows were derived from
maneuvers with the highest sums of FVC and FEV1.(1,22)
All tests were performed by the investigators
themselves or by technicians certifi ed by the BTA.
lung function reference values should include more
than 100 males and 100 females.(23)
Statistical analysis was performed with the IBM SPSS Statistics software package, version 22.0 (IBM Corporation, Armonk, NY, USA). All calculations were
performed in accordance with Pereira et al.(4) The
lower limits of the regressions were estimated by the 5th percentile of the nonstandardized residuals. The spirometric and anthropometric data obtained in São Paulo, Belo Horizonte, and Rio de Janeiro were
compared by ANOVA, and the infl uence of location
(if any) on spirometric variables was determined by analysis of covariance.
The differences between the predicted spirometry values derived for White adults in Brazil in 2007 and those derived for Black adults in the present study were plotted against the former values. The paired Student’s t-test was used in order to compare the means. Given the multiple comparisons, the level of
signifi cance was set at α < 0.01.
RESULTS
Of the 264 Black adults who underwent spirometry, 244 (124 women and 120 men) were included in the
fi nal analysis. A total of 11 women and 9 men were
excluded because of discrepant FVC/height2 values
or because of submaximal initial efforts. Data on the study participants were collected in the following locations: São Paulo (n = 88); Belo Horizonte plus a
quilombo in the state of Minas Gerais (n = 83); Rio de Janeiro (n = 52); Salvador (n = 10); other cities in Brazil (n = 11). Table 1 shows anthropometric data for the study participants, by sex. Males ranged in age from 26 years to 82 years, whereas females ranged in age from 20 years to 83 years. The median height was 171 cm (range, 151-187 cm) in males and 158 cm (range, 145-175 cm) in females.
Table 2 shows spirometric data (means ± standard deviations) for the study participants, by sex. ANOVA showed that FVC in females was lower in Belo Horizonte than in São Paulo and Rio de Janeiro. However, analysis of covariance (with age and height as covariates)
showed that the difference was not signifi cant. The
mean age of females was highest in Belo Horizonte (56 ± 17 years vs. 43 ± 14 years; p < 0.01).
The predicted values for FEV1, FVC, FEV1/FVC, and PEF
were better described by linear equations, whereas the
fl ows were better described by logarithmic equations.
Prediction equations for males and females are shown in Table 3 and Table 4, respectively. Weight played no relevant role in any of the reference equations.
The coeffi cients of determination (r2) were generally
similar between males and females, being higher for
FVC and FEV1 than for expiratory fl ows. With regard
to the fl ows, r2 values were highest for FEF
75%. With
regard to age, FEV1 decreased on average 24 mL per
year in males and 17 mL per year in females.
The lower limit for the FEV1/FVC ratio in Black adults
in Brazil was determined by subtracting 9 from the predicted value for males (Table 3) and 8 from the
predicted value for females (Table 4).(24,25) Values below
70% were observed among males over 60 years of age and females over 65 years of age.
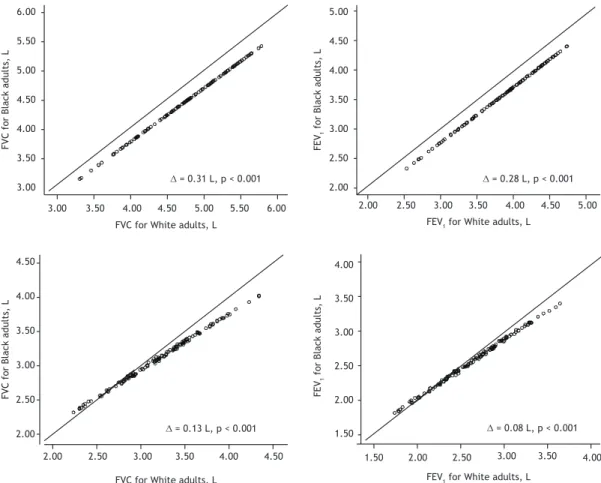
Figure 1 shows a comparison of the FVC and FEV1
values derived for White adults in Brazil in 2007(4)
with those derived for Black adults in Brazil in the
present study. The predicted values for FVC and FEV1
were consistently lower in Black individuals than in White individuals, regardless of sex. In males, FVC was on average 0.30 L lower in Black individuals
than in White individuals, FEV1 being 0.28 L lower in
the former than in the latter (p < 0.001 for both). In females, FVC was on average 0.14 L lower in Black
individuals than in White individuals, FEV1 being 0.11
L lower in the former than in the latter (p < 0.001 for both). The differences between the predicted values for White individuals and those for Black individuals were
Table 2. Spirometric data for the study participants, by sex.a
Variable Males Females
(n = 120) (n = 124)
FVC, L 4.42 ± 0.78 3.10 ± 0.52
FEV1, L 3.55 ± 0.69 2.55 ± 0.48 FEV1/FVC, % 80.3 ± 5.4 82.0 ± 5.4
FEF25-75%, L/sb 3.54 ± 1.17 2.77 ± 0.93
FEF50%, L/sb 4.39 ± 1.36 3.54 ± 1.06
FEF75%, L/sb 1.43 ± 0.63 1.11 ± 0.52
PEF, L/s 9.77 ± 2.07 6.73 ± 1.28
aValues expressed as mean ± SD, except where
otherwise indicated. bValues expressed as mean ±
logarithmic SD.
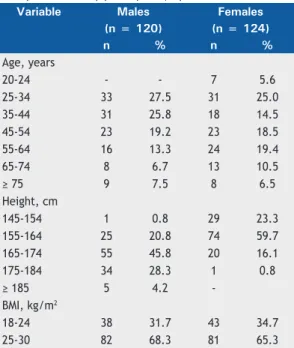
T able 1. Anthropometric data (age, height, and body mass index) for the study participants, by sex.
Variable Males Females
(n = 120) (n = 124)
n % n %
Age, years
20-24 - - 7 5.6
25-34 33 27.5 31 25.0
35-44 31 25.8 18 14.5
45-54 23 19.2 23 18.5
55-64 16 13.3 24 19.4
65-74 8 6.7 13 10.5
≥ 75 9 7.5 8 6.5
Height, cm
145-154 1 0.8 29 23.3
155-164 25 20.8 74 59.7
165-174 55 45.8 20 16.1
175-184 34 28.3 1 0.8
≥ 185 5 4.2
-BMI, kg/m2
18-24 38 31.7 43 34.7
25-30 82 68.3 81 65.3
Figure 1. Differences between the FVC, FEV1, and FEV1/FVC% values predicted for White adults by Pereira et al.
(4) and
those predicted for Black males (above) and females (below).
found to increase as the predicted values increased.
A signifi cant positive correlation was found between
height and FVC in males and females (r = 0.93 and r = 8.88, respectively; p < 0.001 for both).
The paired Student’s t-test showed that the FEV1/FVC
ratio was higher in White males than in Black males, albeit only 1.0% higher on average (p = 0.021). In
females, the FEV1/FVC ratio was similar between White
FVC for Black adults, L 2.00
.40
.30
.20
.10
.00
-.10
-.20
3.00 4.00 5.00 6.00 7.00
FVC for White
adults − FVC for
Black adults, L
x difference (bias) = 0.30, p < 0.001 Bias
2.00 .40
.30
.20
.10
.00
-.10
3.00 4.00 5.00 6.00 FEV1 for Black adults, L
x difference (bias) = 0.28, p < 0.001 Bias
FEV
1
for White
ad
ults −
FEV
1
for Black
adults, L
1.00 .30
.20
.10
.00
-.10
-.20
-.30
1.50 2.00 2.50 3.00 3.50 4.00 x difference (bias) =
0.11, p < 0.001 Bias
75.00 2.00
1.00
.00
-1.00
-2.00
77.50 80.00 82.50 85.0087.50
FEV
1
/FVC ×
100
for White
adults −
FEV
1
/FVC ×
100
for Black
ad
ults
FVC for White
adults − FVC for
Black adults, L
FEV1/FVC × 100 for White adults
FVC for Black adults, L FEV1 for Black adults, L FEV1/FVC × 100 for White adults x difference (bias) =
1.00, p = 0.02 Bias
3.00
2.00
1.00
.00
-1.00
-2.00
-3.00
77.5080.00 82.5085.0087.50 x difference (bias) =
0.13, p = 0.12 Bias
1.00 .40
.20
.00
-.20
-.40
2.00 3.00 4.00 5.00 x difference (bias) =
0.14. p < 0.001 Bias
FEV
1
for White
ad
ults −
FEV
1
for Black
adults, L
FEV
1
/FVC ×
100
for White
adults −
FEV
1
/FVC ×
100
for Black
ad
ults
Table 4. Regression equations, coeffi cient of determination (r2), and lower limits for spirometric variables in Black females.
Type of equation Height coefficient Age coefficient Constant r2 Lower limit
Linear
FVC, L 0.035 −0.013 −1.83 0.47 P − 0.66
FEV1, L 0.025 −0.017 −0.69 0.56 P − 0.55
FEV1/FVC, % −0.074 −0.200 103.2 0.33 P − 7.8
PEF, L/s − −0.029 8.134 0.14 P− 1.77
Logarithmic
FEF25−75%, L/s − −0.625 3.32 0.37 P × 0.63
FEF50%, L/s − −0.436 2.862 0.23 P × 0.61
FEF75%, L/s − −1.01 3.805 0.50 P × 0.54
P: predicted. Linear equations: height × coeffi cient – age × coeffi cient ± constant.
Logarithmic equations: natural log(log height × coeffi cient – log age × coeffi cient ± constant).
Table 3. Regression equations, coeffi cient of determination (r2), and lower limits for spirometric variables in Black males.
Type of equation Height coefficient Age coefficient Constant r2 Lower limit
Linear
FVC, l 0.048 −0.019 −2.931 0.52 P − 0.78
FEV1, l 0.033 −0.024 −0.989 0.57 P − 0.76
FEV1/FVC, % −0.134 −0.189 112.0 0.26 P − 8.70
PEF, L/s 0.059 −0.048 1.903 0.24 P − 2.67
Logarithmic
FEF25-75%, L/s − −0.670 3.735 0.42 P × 0.62
FEF50%, L/s − −0.517 3.383 0.30 P × 0.62
FEF75%, L/s − −0.956 3.872 0.50 P × 0.57
P: predicted. Linear equations: height × coeffi cient − age × coeffi cient ± constant. Example: FVC = height × 0.048 − age × 0.019 − 2.931 Logarithmic equations: natural log (log height × coeffi cient – log age × coeffi cient ± constant). Example: FEF
25-75%
individuals and Black individuals (p = 0.12). There
was no signifi cant correlation between the difference
in FEV1/FVC between White and Black individuals and
age in males or females.
When the predicted values for White and Black individuals were plotted, the percentage difference was
found to be proportional for FVC and FEV1 (~6.5%; p
< 0.01) in males but not in females (Figure 2).
DISCUSSION
To our knowledge, the present study is the fi rst
multicenter study in Brazil to derive reference equations for spirometry in Black adults by including a representative sample of volunteers and using
spirometers meeting the ATS criteria.(2) A comparison
between the equations derived for Black adults in the present study and those derived for White adults in
2007(4) showed a disproportionate difference between
the two regarding FVC and FEV1 in females, indicating
the need for an equation specific to the former population and the inappropriateness of applying a correction factor to values originally derived for White
individuals.(9) Although the differences between the two
groups of equations regarding FVC and FEV1 in males
were proportional, they were lower than reported in the literature.(9)
Studies aimed at deriving lung function reference values should include only nonsmokers without respiratory symptoms or cardiopulmonary disease. To that end, a previously validated respiratory epidemiology questionnaire should be used. If all of the aforementioned criteria are met, it is valid to use
volunteers to establish reference values.(18,26,27)
Reference values should not be extrapolated to age groups or patient heights other than those included
in the regression equations.(1) Our study sample was
representative of Black adults in Brazil because males and females of varying heights and ages were included in the study. The oldest males and females meeting the criteria for inclusion in the present study were 82 years old and 83 years old, respectively.
The number of participants over 65 years of age was
low in the present study because it is diffi cult to fi nd
healthy 65-year-old individuals meeting the inclusion
criteria.(4) With regard to participant height, there
was no difference between the present study and the
study published in 2007.(4) The median height of the
individuals who participated in the present study was found to be similar to that of those in the Brazilian population: 170.5 cm vs. 171 cm in males and 158
cm vs. 159 cm in females.(28) The negative correlation
between the FEV1/FVC ratio and height in the present
study was due to increased expiratory muscle strength
Figure 2. Comparisons between the FVC and FEV1 values predicted for White adults by Pereira et al.
(4) and those
predicted for Black males (above) and females (below).
6.00
5.50
5.00
4.50
4.00
3.50
3.00
FVC for Black
adults, L
= 0.31 L, p < 0.001
∇
3.00 3.50 4.00 4.50 5.00 5.50 6.00
FVC for White adults, L
4.50
4.00
3.50
3.00
2.50
2.00
FVC for Black
adults, L
= 0.13 L, p < 0.001
∇
2.00 2.50 3.00 3.50 4.00 4.50
FVC for White adults, L
4.00
3.50
3.00
2.50
2.00
1.50 = 0.08 L, p < 0.001
∇
1.50 2.00 2.50 3.00 3.50 4.00
5.00
4.50
4.00
3.50
3.00
2.50
2.00
FEV
1
for Black
adults, L
FEV
1
for Black
adults, L
= 0.28 L, p < 0.001
∇
2.00 2.50 3.00 3.50 4.00 4.50 5.00
FEV1 for White adults, L
and, consequently, airway compression.(1) Individuals
with a BMI > 30 kg/m2 were not included, the effect of
obesity on lung volumes therefore being excluded.(29)
The process of building a regression model involves several steps, and, because of their simplicity, linear equations should be preferred whenever the adjustment is similar to other models. As occurred in the study in which reference equations were derived for White
adults in Brazil,(4) the fl ow equations derived in the
present study followed a logarithmic curve, the lower
limit therefore being a fi xed percentage of the predicted value, with sensitivity for detecting airfl ow obstruction.
(4) In the present study, FEF
75% was found to have the
highest coeffi cient of determination with anthropometric data, a fi nding that is of particular interest and is
consistent with those of the aforementioned study.(4)
Approximately 10% of the White individuals included
in the aforementioned study(4) were obese; nevertheless,
FVC and FEV1 were lower in the present study than
in that study.(4)
It has long been recognized that lung function values are lower in Black adults than in White adults, although the FEV1/FVC ratio is similar.(7,8,16,30-32) These fi ndings
have been confi rmed in studies employing genetic
ancestry to determine race.(14,15)
Studies conducted in Brazil and establishing a relationship between self-reported skin color and
genetic ancestry have shown confl icting results. In a
study conducted by Menezes et al.,(15) a good correlation
was found between self-reported skin color and genetic ancestry. Similar results were obtained in an unpublished study involving 137 individuals recruited in São Paulo. However, in another study conducted in Brazil, no correlation was found between self-reported
race and genetic ancestry.(33) In individual cases, the
apparent race and genetically determined race can be widely divergent. In addition, genetic ancestry testing
is not without limitations.(34)
The difference in lung function across races has been attributed in part to anthropometric factors, including a lower ratio of trunk length to standing height (Cormic
index) in Black individuals.(15,16,32,35) The aforementioned
ratio decreases as height increases, thus explaining why the difference in lung function between Black and
White individuals increases as height increases. (36) Other
explanations include socioeconomic and environmental factors, which are closely related to race in several
countries, including Brazil.(35,37) However, in a study
conducted in the USA and in the study by Menezes
et al.,(5,15) socioeconomic and environmental factors
were found to have only a minor infl uence on lung
function. Anthropometric factors, socioeconomic conditions, and other indicators explain in part the
difference in spirometric values across races.(17) Lung
function is determined by several genes, and extensive genetic mapping combined with determination of race
(ancestry) might refi ne predicted lung function values
beyond anthropometric measures.(38)
Unlike our study, two studies involving Black adults in Brazil found no differences between the predicted spirometry values derived for Black adults and those
derived for White adults.(11,12) Scalambrini et al.(11)
studied 139 Black men and 56 Black women and compared the obtained values with those obtained in a parallel study involving White individuals (334 men and
141 women),(37) both studies having been conducted
in the 1990s and having employed a Vitalograph spirometer (Vitalograph, Buckingham, UK). Race was determined by the investigators. In an unpublished review of the data from the two aforementioned
studies,(11,37) FVC was found to be signifi cantly lower
in Black males and females.
Rufi no et al.(12) derived predicted values from a sample
of 146 male volunteers and 242 female volunteers in the state of Rio de Janeiro, Brazil. Race was self-reported. Although there were no apparent differences between
Black and White individuals regarding FVC or FEV1, the
data were raw and not corrected for age or height. The fact that a single bellows spirometer (Vitalograph) was used during the 4-year study period explains why FVC values were on average 0.5 L lower than those found
by Pereira et al.(4) Because of accumulation of debris
and humidity (and because cleaning is impossible), the compliance of the spirometer bellows decreases with repeated use, and this can lead to an underestimation
of the parameter values.(4,13)
The present study has some limitations that should be noted. Sitting height and socioeconomic status were not assessed. Had they been assessed, the differences
in FVC and FEV1 between Black and White individuals
might have been less dramatic.(16) The number of
individuals over 80 years of age was small. Women taller than 175 cm were not represented.
In conclusion, the predicted spirometry values obtained in the present study were derived from a large sample of Black adults in Brazil. The fact that the predicted spirometry values derived for the population of Black adults in Brazil were lower than those previously derived
for White adults in the country(4) justifi es the use of
equations specifi c to the former population.
REFERENCES
1. Sociedade Brasileira de Pneumologia e Tisiologia. Diretrizes para
Testes de Função Pulmonar. J Pneumol. 2002;28(Suppl 3):S1-S238.
2. Lung function testing: selection of reference values and interpretative strategies. American Thoracic Society. Am Rev Respir
Dis. 1991;144(5):1202-18. https://doi.org/10.1164/ajrccm/144.5.1202
3. Pellegrino R, Viegi G, Brusasco V, Crapo RO, Burgos F, Casaburi R, et al. Interpretative strategies for lung function tests. Eur Respir J.
2005;26(5):948-68. https://doi.org/10.1183/09031936.05.00035205
4. Pereira CA, Sato T, Rodrigues SC. New reference values for forced
2007;33(4):397-406. https://doi.org/10.1590/S1806-37132007000400008
5. Duarte AA, Pereira CA, Rodrigues SC. Validation of new brazilian predicted values for forced spirometry in caucasians and comparison with predicted values obtained using other reference equations. J
Bras Pneumol. 2007;33(5):527-35. https://doi.org/10.1590/S1806-37132007000500007
6. Pereira CA, Duarte AA, Gimenez A, Soares MR. Comparison between reference values for FVC, FEV1, and FEV1/FVC ratio in White adults in Brazil and those suggested by the Global Lung Function Initiative
2012. J Bras Pneumol. 2014;40(4):397-402. https://doi.org/10.1590/
S1806-37132014000400007
7. Hankinson JL, Odencrantz JR, Fedan KB. Spirometric reference values from a sample of the general U.S. population. Am J Respir
Crit Care Med. 1999;159(1):179-87. https://doi.org/10.1164/ ajrccm.159.1.9712108
8. Quanjer PH, Stanojevic S, Cole TJ, Baur X, Hall GL, Culver BH, et al. Multi-ethnic reference values for spirometry for the 3-95-yr
age range: the global lung function 2012 equations. Eur Respir J.
2012;40(6):1324-43. https://doi.org/10.1183/09031936.00080312
9. Scanlon PD, Shriver MD. “Race correction” in pulmonary-function
testing. N Engl J Med. 2010;363(4):385-6. https://doi.org/10.1056/ NEJMe1005902
10. Instituto Brasileiro de Geografi a e Estatística [homepage on the Internet]. Rio de Janeiro: IBGE; [cited 2017 Sep 16]. Pesquisa das Características Étnico-Raciais da População – PCERP. Available
from: https://www.ibge.gov.br/estatisticas-novoportal/sociais/
populacao/9372-caracteristicas-etnico-raciais-da-populacao.
html?=&t=o-que-e
11. Scalambrini Costa F, Scueiri CEB, Silva Jr JW, Pereira CAC, Nakatani J. Valores de referência para espirometria em uma amostra da
população brasileira adulta da raça negra. J Pneumol.
1996;22:165-70.
12. Rufi no R, Costa CH, Lopes AJ, Maiworm AI, Maynard K, Silva LM, et al. Spirometry reference values in the Brazilian population. Braz
J Med Biol Res. 2017;50(3):e5700. https://doi.org/10.1590/1414-431x20175700
13. Louw SJ, Goldin JG, Joubert G. Spirometry of healthy adult South
African men. Part I. Normative values. S Afr Med J. 1996;86(7):814-9.
14. Kumar R, Seibold MA, Aldrich MC, Williams LK, Reiner AP, Colangelo L, et al. Genetic ancestry in lung-function predictions. N Engl J Med.
2010;363(4):321-30. https://doi.org/10.1056/NEJMoa0907897
15. Menezes AM, Wehrmeister FC, Hartwig FP, Perez-Padilla R, Gigante DP, Barros FC, et al. African ancestry, lung function and
the effect of genetics. Eur Respir J. 2015;45(6):1582-9. https://doi. org/10.1183/09031936.00112114
16. Harik-Khan RI, Fleg JL, Muller DC, Wise RA. The effect of anthropometric and socioeconomic factors on the racial difference
in lung function. Am J Respir Crit Care Med. 2001;164(9):1647-54. https://doi.org/10.1164/ajrccm.164.9.2106075
17. Braun L, Wolfgang M, Dickersin K. Defi ning race/ethnicity and explaining difference in research studies on lung function. Eur Respir
J. 2013;41(6):1362-70. https://doi.org/10.1183/09031936.00091612
18. Ferris BG. Epidemiology Standardization Project (American Thoracic
Society). Am Rev Respir Dis. 1978;118(6 Pt 2):1-120.
19. Aguiar VA, Beppu OS, Romaldini H, Ratto OR, Nakatani J. Validade
de um questionário respiratório modifi cado (ATS-DLD-78) como instrumento de um estudo epidemiológico em nosso meio. J Pneumol. 1988;14(3):111-6.
20. Burrows B, Cline MG, Knudson RJ, Taunig LM, Lebowitz MD. A descriptive analysis of the growth and decline of the FVC and FEV1.
Chest. 1983;83(5):717-24. https://doi.org/10.1378/chest.83.5.717
21. Parra FC, Amado RC, Lambertucci JR, Rocha J, Antunes CM, Pena SD. Color and genomic ancestry in Brazilians. Proc Natl Acad Sci U
S A. 2003;100(1):177-82. https://doi.org/10.1073/pnas.0126614100
22. Miller MR, Hankinson J, Brusasco V, Burgos F, Casaburi R, Coates A,
et al. Standardisation of spirometry. Eur Respir J. 2005;26(2):319-38. https://doi.org/10.1183/09031936.05.00034805
23. Stocks J, Quanjer PH. Reference values for residual volume, functional residual capacity and total lung capacity. ATS Workshop
on Lung Volume Measurements. Offi cial Statement of The European Respiratory Society. Eur Respir J. 1995;8(3):492-506. https://doi.org/ 10.1183/09031936.95.08030492
24. Miller A, Thornton JC. The interpretation of spirometric measurements
in epidemiologic surveys. Environ Res. 1980;23(2):444-68.
25. Miller MR, Pincock AC. Predicted values: how should we use them?
Thorax. 1988;43(4):265-7.
26. Marsh S, Aldington S, Williams M, Weatherall M, Shirtcliffe P, McNaughton A, et al. Complete reference ranges for pulmonary function tests from a single New Zealand population. N Z Med J.
2006;119(1244):U2281.
27. Gräsbeck R. The evolution of the reference value concept. Clin Chem
Lab Med. 2004;42(7):692-7. https://doi.org/10.1515/CCLM.2004.118
28. Instituto Brasileiro de Geografi a e Estatística (IBGE). Sistema IBGE de Recuperação Automática [homepage on the Internet]. Rio de Janeiro: IBGE; [cited 2017 Sep 16]. Tabela 2645--Estimativas populacionais das medianas de altura e peso das crianças, adolescentes e adultos, por sexo, situação do domicílio e idade--Brasil e Grande Regiões. Available from: https://sidra.ibge.gov.br/tabela/2645
29. Melo LC, Silva MA, Calles AC. Obesity and lung function: a
systematic review. Einstein (Sao Paulo). 2014;12(1):120-5. https:// doi.org/10.1590/S1679-45082014RW2691
30. Burney PG, Hooper RL. The use of ethnically specifi c norms for
ventilatory function in African-American and white populations. Int
J Epidemiol. 2012;41(3):782-90. https://doi.org/10.1093/ije/dys011
31. Glindmeyer HW, Lefante JJ, McColloster C, Jones RN, Weill H. Blue-collar normative spirometric values for Caucasian and
African-American men and women aged 18 to 65. Am J Respir Crit Care Med. 1995;151(2 Pt 1):412-22. https://doi.org/10.1164/ ajrccm.151.2.7842200
32. Hsu KH, Jenkins DE, Hsi BP, Bourhofer E, Thompson V, Tanakawa N, et al. Ventilatory functions of normal children and young adults--Mexican-American, white, and black. I. Spirometry. J Pediatr.
1979;95(1):14-23. https://doi.org/10.1016/S0022-3476(79)80075-X
33. Pimenta JR, Zuccherato LW, Debes AA, Maselli L, Soares RP, Moura-Neto RS, et al. Color and genomic ancestry in Brazilians: a
study with forensic microsatellites. Hum Hered. 2006;62(4):190-5. https://doi.org/10.1159/000096872
34. Bolnick DA, Fullwiley D, Duster T, Cooper RS, Fujimura JH, Kahn J, et al. Genetics. The science and business of genetic ancestry
testing. Science. 2007;318(5849):399-400. https://doi.org/10.1126/ science.1150098
35. Goldin JG, Louw SJ, Joubert G. Spirometry of healthy adult South African men. Part II. Interrelationship between socio-environmental factors and ‘race’ as determinants of spirometry. S Afr Med J.
1996;86(7):820-6.
36. Bardeen CR. General relations of sitting height to stature and of sitting
height and stature to weight. Am J Phys Anthropol.
1923;6(4):355-88. https://doi.org/10.1002/ajpa.1330060403
37. Instituto Brasileiro de Geografi a e Estatística (IBGE) [homepage on
the Internet]. Rio de Janeiro: IBGE; [cited 2017 Sep 16]. Síntese de indicadores sociais: uma análise das condições de vida da população brasileira 2016. [Adobe Acrobat document, 141p.]. Available from: https://biblioteca.ibge.gov.br/visualizacao/livros/liv98965.pdf
38. Ortega VE, Kumar R. The Effect of Ancestry and Genetic Variation on Lung Function Predictions: What Is “Normal” Lung Function in Diverse Human Populations? Curr Allergy Asthma Rep.