A Work project, presented as part of the requirements for the Award of a Master’s degree in Economics from the Nova School of Business and Economics.
Electronic Voting, Turnout, and Voter Self-Selection:
Evidence from a Quasi-Natural Experiment
MARIA MARGARIDA SEQUEIRA DE PAIVA MARTINS DA SILVA 23859
Work project carried out under the supervision of: Professor José Albuquerque Tavares
João Pereira dos Santos
1
Electronic Voting, Turnout, and Voter Self-Selection: Evidence
from a Quasi-Natural Experiment
We take advantage of a quasi-natural experiment in Évora, Portugal, to evaluate the impact of electronic voting on the 2019 European election results. We rely on difference-in-differences estimations, with control groups chosen by matching methods, and find that the turnout rate decreases by 2 percentage points, a decline mostly explained by the decrease of the Communist Party’s vote share. Socio-economic characteristics of these voters, including higher age, and lower education and income levels, may explain the results. We performed an on-site and online questionnaire, and find that those participating, mostly highly educated, were for the most part aware of and shared a positive view of the electronic voting procedure, described as ‘easy’ and ‘effective’.
Keywords: Electronic voting; turnout; European Elections
I would like to express my deepest gratitude to my supervisors Professor s José Tavares and João Pereira dos Santos for their exceptional guidance. I would also like to thank Professors from University of Évora for answering and sharing the questionnaire, especially but not only to Professor Isabel Vieira. Last but not least, comments by Professor Hélia Marreiros, regarding the questionnaire, were also sincerely appreciated. All errors are the responsibility of the author.
2 1. Introduction
Modern democracies face the challenge of low electoral participation (Wattenberg 2002; Blais and Rubenson 2013). If elections exist to establish a parliament that represents the people, lower turnout rates may lead to biased and unequal political influence, when compared to the full electorate (Lijphart 1997). To tackle this issue, policy makers have attempted several approaches, one being electronic voting. There are two types of electronic voting: internet voting and presential voting. In the first method, in place in countries such as Estonia (Alvarez, Hall and Trechsel 2009), citizens vote remotely, using a computer and internet. In the second method, in current use in the United States and Brazil (Avgerou et al. 2009; Dee 2007; Card and Moretti 2007), citizens still have to go to the polling station, but they vote through an electronic voting machine (EVM). One of the advantages of presential electronic voting is a shorter time to know the electoral results and, when combined with the possibility of voting in any polling station, a lower cost for the citizens who are away from their place of registration, which may encourage turnout.
In this paper, we take advantage of a quasi-experiment that took place in Évora, Portugal, on the 2019 European election, and conduct a differences-in-differences estimation to assess the impact of optional electronic voting on turnout rate. With the expectation of an increase on representation of far-right parties, typically with contrary values to the European Union, and its closeness to the national elections, the 2019 European election was of a higher importance. Traditionally with low electoral participation, there was an urgent call for ideas in order to boost turnout, such as electronic voting. However, in the particular case of the experiment, citizens still had to go the polling station, meaning there was no significant decrease on the cost of voting. When we compare Évora with two contiguous districts of the same region, Portalegre and Beja, we do not find evidence of any change in turnout rates. However, when using matching methods to have a similar control group with the treated
3 district, we find evidence that turnout rates decreased, on average, by about 2 percentage points in our treated district, ceteris paribus. A question of great interest, given the nature of electronic voting and the similar cost for voters, is assessing whether people vote differently across the two voting methods. We establish that CDU, dominated by the Portuguese Communist Party (PCP), sees their votes share consistently decrease by 2 percentage points, on average, when we compare Évora with the matched control group. PCP voters tend to be older, with a lower level of education and from lower socio-economic class, indicating electronic voting could have scared this population group, as suggested in existing literature.
To further explore the results, we conducted an online and on-site survey in Évora, gathering 316 valid answers. 89% of voters were aware of the electronic voting option, in a sample of highly educated people. Moreover, it was found that when narrowing the sample to the citizens who used electronic voting and gave a positive feedback, the percentage of people with higher education increases. Similarly, there are less retired and old people and consequently more youngers. Both results are consistent with the decrease of CDU’s vote share and its voters’ profile. Additionally, electronic voting was perceived as ‘easy’, effective’ and ‘simple’. In fact, when asked whether they found electronic voting difficult, 98% felt it was easy.
2. Literature Review
Turnout is decreasing in most elections in developed democracies (Wattenberg 2002; Blais and Rubenson 2013). Indeed, several studies have been done to understand the rationale behind voting behaviour and the sources of the negative trend of turnout (Blais and Rubenson 2013). In Canada, Blais et al. (2004) concluded that propensity to vote decreased in all age groups, because not only were youngers not interested in politics, but also because they do not see voting as a moral obligation. Furthermore, both socioeconomic characteristics of parents and political resources determine whether new eligible youngers become habitual voters or
4 not, at least at the beginning (Plutzer 2002). These two factors together might explain the negative trend of turnout, considering its dynamics. Focusing on European elections, Reif and Schmitt (1980) strike that these elections are of ‘second-order’, implying a lower importance compared to the national elections, which could explain the lower turnout rates.
In an attempt to reverse the negative trend, policymakers are trying new measures, although some with not the desired results: by way of example, Germann and Serdült (2017) studied the impact of internet voting introduced in two Swiss municipalities, Geneva and Zurich, and found out that there was a negative effect on electoral participation, although not statistically significant. Contrarily, positive innovations include Election Day vote centres in the USA (Stein and Vonnahme 2008). In Australia, a country with turnout rate around 90%, there is compulsory voting, with a fine if citizens do not vote (Malkopoulou 2009).
Focusing on electronic voting, Allers and Kooreman (2009) suggest that the share of residual voters1 is reduced as direct-recording electronic (DRE) voting machines are used, as
it only becomes recorded the intentionally blank votes. Not surprisingly, turnout temporarily increases. After the first election with the new voting system, the effect becomes statistically insignificant. When using voting technologies some cautions must be made. Card and Moretti (2007) analysed how voting innovations could have influenced election outcomes in the 2000 and 2004 US Presidential elections. They concluded that DRE voting was positively correlated with an increase of the vote share for the Republican Party. Interestingly, the authors also found out that DRE voting can impact election results through turnout: they found out that Hispanics, who tend to vote more for the Democratic party, presented lower levels of turnout, although no effect on Blacks. Along with this hypothesis, it was shown that elderlies are also expected to use their voting rights less often with the change in voting technology (Roseman and Stephenson 2005). At the same time, no significant results were
5 found for the low-educated citizens. Using the 2003 California gubernatorial recall election, Dee (2007) presented evidence that when using punch-card systems California citizens saw their votes mistakenly taken, as they tend to confuse and vote erroneously for one of the four candidates positioned above or below the two main candidates.
3. Institutional Background
In 1986, after several enlargements, Portugal and Spain became the 11th and 12th
countries of the now called European Union. Among several treaties signed, highlights to the Lisbon Treaty, which came in force on December 1, 2009, since it implemented several changes regarding the powers of the European Parliament (EP), as a way to increase citizens’ voice inside the EU. First, 40 new policy areas were given to EP, from agriculture and fisheries to security and justice. At the same time, the institution would now have similar powers to the Council, concerning the approval of the annual budget and it would elect the President of the Commission, the executive body of the EU.
To better economically integrate the several and diverse countries of the EU, there is a system of contributions and consequently redistribution of the funds. In 2017, total EU spending in Portugal was roughly 4.000 billion euros (€ 3.976 billion, 2.11% of Portuguese Gross National Income in 2017), while Portuguese contribution to the EU budget was around 1.300 billion euros (€ 1.375 billion, 0.73% of GNI), meaning that Portugal was a net receiver. Indeed, the increase of the EU funds impacts positively the entry rates of firms, especially of micro firms, improving and boosting economic growth (Santos and Tavares 2018).
Before analysing Portuguese voting behaviours on European elections, it is important to understand their feelings towards the EU. According to a Flash Eurobarometer presented in May 2019, 81% of the interviewers agreed that ‘what brings European citizens together is more important than what separates them’, meaning that the Portuguese understand the importance of European values and their advantages. Moreover, referring to the Spring 2019
6 Eurobarometer of the EP, when asked whether they would vote to leave the EU, 77% of the Portuguese interviewers would vote ‘remain’. Indeed, 69% said they looked at the EU as ‘good thing’. Not surprisingly, 82% considers that Portugal benefited from joining the EU, contrasting with the EU-average of just 68%. EP is the only EU institution directly elected by citizens. However, the majority of the Portuguese does not feel heard in the EU (51%), and when asked when the European elections were going to take place, 29% did not know and 38% did not answer correctly, with 47% of the interviewers admitting that it was improbable that they would vote. Lastly, when asked for the reasons for not voting, independently of voting or not, highlights to powerless vote (33%) and distrust on the political system (30%).
As stated before, EU countries directly elects members of the EP on European Elections. From the elections Portugal has participated in, there were held eight ones with the last one being on 26 May 2019. Concerning all EU countries, in this last election, overall turnout increased for the first time ever, after its negative trend since 1979, year of the first elections, reaching more than 50%. According to Eurobarometer, the most contributor to the increase was the young generation. Interestingly, compared with 2014, more people voted due to civic duty (52%, + 11pp in 2014) and more support of the European Union (25%, +11pp).
a. The Experiment
In an attempt to reinforce democratic participation, on July 18, 2018, the parliament passed a law to promote ‘the implementation, on an experimental basis, of in-situ electronic voting, in at least 10 municipalities’. The project was developed by Secretaria Geral do Ministério da Admnistração Interna (SGMAI). The chosen district was Évora, because, according to the report written by SGMAI: it had 14 municipalities (close to 10); it had proportional distribution between rural and urban municipalities and civil parishes; it had a significant number of voters and a good representativity among municipalities; any civil parish was less than 60 minutes’ drive to the county seat; and last but not least, it had the
7 support of the Intermunicipal Community of Alentejo Central (Comunidade Intermunicipal do Alentejo Central).
Évora is one of Portugal’s 18 districts and belongs to Alentejo region, coinciding with the Intermunicipal Community of Alentejo Central (sub-region). It is in the South of Portugal and it is composed of 14 municipalities and 69 civil parishes. In 2018, Alentejo Central had around 153,701 inhabitants in its 7,393 km2, being the sixth sub-region with a lower population density (20.8). In parallel, taking into account only Continental Portugal (mainland), Alentejo Central ranks top 3 with the fewest concluded constructions for housing (121 in 2018), with Alto Alentejo and Baixo Alentejo being placed number 1 and 2, respectively. The lack of railways investment on services and infrastructure does not help to modernize the region, with good potential considering its closeness to Portugal’s capital, Lisbon, and Spain. Évora’s GDP per capita in 2017 was 16.732, below the national average (18.894). Using Census data, we conclude that employed people in the primary sector has declined from 61.2% in 1960 to 9.3% in 2011, while the tertiary sector saw an increase from 22.3% to 69.4%.
Alentejo Central, as other sub-regions of Alentejo, is traditionally left-wing, currently with 11 (out of 14) municipalities with mayors from Socialist Party (PS – Partido Socialista) and Unitary Democratic Coalition2 (CDU - Coligação Democrática Unitária), and the other
three (Borba, Estremoz and Redondo) with independent mayors. Only Mourão and Vila Viçosa have had right-wing mayors from the main centre-right party, PPD/PSD (Socialist Democratic Party). However, in the XXI century, the winners were always PS or PCP (or independent mayors) in local elections. Indeed, the Communist Party always had a strong support in Alentejo since its clandestine existence. During Estado Novo (1926-1974), the authoritarian regime, Alentejo’s labour force was mostly composed by salaried farm workers,
2 CDU is a coalition dominated by the Portuguese Communist Party (PCP – Partido Comunista Português),
hence we will refer to PCP henceforth. It also includes the Ecologist Party “The Green” (PEV – Partido
8 in precarious conditions who saw support on PCP, which explains why the party is strong in the region (Maxwell 1997). Concerning national elections, in 2015 for the first time ever and after the economic and financial crisis, the two main radical left parties, PCP and Left Bloc (BE – Bloco de Esquerda), supported parliamentary the minority government of PS (Fernandes 2016; Lisi 2016). By surprise of many, since the radical parties were always seen as the ‘voice of protest and opposition outside the parliament’ (Fernandes, Magalhães and Santana-Pereira 2018), the government lasted for the entire legislature. Focusing on European elections, after two consecutive elections with high electoral participation (in 1987, on the same day as the legislative election, and 1989) turnout rate has been stable, with values between 30% and 40% nationally since 2004. After the economic crisis and the bailout with the intervention of Troika between 2011 and 2014, which harmed European Elections on 2014 (Freire and Santana-Pereira 2015), overall turnout increased in 2019. Nevertheless, as displayed in figure 1, there is a strong trend towards a decrease in turnout rate both in Évora and in its neighbouring districts. As one might expect, PS and PCP have cast the majority of the votes across this district (37.85% and 21.55%, respectively3).
Figure 1 Turnout Rate on European Elections
Coming back to the electronic voting experiment, in all 14 municipalities, there were a total of 185 traditional polling stations in all civil parishes and 47 electronic polling stations distributed among 25 civil parishes. Hence, there were polling places with only traditional
9 polling stations and others with both systems. All municipalities had at least one direct-recording electronic voting machine, which was working independently of the traditional polling stations. Thus, the two methods co-existed across the district, ‘allowing the citizens to choose between using a traditional method or an electronic one’ (Voto Eletrónico no Distrito de Évora – Relatório Final, page 8). It was chosen to establish a non-binding electronic voting system because it was a pilot experiment. Since not all civil parishes had electronic machines, Évora’s voters could vote electronically in any polling station, regardless of their residence. This was made possible by the dematerialization of the electoral roll, meaning that instead of a paper electoral roll there were portable computers with the information needed.
During the Election Day, the procedure went as follows: the system of the electronic machine was started, with the introduction of a smartcard and a PIN of the president or vice -president of the polling station to activate the citizen’s session. The ballot would appear, and the voter would press the chosen option.4 After voting, the paper ballot would be printed for
the voter to verify the vote (voter-verifiable paper audit trail). Afterwards, the voter would fold the paper in four and deliver it to the responsible person to put it on the ballot box.
For the experiment, SGMAI was authorized to bear the costs, arising from:
a) the purchase of 430 telecommunication equipment up to a maximum of 349,900 €, plus VAT;
b) the purchase of portable computers for the dematerialization of electoral roll (CED) up to a maximum of 235,000€, plus VAT;
c) the contract for the provision of services for the development of a software for the dematerialized electoral roll (CED), in a total amount of 408,666€, plus VAT.
Thus, a total of 1,22 million €, including VAT, was available for the experiment to run.
10 In reality, there were two contracts concluded, taking into account two categories (lotes): Electronic Voting System and associated services (category 1) and Infrastructure provision and communications services between polling stations and National Internal Security Network (RNSI – Rede Nacional de Segurança Interna), as well as the equipment installation and support (category 2), which included the 430 telecommunication equipment. Category 1 costed a maximum value of 598,279.37€, plus VAT, while Category 2 costed 348,876.20€, plus VAT, giving a total of around 1,17 million €, including VAT.
Some interesting results can be advanced using simple arithmetic computations. Out of the 232 polling stations, 47 were electronic (20.26% out of total), while the remaining 185 were traditional (79.74%). Moreover, 15,735 Évora’s citizens chose to vote electronically, representing 33.29% of total voters. Thus, electronic voting machines seemed to have a positive effect on voters’ choice, since the proportion of people who voted on DRE machines was higher than the proportion of electronic voting stations. In fact, in Mourão, more than half of voters opted to use DRE machines, although the difference was only 16 voters. In Évora, the district’s capital, 37.08% of the voters chose to vote electronically.
4. Empirical strategy
a. Empirical methodology
We take advantage of a quasi-experiment in Évora’s district, with the introduction of the electronic voting option to evaluate its impact on turnout and on the percentage of votes on certain parties. For this, we will use differences-in-differences (DiD, henceforth) and matching procedures.
To estimate the effect of the electronic voting option on the different political outcomes (turnout rate, percentage of blank, null and parties’ votes), we estimate the following difference-in-differences specification (Card and Krueger 1994) for municipality 𝑖 and year 𝑡, from 2004–2019:
11 𝑦𝑖𝑡= 𝛼𝑖+ 𝜆𝑡+ 𝜂1∗ 𝑡𝑟𝑒𝑎𝑡𝑒𝑑𝑖 ∗ 𝑝𝑜𝑠𝑡 𝑝𝑒𝑟𝑖𝑜𝑑𝑖𝑡+ 𝑋′𝑖𝑡𝛽 + 𝜀𝑖𝑡 (1)
where 𝑦 are the different outcome variables defined in the following section, 𝛼𝑖 are the
municipality fixed effects, 𝜆𝑡 the year fixed effects, 𝑡𝑟𝑒𝑎𝑡𝑒𝑑 is a binary variable which takes
value one if the municipality belongs to Évora’s district, i.e., had the option of electronic voting and zero otherwise, 𝑝𝑜𝑠𝑡 𝑝𝑒𝑟𝑖𝑜𝑑 is a binary indicator that takes value one for 2019, the year of the implementation of the policy, and 𝑋′𝑖𝑡𝛽 is a vector of socio–demographic,
economic, and political characteristics at the municipal level, which will be further described in the section below. Following Bertrand, Duflo and Mullain (2004), we cluster standard errors at the municipal level.
One of the most crucial assumptions to correctly implement DiD is the common trends or parallel trends assumption. It states that, in the absence of treatment, the unobserved differences between the treated and control groups would be constant over time. To test it, we will run the following regression and show the graphic design to be easily assessed. If this assumption does not hold, DiD estimates are biased and we cannot rely on the results.
𝑦𝑖𝑡= 𝛼𝑖+ 𝜆𝑡+ 𝜏2∗ 𝑝𝑜𝑠𝑡 + ∑2019𝑡=2004𝜂𝑡∗ 𝑡𝑟𝑒𝑎𝑡𝑒𝑑 ∗ 𝑝𝑜𝑠𝑡+ 𝑋′𝑖𝑡𝛽 + 𝜀𝑖𝑡 (2)
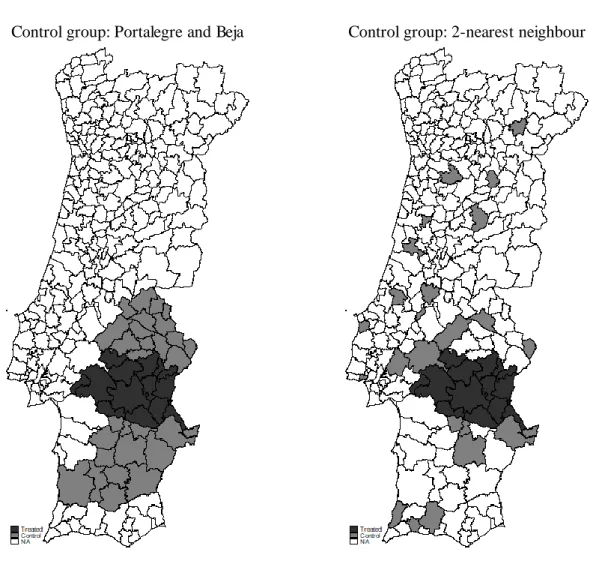
The first control group we use is Portalegre and Beja’s districts, because they belong to the same region – Alentejo. However, in order to get a more homogeneous comparison group, controlling for the observed characteristics, we use matching, and more precisely 2-nearest neighbour, to choose another control group (Rubin 1979; Stuart et al. 2014). For robustness, we also show DiD results comparing Évora with a comparison group obtained with a kernel matching procedure.
Thus, the first matching method was nearest neighbour. Here, for each treated unit 𝑖, the software finds a comparison group by 𝐴𝑗(𝑥) = {𝑗|𝑚𝑖𝑛𝑗||𝑥𝑖− 𝑥𝑗||}, where || || is the
Euclidian distance between vectors. Simplifying, we are matching each treated unit with the closest untreated observation (in our paper, we use 2-nearest neighbour, meaning we try to
12 find two untreated units for each treated). Afterwards, we also weight using kernel, which weights according to the following regression, where K is the kernel (0.05 in our paper):
𝑤(𝑖, 𝑗) = 𝐾(𝑥𝑗−𝑥𝑖)
∑𝑁𝑐,𝑖𝑗=1𝐾(𝑥𝑗−𝑥𝑖) (3)
The geographical distribution of two out of three control groups is displayed in figure 2. Figure 2 Geographical distribution of the treated and control municipalities
Control group: Portalegre and Beja Control group: 2-nearest neighbour
Furthermore, to verify that the three control groups were similar to the treated units, we perform balanced tests to analyse their differences on observables.
b. Data
The dataset used covers all municipalities of Portugal mainland, from 2004 to 2019. Besides electoral results, there is no data available for 2019, so we use data from 2018 for the
13 non-political variables. The only exception is energy consumed, for which we use data from 2017, due to unavailability. Table 1 reports descriptive statistics for the variables used.
Table 1 Descriptive Statistics for period 2004-2019
Sample I Sample II
Évora, Portalegre and Beja Évora and Matching: 2-nearest neighbour
Obs. Mean Std Dev Obs. Mean Std Dev
Dependent Variables Turnout rate 172 0.369838 0.054321 152 0.354879 0.048682 Percentage of PS voters 172 0.141546 0.037549 152 0.12852 0.034698 Percentage of PCP voters 172 0.095756 0.055736 152 0.074338 0.053582 Percentage of PSD/CDS voters 172 0.06669 0.028326 152 0.08039 0.040334 Percentage of voters on other parties 172 0.047469 0.014807 152 0.051412 0.02029 Percentage of Blank votes 172 0.011344 0.004113 152 0.012773 0.005206 Percentage of Null votes 172 0.007032 0.002345 152 0.007447 0.002841 Independent Variables
Dummy if town hall is
left 172 0.802326 0.399408 152 0.835526 0.37193 Dummy if town hall is
neither left nor right 172 0.05814 0.23469 152 0.085526 0.280588 Dummy if town hall
aligned with
government 172 0.319767 0.467748 152 0.335526 0.473735 Share of population
with 14 y.o. or less 172 0.830076 1.81856 152 0.722043 1.746136 Share of population
with 65 y.o or more 172 0.270826 0.042761 152 0.247844 0.040078 Energy consumption per capita 172 4.50849 4.788545 152 3.901146 1.351215 Share of unemployment 172 0.073999 0.105116 152 0.063852 0.114687 Municipal expenditures per capita 172 1.702737 0.656205 152 1.402203 0.639239
We wanted to assess the impact of electronic voting on different political outcomes (turnout rate, percentage of blank, null and parties’ votes). Our main dependent variable – turnout – was computed as the number of people who voted (voters) divided by the number of people who could vote, independently of having voted or not (eligible voters). Turnout is calculated to analyse whether electronic voting improved electoral participation or not. Afterward, we also calculate the percentage of the votes in certain parties (mainly PS and
14 PCP, the two main parties of the region) out of the total eligible voters. With the results, we can see if, despite the results for turnout, voters voted differently when using electronic voting. Data directly related to voting was taken from SGMAI.
Since Alentejo region has a certain preference for left parties, as we described above, we control it by using three political dummy variables. The first is equal to one if the winning party of the town hall is from left and zero otherwise; the second is equal to one if the winning party of the town hall is neither right nor left, and zero otherwise; the last political dummy variable is one if the president of the town hall is aligned with the central government, and zero otherwise. Due to unavailable data, we narrowed our choice for the demographic and economic control variables. As demographic variables, we include both share of the population with less than 15 years old as well as share of the population with or more than 65 years old, taken from Instituto Nacional de Estatística. Goerres (2007) concluded that as older individuals are used to vote, their turnout rates are higher and thus we expect higher levels in those municipalities. Since there is no measure for GDP segregated by municipalities, we use energy consumption per capita, taken from Direção-Geral de Geologia e Energia. We expect richer municipalities to be more politically involved, with more social connections and thus a higher sense of society and a higher propensity to vote (Burns, Schlozman and Verba 2001). Still, according to Stockemer (2015), there is a quadratic relationship between turnout and GDP, since a higher GDP is expected to increase the level of turnout, until a certain point when turnout starts decreasing. As Évora is still a rural region, with GDP below the national average, we expect that higher GDP (and thus higher energy consumption per capita) increases turnout. We know that a higher level of unemployment rate increases citizens’ concerns about the future and thus it can lead to a higher turnout rate, as a way to express their fears (Cebula 2017). Hence, we include the municipalities’ unemployment rate, using data from Gabinete de Estratégia e Estudos (until
15 2006) and Instituto de Emprego e Formação Profissional onwards. Lastly, we add municipalities’ expenditures per capita taken from Direção-Geral das Autarquias Locais,
because, with their increase, citizens perceive elections as of higher importance and thus turnout is expected to increase (Percival et al. 2007).
Our period of analysis starts in 2004 since it is when the different outcome s remain relatively stable over time. In the first European elections, 1987 and 1989, the rates of turnout were above the current ones. Moreover, Eurozone was established in 1999, with the adoption of the Euro, which could have influenced the 1999 European election results.
Before analysing the treatment effect of the policy, it is first important to understand if the different control groups are comparable to the treated group, so we performed the balance tests, which are shown on table 2.
Table 2 Mean differences between Treatment and Control, 2014
Portalegre and Beja
Matching: 2-nearest
neighbour Matching: kernel Dummy if town hall is left 0.027 -0.131 -0.185
(0.139) (0.127) (0.113)
Dummy if town hall is neither left nor right
0.180 0.131 0.185
(0.118) (0.127) (0.113)
Dummy if town hall aligned with government
-0.207** 0.000 0.000
(0.077) - -
Share of population with 14 y.o. or less
0.366 0.589 0.781
(0.896) (0.890) (0.854)
Share of population with 65 y.o or more
-0.012 0.016 0.012
(0.012) (0.012) (0.009)
Energy consumption per capita -1.447 -0.066 0.381 (1.334) (0.279) (0.246) Share of unemployment 0.002 0.004 0.002 (0.004) (0.005) (0.004) Municipalities’ expenditures per capita
-0.405*** 0.058 0.143
(0.135) (0.146) (0.110)
Number of observations 43 38 83
Number of treated 14 14 14
Number of control 29 24 69
Although Portalegre and Beja belong to the same region as Évora – Alentejo - we see that these two districts are statistically different regarding the party that is in the town hall and the
16 government, and in the municipalities’ expenditures per capita. However, when using matching, we have statistically better control groups, apparently similar in the variables we can observe. Thus, we can use DiD to calculate the impact of the electronic voting option.
In our analysis, to be demanding, we focus our attention more on the control group using 2-nearest neighbour, since it appears to have lower differences on the observables.
5. Results
a. Baseline results
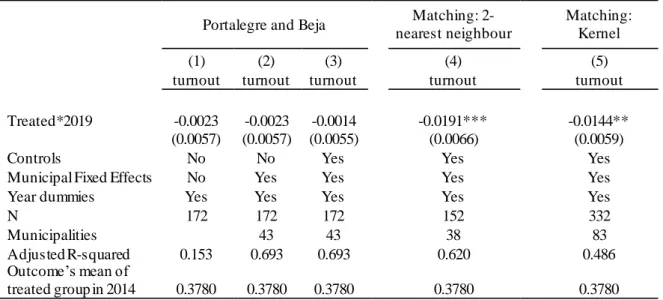
The first outcome of interest is turnout, as one of the main goals of modernizing elections is to boost electoral participation. The results are presented in table 3.
For each dependent variable, the first three columns are the results using Portalegre and Beja as a control group, column (4) using the control group computed using 2-nearest neighbour and column (5) kernel. Column (1) presents the simplest diff-in-diff model, with no controls. We then included municipal fixed effects in column (2). Finally, columns (3), (4) and (5) have all control variables described in the data section.
Table 3 Baseline Results - Turnout
Portalegre and Beja Matching: 2-nearest neighbour
Matching: Kernel
(1) (2) (3) (4) (5)
turnout turnout turnout turnout turnout
Treated*2019 -0.0023 -0.0023 -0.0014 -0.0191*** -0.0144** (0.0057) (0.0057) (0.0055) (0.0066) (0.0059)
Controls No No Yes Yes Yes
Municipal Fixed Effects No Yes Yes Yes Yes
Year dummies Yes Yes Yes Yes Yes
N 172 172 172 152 332
Municipalities 43 43 38 83
Adjusted R-squared 0.153 0.693 0.693 0.620 0.486 Outcome’s mean of
treated group in 2014 0.3780 0.3780 0.3780 0.3780 0.3780
Note: Standard errors in brackets are clustered at the municipal level and robust to heteroscedasticity. The set of time-varying municipal controls includes dummy if the mayor elected is from a left party, dummy if the mayor elected is neither from left nor right party , dummy if the mayor elected is aligned with government, share of population with 14 y.o. or less, share of population with 65 y.o. or more, energy consumption per c apita, share of unemployment, municipalities’ expenditures per capita. Stars indicate significance levels of 10% (*), 5% (**), and 1% (***).
17 Turnout tended to decrease with the treatment. However, only when the control groups were more similar – groups created by matching – do we have statistically significant results. Using 2-nearest neighbour, we conclude that turnout decreased by 1.91 percentage points, with the option of electronic voting, on average ceteris paribus, being statistically significant at 99% confidence level.
Nonetheless, we were not expecting negative changes on turnout, since electronic voting was merely an option, allowing citizens to choose. However, this policy has certain particularities: citizens still have to go to the polling station to vote and, as the experiment only took place in Évora, there was no decrease on the time to know the electoral results. These two facts combined might explain why turnout rate did not increase: costs of voting were practically the same. So, it is interesting to know if there was a general decrease on voters among all parties or if some parties suffered more, to see if there are certain voters’ characteristics which might explain the aversion to technology. From background section, we know that the main political parties of Évora’s district are PS and PCP, so we first analysed these two outcomes. Results are shown on tables 4 and 5, respectively.
Table 4 Baseline Results - PS votes (%)
Portalegre and Beja Matching: 2-nearest neighbour Matching: Kernel (1) (2) (3) (4) (5) pPS pPS pPS pPS pPS Treated*2019 -0.0005 -0.0005 0.0007 -0.0036 0.0005 (0.0048) (0.0048) (0.0037) (0.0048) (0.0043)
Controls No No Yes Yes Yes
Municipal Fixed Effects No Yes Yes Yes Yes
Year dummies Yes Yes Yes Yes Yes
N 172 172 172 152 332
Municipalities 43 43 38 83
Adjusted R-squared 0.533 0.837 0.853 0.821 0.781 Outcome’s mean of
treated group in 2014 0.1321 0.1321 0.1321 0.1321 0.1321
Note: Standard errors in brackets are clustered at the municipal level and robust to heteroscedasticity. The set of time-varying municipal controls includes dummy if the mayor elected is from a left party, dummy if the mayor elected is neither from left nor right party , dummy if the mayor elected is aligned with government, share of population with 14 y.o. or less, share of population with 65 y.o. or more, energy consumption per c apita, share of unemployment, municipalities’ expenditures per capita. Stars indicate significance levels of 10% (*), 5% (**), and 1% (***).
18 Regarding PS votes, the most voted party in the region, we see no statistically significant difference among control and treatment groups.
Table 5 Baseline Results – Communist Party votes (%)
Portalegre and Beja Matching: 2-nearest neighbour Matching: Kernel (1) (2) (3) (4) (5) pPCP pPCP pPCP pPCP pPCP Treated*2019 -0.0098 -0.0098 0.0092 -0.0200*** -0.0256*** (0.0061) (0.0061) (0.0058) (0.0066) (0.0055)
Controls No No Yes Yes Yes
Municipal Fixed Effects No Yes Yes Yes Yes
Year dummies Yes Yes Yes Yes Yes
N 172 172 172 152 332
Municipalities 43 43 38 83
Adjusted R-squared 0.187 0.748 0.760 0.692 0.641 Outcome’s mean of
treated group in 2014 0.1232 0.1232 0.1232 0.1232 0.1232
Note: Standard errors in brackets are clustered at the municipal level and robust to heteroscedasticity. The set of time -varying municipal controls includes dummy if the mayor elected is from a left party, dummy if the mayor elected is neither from left nor right party , dummy if the mayor elected is aligned with government, share of population with 14 y.o. or less, share of population with 65 y.o. or more, energy consumption per c apita, share of unemployment, municipalities’ expenditures per capita. Stars indicate significance levels of 10% (*), 5% (**), and 1% (***).
However, the results for PCP are similar to the ones presented on turnout. No statistically significant differences comparing Évora to Portalegre and Beja. Despite so, the percentage of PCP votes decreased 2 percentage points on average ceteris paribus, using 2-nearest neighbour. Interestingly, the magnitude of the coefficient is similar to the one expected by turnout. Alentejo is an important region for PCP since its existence during the authoritarian regime, as salaried farm workers in precarious conditions saw support in the party (Maxwell 1997). Several authors have acknowledged that the party is also close to the trade union movement (Watson 2015; Freire 2009). Moreover, PCP voters tend to be less religious and from lower socioeconomic classes, with only a minority being from upper class (Freire 2009). Furthermore, PCP casts most of its votes among aged people, with only primary education. Usually voters are employees, not including self-employed, and retired people (Cabral 1995). On the 2019 European Election, according to a poll made by Centro de Estudos e Sondagens de Opinião of Catholic University, PCP casted the majority of its votes among the people
19 with more than 65 years old (Público 2019). Being from a lower economic class and older, PCP voters could have an aversion to technology, and not trusting it. In addition, they could be uninformed, not knowing it was merely an option.
In the appendix, we show the results computed for the percentage of votes in other
parties, nulls and blanks. We can only observe statistically significant results when comparing Évora with Portalegre and Beja, contrarily to turnout rate and PCP votes. Despite so, the percentage of blank votes, a measure of political protest (Driscoll and Nelson 2014) increased with the electronic voting option. We will further develop the topic. On appendix, we also show the results when we performed DiD using the logarithm form of voters, controlling for the logarithm form of eligible voters. The results are similar to the ones computed for turnout rate, in terms of significance. Moreover, we develop our analyses by excluding the districts’ capitals (Évora, Beja and Portalegre) to treatment and the first control groups (Portalegre and Beja districts) for turnout rate and percentage of votes on PS and PCP. There are no statistically significant results.
Lastly, we also analysed, using simple arithmetic computations, the results of Évora on an electronic versus traditional voting approach. Out of the total number of people who voted using the electronic method, 31% voted on PS, while the percentage of PS voters among the traditional approach was 37%. Similarly, only 16% of electronic voters opt to choose PCP, contrasting with 22% of the traditional voters. This means that both PS and PCP cast more votes among the traditional voters, which is in line with the results we got from DiD. Contrarily, other parties’ and blank voters saw a higher proportion of their voters using electronic voting machines.
b. Internal Validity Considerations
As explained previously in the methodology section, DiD relies on the parallel trends assumption. Therefore, we analyse the different outcomes variables through time, starting in
20 2004, which are presented in figure 3. We show only the results for one matched control group, since we observe less differences between the control and treated groups using 2-nearest neighbour.
Figure 3 Event Studies for main outcomes variables (95% confidence interval)
Notes: 95% Confidence Levels. Standard errors are clustered at the municipal level.
Regarding turnout, we conclude that, using 95% confidence interval, there are no statistically significant differences between the two groups, until the year of the treatment. Moreover, we could already predict that turnout tended to decrease with the introduction of the electronic voting option. Concerning the other two dependent variables, we see no
21 difference between control and treated group before the intervention. Despite so, we notice that there is a statistically significant negative jump on the percentage of voters of PCP in 2019 and no jump concerning PS.
c. Survey
Between July and September 2019, we also performed on-site5 and online surveys (51%
vs 49%, respectively) to understand the citizens’ thoughts about the electronic voting, as well as demographic characteristics of Évora’s voters. The translated questionnaire is displayed on appendix 4, while the graphical analyses are presented on appendix 5.
We took a sample of 469 answers, 316 of which valid. The sample is balanced in terms of gender (50% males), with a higher proportion of citizens with higher education (53%), which might be biased. Despite so, 89% of the people knew about the electronic voting option. In this subsample, and conditional of having voted electronically (153 answers), 63% of the citizens had higher education, a bigger value than our original sample. If we narrow down to the people who gave a positive feedback (124 answers), then the proportion of highly educated people increases even more to 66%. Thus, more educated people tended to vote electronically and had a positive feedback about the system. This means that lower educated people, who are an important part of PCP sympathisers, were not users of the electronic method option, which might explain the decrease on PCP’s vote share. Furthermore, assuming more educated people are the ones who tend to express a voter of protest, then the significant increase of blanks votes might be explained by the increase of the proportion of educated people. The fact is also confirmed by the poll made by Centro de Estudos e Sondagens de Opinião of Catholic University, which shows that the majority of blank votes was casted among the most-educated people (Público 2019).
22 Similarly, the original sample has 16% of retired people, but, as we narrow the sample, its percentage decreases, reinforcing the conclusions for the PCP’s results. More specifically, when using the answers of people who knew about the electronic voting and used it, the percentage of retired people decreases to 11%. A decrease in the proportion of retired people, from which PCP casts its votes, suggests a decrease on the party’s share of votes. The same goes for old people: when narrowing the sample, the proportion of young people increases and old people decreases, helping the narrative.
It is also interesting to note that, considering the original sample, only 48% knew about the possibility of voting electronically in a civil parish which was not the citizen’s civil parish of residence. Considering that the sample is slightly biased towards educated people, who are the ones who tend to be more informed about electoral news and modernisations, there was an important misinformation about the process and a misuse of an important advantage that could boost turnout.
As mentioned before, the last question of the survey was “Describe the voting experience in one word”. Word map is displayed on appendix 6. Although the question was biased towards the voting action and not the electronic voting, some people understood the intention of the question to relate to electronic voting. We observe that most answers were positive. Examples include “good”, “simple”, “innovative” and “effective”, which are related to electronic voting. However, “useless” and “distrust” were also recurrent answers, which can be seen a distrust of electronic voting or of political system and thus explain the decrease on turnout.
6. Conclusions
However puzzling the balance of benefits and costs that makes people vote (Dhillon and Peralta 2002), mature democracies tend to experience a steady decrease in voter turnout. Electronic voting is emerging as a possible way to decrease the costs of voting, namely by
23 simplifying procedures and adding the possibility of voting away from the place of registration. In addition to logistic and ecological advantages, electronic voting furthers expediency and transparency in vote counting. In the 2019 European Election, an election traditionally associated with low turnout, citizens of Évora’s district, in Portugal, were given the option of casting an electronic vote over a traditional voting procedure, to be decided at the polling station. We use this quasi-natural experiment to run a differences-in-differences estimation to assess the impact of electronic voting on electoral results. Our results show the availability of electronic voting is associated with a decrease in turnout of 2 percentage points. Our results may be explained by the fact that the cost of voting did not change significantly in our setting, as individuals had to be present at a polling station. We also find a significant decrease in the percentage of votes for the Portuguese Communist Party, of a magnitude similar to that of the decrease in turnout. When compared to the electorate at large, Communist voters are older, less educated citizens, with lower income, and thus possibly more averse to the use of technology. In the context of the existing literature, our results strongly suggest the use of innovative voting technology can exclude specific and groups of citizens, and thus matter for the final result.
We recommend greater efforts be made to inform citizens of the nature and credibility of electronic voting mechanisms. One possible way to do so is for policy makers to motivate such symbiosis between technology and voting through the use of technological platforms to encourage turnout, such as the use of ATMs (Santos, Tavares and Vicente 2019). In sum, electronic voting is not a silver bullet solution for low turnout, especially in second-degree elections such as the European election. Furthermore, implementing electronic voting needs to go hand in hand with local knowledge as to the characteristics and distribution of the electorate, to avoid unnecessary faux pas when self-selection of voters into not voting might be present.
24 References
Allers, Maarten A., and Peter Kooreman. 2009. “More evidence of the effects of voting technology on election outcomes.” Public Choice 139: 159-170.
Alvarez, R., T. Hall, and A. Trechsel. 2009. “Internet Voting in Comparative Perspective: The Case of Estonia.” PS: Political Science & Politics 42 (3): 497-505.
Avgerou, Chrisanthi, Andrea Ganzaroli, Angeliki Poulymenakou, and Nicolau Reinhard. 2009. “nterpreting the trustworthiness of government mediated by information and communication technology: Lessons from electronic voting in Brazil.” Information Technology for Development 15 (2): 133-148.
Bertrand, Marianne, Esther Duflo, and Sendhil Mullain. 2004. “How Much Should We Trust Differences-in-Differences Estimates?” The Quarterly Journal of Economics 119 (1): 249-275.
Blais, André, Elisabeth Gidengil, Neil Nevitte, and Richard Nadeau. 2004. “Where Does Turnout Decline Come From?” European Journal of Political Research 43: 221-236. Blais, André, and Daniel Rubenson. 2013. “The Source of Turnout Decline: New Values or
New Contexts?” Comparative Political Studies 46 (1): 95-117.
Burns, Nancy, Kay Lehman Schlozman, and Sidney Verba. 2001. The Private Roots of Public Action: Gender, Equality, and Political Participation. Harvard University.
Cabral, Manuel Villaverde. 1995. “Grupos De Simpatia Partidária Em Portugal: Perfil Sociográfico E Atitudes Sociais.” Análise Social, Quarta Série 30 (130): 175-205. Card, David, and Alan B. Krueger. 1994. “Minimum Wages and Employment: A Case Study
of the Fast Food Industry in New Jersey and Pennsylvania.” American Economics Review 84 (4): 772-793.
Card, David, and Alan B. Krueger. 1994. “Minimum Wages and Employment: A Case Study of the Fast Food Industry in New Jersey and Pennsylvania.” American Economics Review 84 (4): 772-793.
Card, David, and Enrico Moretti. 2007. “Does Voting Technology Affect Election Outcomes? Touch-screen Voting and the 2004 Presidential Election.” The Review of Economics and Statistics 89 (4): 660-673.
Cebula, Richard J. 2017. “Unemployment and voter turnout revisited: A brief note.” Electoral Studies 48: 149-152.
De Giorgi, Elisabetta, and José Santana-Pereira. 2016. “The 2015 Portuguese Legislative Election: Widening the Coalitional Space and Bringing the Extreme Left in.” South European Society and Politics 21 (4): 451-468.
Dee, Thomas S. 2007. “Technology and Voter Intent: Evidence from the California Recall Election.” The Review of Economics and Statistics 89 (4): 674-683.
Dhillon, Amrita, and Susana Peralta. 2002. “Economic theories of voter turnout.” The Economic Journal 112 (480): F332-F352.
25 Driscoll, Amanda, and Michael J. Nelson. 2014. “Ignorance or Opposition? Blank and Spoiled Votes in Low-Information, Highly Politicized Environments.” Political Research Quarterly 67 (3): 547-561.
European Parliament. 2018. EU elections: how many MEPs will each country get in 2019? 01
de 02. Acessed on January 3, 2020.
https://www.europarl.europa.eu/news/en/headlines/eu-affairs/20180126STO94114/eu-elections-how-many-meps-will-each-country-get-in-2019.
European Parliament. 2019. “Eurobarómetro 91.1: Portugal.”
https://www.europarl.europa.eu/at-your-service/files/be- heard/eurobarometer/2019/closer-to-the-citizens-closer-to-the-ballot/national-factsheets/pt-pt-factsheet-parlemeter-2019.pdf.
European Parliament. 2019. “Flash Eurobarometer 4021: Portugal.”
https://www.europarl.europa.eu/at-your-service/files/be- heard/eurobarometer/2019/emotions-and-political-engagement-towards-the-eu/national-factsheets/pt-en-flash-2019.pdf.
European Parliament. 2019. “The 2019 post-electoral survey: Have European Elections entered a new dimension?” https://www.europarl.europa.eu/at-your-service/files/be- heard/eurobarometer/2019/post-election-survey-2019-complete-results/report/en-post-election-survey-2019-report.pdf.
—. 2019. The Treaty of Lisbon. Acessed on January 3, 2020. https://www.europarl.europa.eu/factsheets/en/sheet/5/the-treaty-of-lisbon.
European Union. 2019. Portugal. Accessed on January 3, 2020. https://europa.eu/european-union/about-eu/countries/member-countries/portugal_en.
Fernandes, Jorge M. 2016. “The seeds for party system change? The 2015 Portuguese general election.” West European Politics 39 (4): 890-900.
Fernandes, Jorge M., Pedro C. Magalhães, and José Santana-Pereira. 2018. “Portugal’s Leftist Government: From Sick Man to Poster Boy?” South European Society and Politics 23 (4): 503-524.
Freire, André. 2009. “Valores, temas e voto em Portugal, 2005 e 2006: analisando velhas questões com nova evidência.” in As Eleições Legislativas e Presidenciais, 2005-2006, de Mariana Costa Lobo e Pedro Magalhães, 183-223. Lisbon: ICS.
Freire, André, and José Santana-Pereira. 2015. “More Second-Order than Ever? The 2014 European Election in Portugal.” South European Society and Politics 20 (3): 381-401. Germann, Micha, and Uwe Serdült. 2017. “Internet Voting and Turnout: Evidence from
Switzerland.” Electoral Studies 47: 1-12.
Goerres, Achim. 2007. “Why are Older People More Likely to Vote? The Impact of Ageing on Electoral Turnout in Europe.” The British Journal of Politics and International Relations 9 (1): 90-121.
Lijphart, Arend. 1997. “Unequal Participation: Democracy's Unresolved Dilemma.” The American Political Science Review 91 (1): 1-14.
26 Lisi, Marco. 2016. “U-Turn: The Portuguese Radical Left from Marginality to Government
Support.” South European Society and Politics 21 (4): 541-560.
Malkopoulou, Anthoula. 2009. “Lost Voters: Participation in EU Elections and the Case for Compulsory Voting.” CEPS Working Document No 317.
Maxwell, Kenneth. 1997. The Making of Portuguese Democracy. Cambridge: Cambridge University Press.
Público. 2019. PAN é a terceira força juntos dos mais jovens, CDU a última ? 04 of 06. Acessed on January 3, 2020. https://www.publico.pt/2019/06/04/politica/noticia/pan-terceira-forca-junto-jovens-cdu-ultima-1875181.
Percival, Garrick L., Mary Currin-Percival, Shaun Bowler, and Henk Van Der Kolk. 2007. “Taxing, Spending, and Voting: Voter Turnout Rates in Statewide Elections in Comparative Perspective.” State & Local Government Review 39 (3): 131-143.
Plutzer, Eric. 2002. “Becoming a Habitual Voter: Inertia, Resources, and Growth in Young Adulthood.” The American Political Science Review 96 (1): 41-56.
Reif, Karlheinz, and Hermann Schmitt. 1980. “Nine second-order national elections - A conceptual framework for the analysis of European Elections results.” European Journal of Political Research 8: 3-44.
Roseman, Gary H., and Frank E. Stephenson. 2005. “The Effect of Voting Technology on Voter Turnout: Do Computers Scare the Elderly?” Public Choice 123 (1-2): 39-47. Rubin, Donald B. 1979. “Using Multivariate Matched Sampling and Regression Adjustment
to Control Bias in Observational Studies.” Journal of the American Statistical Association 74 (366): 318-328.
Santos, João Pereira dos, and José Tavares. 2018. “European Funds and Firm Dynamics: Estimating Spillovers from Increased Access.” CEPR Discussion Paper No DP13082. Santos, João Pereira dos, José Tavares, and Pedro Vicente. 2019. “Can ATMs Get Out the Vote? Evidence from a Nationwide Field Experiment.” Centre for Economic Policy Research.
Secretararia-Geral do Ministério da Admnistração Interna. 2019. “Voto Eletrónico no Distrito de Évora.”
Stein, Robert M, and Greg Vonnahme. 2008. “Engaging the Unengaged Voter: Vote Centers and Voter Turnout.” The Journal of Politics 70 (2): 487-497.
Stockemer, Daniel. 2015. “Turnout in developed and developing countries: Are the two turnout functions different or the same?” Political Science 67 (1): 3-20.
Stuart, Elizabeth A., Haiden A. Huskamp, Kenneth Duckworth, Jeffrey Simmons, Zirui Song, Michael E. Chernew, and Colleen L. Barry . 2014. “Using propensity scores in difference-in-differences models to estimate the effects of a policy change.” Health Services and Outcomes Research Methodology 14: 166–182.
Watson, Sara. 2015. The Left Divided: The Development and Transformation of Advanced Welfare States. Oxford: Oxford University Press.
27 Wattenberg, Martin P. 2002. Where Have All the Voters Gone? Harvard University Press.
28 Appendices
Table A1 Baseline Results - Votes in other parties (%), null votes (%) and blank votes (%)
pOthers pBlanks pNulls
Portalegre and Beja 2-nearest neighbour Portalegre and Beja 2-nearest neighbour Portalegre and Beja 2-nearest neighbour (1) (2) (3) (4) (5) (6) Treated*2019 0.0064* 0.0044 0.0018*** 0.0009 -0.0011* -0.0008 (0.0032) (0.0042) (0.0006) (0.0008) (0.0006) (0.0006)
Controls Yes Yes Yes Yes Yes Yes
Municipal Fixed
Effects Yes Yes Yes Yes Yes Yes
Year dummies Yes Yes Yes Yes Yes Yes
N 172 152 172 152 172 152 Municipalities 43 38 43 38 43 38 Adjusted R-squared 0.815 0.799 0.703 0.734 0.457 0.582 Outcomes’ mean of treated group in 2014 0.1023 0.1023 0.0122 0.0122 0.0080 0.0080
Note: Standard errors in brackets are clustered at the municipal level and robust to heteroscedasticity. The set of time -varying municipal controls includes dummy if the mayor elected is from a left party, dummy if the mayor elected is neither from left nor right party, dummy if the mayor elected is aligned with government, share of population with 14 y.o. or less, share of population with 65 y.o. or more, energy consumption per capita , share of unemployment, municipalities’ expenditures per capita. Other parties included all parties, except PS and PCP. Stars indicate significance levels of 10% (*), 5% (**), and 1% (***).
Table A2Results for ln(voters)
Portalegre and Beja
Matching: 2-nearest
neighbour Matching: Kernel
(1) (2) (3)
lnvoters lnvoters lnvoters
Treated*2019 -0.0013 -0.0507** -0.0384** (0.0173) (0.0202) (0.0186)
Controls Yes Yes Yes
Municipal Fixed Effects Yes Yes Yes
Year dummies Yes Yes Yes
N 172 152 332
Municipalities 43 38 83
Adjusted R-squared 0.912 0.849 0.768
Note: Standard errors in brackets are clustered at the municipal level and robust to heteroscedasticity. The set of time -varying municipal controls includes dummy if the mayor elected is from a left party, dummy if the mayor elected is neither from left nor right party , dummy if the mayor elected is aligned with government, share of population with 14 y.o. or less, share of population with 65 y.o. or more, energy cons umption per capita, share of unemployment, municipalities’ expenditures per capita. We also control for ln(eligible voters). Stars indicate significance levels of 10% (*), 5% (**), and 1% (***).
29 Table A3 Results without districts' capitals
Portalegre and Beja
(1) (1) (1) turnout pPS pPCP
Treated*2019 -0.0024 -0.0010 -0.0092 (0.0060) (0.0038) (0.0058)
Controls Yes Yes Yes
Municipal Fixed Effects Yes Yes Yes Year dummies Yes Yes Yes
N 160 160 172
Municipalities 40 40 43
Adjusted R-squared 0.689 0.851 0.760
Note: Standard errors in brackets are clustered at the municipal level and robust to heteroscedasticity. The set of time-varying municipal controls includes dummy if the mayor elected is from a left party, dummy if the mayor elected is neither from left nor right party , dummy if the mayor elected is aligned with government, share of population with 14 y.o. or less, share of population with 65 y.o. or more, energy consumption per capita, share of unemployment, municipalities’ expenditures per capita. Stars indicate significance levels of 10% (*), 5% (**), and 1% (***).
30 Appendix 4 Translated survey
As part of a master’s thesis from Nova SBE, I kindly ask to fill out this short questionnaire, to study the impact of electronic voting on the 2019 European Election.
1. Gender: F ____ M ____ 2. Age: ____
3. Educational level
Basic Education ____ Secondary Education____ Higher Education ____ Don’t know/No opinion ___
4. Professional occupation
Student ___ Worker ____ Unemployed ____ Retired ___ Other ___ Don’t know/No opinion ___
5. How comfortable are you with technology? Very little 1 ___ 2 ___ 3 ___ 4 ___ Very
6. In a scale from 1 to 4, how much interest in politics do you have? Very little 1 ___ 2 ___ 3 ___ 4 ___ Very
7. In a scale from 1 to 4, how close do you feel towards the EU? Very little 1 ___ 2 ___ 3 ___ 4 ___ Very
8. In a scale from 1 to 4, how to you evaluate EU’s policies? Negatively 1 ___ 2 ___ 3 ___ 4 ___ Positively
9. Are you registered in Évora’s district, i.e., do you vote in Évora’s district? Yes ____ No ____ Don’t know/No opinion ____
10. Did you know about electronic voting in Évora’s district? Yes ____ No ____ Don’t know/No opinion ____
11. Did you have the possibility of electronically vote in your civil parish? Yes ____ No ____ Don’t know/No opinion ____
12. Did you know you could vote electronically in any parish, and not only in your civil parish of residence?
Yes ____ No ____ Don’t know/No opinion ____ 13. Did you vote on the 2014 European Election?
Yes ____ No ____ Don’t know/No opinion ____ 14. Did you vote on the 2019 European Election?
Yes ____ No ____ Don’t know/No opinion ____ 15. In case you voted, did you vote electronically?
Yes ____ No ____ Don’t know/No opinion ____
16. In case you voted electronically, did you vote on your civil parish? Yes ____ No ____ Don’t know/No opinion ____
17. In case you voted electronically, did you find the process difficult? Yes ____ No ____ Don’t know/No opinion ____
18. Describe the voting experience in one word.
_________________________________
31 Appendix 5 Graphical analysis of the survey's answers
Note: original sample includes all valid answers; sub-sample 1 includes all individuals who knew and voted electronically ; sub-sample 2 includes all individuals from sub -sample 1 that gave a positive feedback about the experience of voting .
Note: original sample includes all valid answers; sub-sample 1 includes all individuals who knew and voted electronically ; sub-sample 2 includes all individuals from sub -sample 1 that gave a positive feedback about the experience of voting .
Note: original sample includes all valid answers; sub-sample 1 includes all individuals who knew and voted electronically ; sub-sample 2 includes all individuals from sub -sample 1 that gave a positive feedback about the experience of voting .
0% 10% 20% 30% 40% 50% 60% Female Male
Gender
original sample sub-sample 1 sub-sample 2
0% 10% 20% 30% 40% 50% 60% 70% 80% 90%
Under 25 years old 25 to 65 years old 65 years old or more
Age
original sample sub-sample 1 sub-sample 2
0% 10% 20% 30% 40% 50% 60% 70%
Basic Education Secondary Education Higher Education
Educational level
32
Note: original sample includes all valid answers; sub-sample 1 includes all individuals who knew and voted electronically ; sub-sample 2 includes all individuals from sub-sample 1 that gave a positive feedback about the experience of voting .
Note: results for original sample only.
Note: results for original sample only.
0% 10% 20% 30% 40% 50% 60% 70% 80%
Student Worker Unemployed Retired Other
Occupation
original sample sub-sample 1 sub-sample 2
48,10% 47,15%
4,75%
Did you know you could vote electronically in
any parish, and not only in your civil parish of
residence?
Yes No Don't know/N o opinion
0% 10% 20% 30% 40% 50% 60% 70% 80% 90%
Yes No Don't know/N o opinion
Did you vote?
33
Note: results for original sample only.
Note: results for the people who vote electronically on the 2019 European Electio n.
Appendix 6 Word map of the answers to "Describe the voting experience in one word." in questionnaire 0 50 100 150 200 250 300 Yes No
Did you vote on the 2019 European election?
Traditionally Electronically Electronically, but not on civil parish of residence
1,94%
98,06%
In case you voted electronically, did you find the process difficult?