ARTIGO ACEITE P ARA PUBLICAÇÃO DISPONÍVEL EM WWW .ACT AMEDICAPORTUGUESA.COM ARTIGO ORIGINAL
A Multivariable Prediction Model to Select Colorectal
Surgical Patients for Co-Management
Um Modelo de Predição para Seleccionar para Co-Gestão
Doentes de Cirurgia Colo-rectal
Alexandra Bayão HORTA1,2, Carlos GERALDES1,3, Cátia SALGADO4, Susana VIEIRA4, Miguel XAVIER1,
Ana Luísa PAPOILA1,3
Acta Med Port 2020 xxx;33(AOP):xxx-xxx ▪ https://doi.org/10.20344/amp.12996
ABSTRACT
Introduction: Increased life expectancy leads to older and frailer surgical patients. Co-management between medical and surgical specialities has proven favourable in complex situations. Selection of patients for co-management is full of difficulties. The aim of this study was to develop a clinical decision support tool to select surgical patients for co-management.
Material and Methods: Clinical data was collected from patient electronic health records with an ICD-9 code for colorectal surgery from January 2012 to December 2015 at a hospital in Lisbon. The outcome variable consists in co-management signalling. A dataset from 344 patients was used to develop the prediction model and a second data set from 168 patients was used for external validation. Results: Using logistic regression modelling the authors built a five variable (age, burden of comorbidities, ASA-PS status, surgical risk and recovery time) predictive referral model for co-management. This model has an area under the curve (AUC) of 0.86 (95% CI: 0.81 - 0.90), a predictive Brier score of 0.11, a sensitivity of 0.80, a specificity of 0.82 and an accuracy of 81.3%.
Discussion: Early referral of high-risk patients may be valuable to guide the decision on the best level of post-operative clinical care. We developed a simple bedside decision tool with a good discriminatory and predictive performance in order to select patients for co-management.
Conclusion: A simple bed-side clinical decision support tool of patients for co-management is viable, leading to potential improvement in early recognition and management of postoperative complications and reducing the ‘failure to rescue’. Generalizability to other clini-cal settings requires adequate customization and validation.
Keywords: Colorectal Surgery/methods; Cooperative Behavior; Decision Support Systems, Clinical; Failure to Rescue, Health Care; Patient Selection
RESUMO
Introdução: O aumento da esperança média de vida leva a que a população cirúrgica seja cada vez mais velha e frágil. Os modelos colaborativos de co-gestão entre especialidades médicas e cirúrgicas têm demonstrado ser favoráveis em situações complexas. A selecção de doentes para co-gestão está repleta de dificuldades. O objectivo deste estudo foi construir uma ferramenta de apoio à decisão para selecionar doentes de submetidos a cirurgia colo-rectal para co-gestão.
Material e Métodos: A informação clínica foi colhida dos processos clínicos electrónicos de doentes que tiveram um código ICD-9 de cirurgia colo-rectal no período de janeiro 2012 a dezembro 2015, num hospital em Lisboa. A variável resposta consiste na sinalização para co-gestão. Um conjunto de dados de 344 doentes foi usado para o desenvolvimento do modelo predictivo e, um segundo conjunto de dados de 168 doentes foi usado para a validação externa do modelo.
Resultados: Os autores construíram um modelo predictivo, de regressão logística, com cinco variáveis clínicas (idade, carga de co--morbilidades, ASA-PS status, risco cirúrgico e tempo de recobro) para predizer a selecção de doentes para co-gestão. O modelo tem uma área sob a curva (AUC) de 0,86 (95% IC: 0,81 - 0,90), um score predictivo de Brier de 0,11, uma sensibilidade de 0,80, uma especificidade de 0,82 e uma precisão de classificação de 81,3%.
Discussão: A sinalização precoce dos doentes de alto risco ajuda a definir o melhor nível de cuidados ao doente operado. Desen-volvemos uma ferramenta de apoio à decisão, simples, aplicável à cabeceira do doente com uma boa capacidade discriminativa e preditiva para seleccionar os doentes para co-gestão.
Conclusão: A selecção de doentes para co-gestão entre a cirurgia e a medicina interna permite o reconhecimento e a correcção precoce de complicações pós-operatórias reduzindo o ‘failure to rescue’. A ferramenta, uma vez customizada e validada, poderá ser aplicada em outros cenários clínicos.
Palavras-chave: Cirurgia Colorrectal; Comportamento Cooperativo; Falha da Terapia de Resgate; Selecção de Doentes; Sistemas de Apoio à Decisão Clínica
INTRODUCTION
There are two main models concerning the clinical management of medical problems in surgical patients.
In the traditional model the surgeon has the sole responsibility for the patient. If necessary, the surgeon requests the intervention of an internal medicine (IM) specialist.
Nowadays, there is a trend towards co-management (CM) models in which IM specialists manage the complex patient
1. NOVA Medical School|Faculdade de Ciências Médicas. Lisboa. Portugal. 2. Serviço de Medicina Interna. Hospital da Luz. Lisboa. Portugal.
3. Centro de Estatística e Aplicações. Universidade de Lisboa. Lisboa. Portugal.
4. Instituto de Engenharia Mecânica (IDMEC). Instituto Superior Técnico. Universidade de Lisboa. Lisboa. Portugal. Autor correspondente: Alexandra Bayão Horta. [email protected]
ARTIGO ACEITE P ARA PUBLICAÇÃO DISPONÍVEL EM WWW .ACT AMEDICAPORTUGUESA.COM
ARTIGO ORIGINAL regardless of the admitting specialty. Responsibility and accountability of patient care outside the operating room is shared between surgeon and IM specialists.1 The IM specialists assess acute issues and medical comorbidities (Cm) on a daily
basis, communicate with surgeons, integrate the intervention of other specialities and facilitate patient care transition from the acute care hospital setting. The relationship between surgeons and the IM specialists becomes highly collaborative. Both are involved in medical decision, along with other medical specialists, whenever needed.1-4 The benefits of CM have
been demonstrated in many studies, largely published since 2010.2-10
CM has been used specially in orthopaedic and neurosurgery patients and there has also been some experience with vascular and general surgery patients.3,5,7,8
Currently, around 310 million patients undergo surgery worldwide each year11-13 and estimates of attributable mortality
vary from 1% to 4%.14-17 More than one in five deaths occurs in a small group of high-risk patients.18-20 Failure to rescue
(FTR) is defined as hospital deaths after adverse events, namely postoperative complications. Comparison of FTR be-tween hospitals has provided a useful indicator of the quality of postoperative care in high income countries.21-24 Early
rec-ognition and management of the postoperative complications are important determinants of hospital mortality. Moreover, patients who suffer complications and survive, endure long-term functional disabilities and have a reduced life-span.20
General wards are the settings in which post-operative clinical deterioration is harder to detect.25 Early signalling of
patients for CM improves early detection of patient deterioration. The practice in some hospitals of referring all surgical patients to hospitalists3,7-10 may be potentially optimized by selecting a group of patients requiring special involvement.
Ide-ally, patients should not be elected solely on the basis of existing capacity, due to risks of medicalization and unnecessary cost. The risks inherent in adding complexity into patient care must be balanced against the potential benefits.26
Best practice entails identifying comorbid surgical patients during the outpatient preoperative process and directing patient care to the IM specialist upon surgical admission.2,27,28 However, identifying patients for CM is fraught with difficulties
due to the multiplicity and interaction of concurring factors for surgical outcome.
Existing prediction models using preoperative and intraoperative variables identify patients at higher risk of death.29,30
Most of these models are either complex, using many variables and rendering them unpractical for bedside use; or are old and do not consider the advances in minimally invasive techniques and more recent enhanced post-operative recovery programs.
Our study was conducted in a single clinical centre, where CM is offered to surgical patients in a non-structured way. We used clinical data of colorectal surgery patients only, in order to obtain a more homogeneous group regarding surgical procedures and the index operated organ, as well as less variability between surgeons.
The objective was to build a decision support tool, based on preoperative and immediate postoperative information, to help doctors select colorectal surgical patients for CM. The study included the development and the validation of the model in a different set of patients from the same hospital.
MATERIAL AND METHODS
This study was performed at Hospital da Luz, a 200-bed urban tertiary care and teaching hospital located in Lisbon. It was approved by the University’s and the Hospital’s ethics committees, respectively.
The information was collected from electronic health records (EHR) of patients with an ICD–9 code for colorectal surgery [45.7 (partial colectomy), 45.8 (total colectomy), 46.1 and 48.6 (Hartmann’s procedure), 48.5 (abdominoperineal resection) and 48.6 (anterior rectal resection)]. The dataset collected for the development of the model concerns patients who had a colorectal surgical intervention in the period between January 2012 and September 2014.
For the validation of the model a second dataset of the same hospital, with the same variables of the development set and following the same eligibility criteria, was temporarily and sequentially collected to externally validate the model for the period between October 2014 and December 2015.
Only patients above 18 years old were selected. Both elective and emergent procedures (if within 24 hours after admis-sion) were considered. Whenever there was more than one intervention in the same patient, only the first was considered for analysis.
CM was defined as the involvement of an IM specialist in the patient’s post-operative care.
The outcome variable consists of CM signalling and it is labelled 1 if the IM team is notified of the need to care for the patient at discharge from the recovery unit.
Data was collected from the electronic registers by two hospital physicians, in order to provide criteria uniformity. The collected variables (Table 1) are objective and include clinical and administrative data.
Surgical risk was considered as low, intermediate or high, according to the surgical-mortality probability model (S-MPM) score.31 It uses three risk factors: the American Society of Anaesthesiology Performance Status (ASA-PS) score, the
surgi-cal risk category (high, medium and low risk procedure) and the emergency status (emergent and elective).31
In our study, the overall burden of comorbid disease (Cm-Burden) is the patient’s total number of Cm. The Cm were selected according to the clinical experience and the literature, namely those from the original studies that led to the crea-tion of the Charlson Comorbidity index.32 The Cm considered for the Cm-Burden are: 1) In cardiovascular morbidity: rhythm
ARTIGO ACEITE P ARA PUBLICAÇÃO DISPONÍVEL EM WWW .ACT AMEDICAPORTUGUESA.COM ARTIGO ORIGINAL
disorders, valvular heart disease, ischemic heart disease, cardiac failure and peripheral vascular disease; 2) In pulmonary morbidity: chronic obstructive pulmonary disease (COPD) and asthma; 3) In renal morbidity: renal failure with creatinine> 1.5 mg/dL; 4) In endocrine morbidity: diabetes mellitus under pharmacological treatment; 5) In neuropsychiatric morbidity: cerebrovascular disease and Parkinson’s disease, uncontrolled epilepsy, dementia and psychiatric disease including major depression and addictions; 6) In gastrointestinal disease: inflammatory bowel disease, gastrointestinal bleeding, peptic disease and chronic hepatic failure; 7) In malignancy: cancer either solid or haematological and metastatic disease (other than basal cell skin cancer); and 8) In others: hypertension under treatment, coagulopathy, use of anticoagulants, skin infections or ulcers, connective tissue disease and HIV/AIDS.
Considering a model sensitivity of 80% and a prevalence of CM signalling of 18%, for a significance level α = 0.05 and an error of 10%, a sample size of 341 patients was needed.
There was no missing data. Statistical analysis
An exploratory analysis was carried out for all variables. Age was described with median (min - max) and categorical data were presented as frequencies and percentages.
Ordinal variables were dichotomized, and new binary variables created using the minimum p-value approach method. The variables that were recoded were Cm-Burden (Cm-Burden Bin: ≤ 2 and ≥ 3), ASA-PS (ASA-PS Bin: ≤ 2 and ≥ 3), S-MPM (S-S-MPM Bin: ≤ 5 and ≥ 6). Recovery time was also discretized (≤ 24h and > 24h) based on the partial function of a generalized additive model (GAM).
Data processing and modelling
We proceeded by fitting logistic regression (LR) models with the variables that were selected in the univariable analysis (p < 0.25). All the models were evaluated regarding their predictive performance through a calibration plot and Brier score (the lower the better, with a range between 0 and 1), and discriminative performance using the area under the receiver-operating characteristic (ROC) curve (AUC).33 No interactions between variables were identified.
The model was then tested in a different data set for external validation. Data from both sets were compared using chi-square and Mann-Whitney nonparametric tests, and also using the AUC of a multivariable membership model that predicts the probability of an individual to belong to the development set (considering as independent variables the same predic-tors and the outcome of the original version of the prediction model).34 An AUC lower than 0.70 suggests that the two sets
(development and validation) are similar.
Additionally, a customization was performed by fitting the original model (obtained with the development sample) to the ensemble of the two datasets.35
With the resulting CM probabilities estimates, a cut-off point maximizing sensitivity and specificity was obtained. We also estimated the accuracy (percentage of correct classifications), positive predictive value (PPV) and negative predictive value (NPV).
Analyses were performed using Stata 13 (StataCorp. 2013. Stata Statistical Software: Release 13. StataCorp LP, College Station, TX) and R (R: A Language and Environment for Statistical Computing, R Core Team, R Foundation for Statistical Computing, Vienna, Austria, year = 2018, http://www.R-project.org).
RESULTS
For the development set, data from 398 surgeries was collected, from which seven procedures were excluded because they were not primarily colorectal surgery and 47 because they were second procedures for the same patient in different admissions. For the external validation dataset, data from 212 surgeries was collected from which 44 procedures were excluded because they were second procedures for the same patient in different admissions (Fig. 1).
The dataset used for training the model contains the clinical records of 344 patients where 62 patients (18%) were referred for CM. However, 81 patients (23.5%) ended up by having CM in the ward, mostly because of unexpected medical or surgical complications.
Table 2 shows the baseline data for all patients of both the development and the validation datasets and corresponding comparison. The comparison showed that the variables that were different in the two sets were some of the Cm (COPD, CV, DM, metastatic disease, neoplasm), S-MPM, procedure risk, and open surgery.
The AUC of the membership model comparing both sets was 0.63 (95% CI: 0.58 - 0.68), confirming that globally the two sets are similar regarding the variables considered in the multivariable models.
The mean age of the patients was 65.5 years (minimum 26 and maximum 97) in the total cohort and 74.1 years (mini-mum 50 and maxi(mini-mum 97) in the CM group.
The preoperative diagnosis was neoplasm in 221 patients (64.2%) and 35 (15.8%) of these were referred for CM. Regarding the procedures, 21.2% were urgent, 53.7% were laparoscopic and the procedure risk was high in 47.4%. The median duration of hospital stay was 12.0 days (minimum two and maximum 161 days).
ARTIGO ACEITE P ARA PUBLICAÇÃO DISPONÍVEL EM WWW .ACT AMEDICAPORTUGUESA.COM
ARTIGO ORIGINAL The median of Cm per patient was 1.65. Seventy-six patients had no Cm and 19 patients had more than five Cm. There were 245 patients admitted to the intensive care unit (ICU) for the recovery period after surgery with a mean length of stay of 1.79 days (minimum one and maximum 26 days). Sixty-two patients were admitted to the intermediate care unit for the recovery period with a length of stay of 1.51 days (minimum one and maximum 10).
Of the 344 patients, 178 had at least one complication. From these, 49 (27.5%) had been referred for CM before the complication appeared and 68 (38.2%) ended up having CM. There were 40 (11.6%) patients returning to the Operating Room, of which 29 (72.5%) were admitted to the ICU for recovery after reoperation. Eight patients (2.3%) died during the study period.
Multivariable study Coding of predictors
As referred before, three variables - Cm-Burden, ASA-PS and S-MPM - were dichotomized using minimum p-value approach method, and recovery time was also discretized using GAMs’ partial functions plots (Fig. 2). A cut-off point of 24 hours was found, and accordingly, more than 24 hours in the recovery unit is associated with higher odds of CM.
Model specification
A univariable analysis was performed in the development dataset to identify which variables could potentially explain the outcome variable - CM signalling. Fourteen variables were identified.
Multivariable analysis (development set)
Results of the multivariable analysis are shown in Table 3.
Although without statistical significance, Cm-Burden and surgical risk were kept in the final multivariable model due to their clinical relevance in the present context. Age was associated with the outcome, revealing an increase of 4% in the odds of CM signalling for each yearly increase in age. Patients with more than three Cm had an increase of 68% in the odds of CM signalling. Higher values of the ASA score (≥ 3) was also shown to be associated with a 2.4-fold increase in the odds of CM signalling and, regarding surgical risk, a 66% increase was estimated for patients with high risk procedures. Recovery time, after being discretized, was also shown to be relevant in the context of the present study with patients with a stay in the recovery units longer than 24 hours having an approximately 6-fold increase in the odds of CM signalling. No interactions were identified in this data analysis.
The performance of the multivariable model showed an excellent discriminative ability, reflected by an AUC of 0.85 (95% CI: 0.79 - 0.90) and a predictive Brier score of 0.10 (the lower the better, with a range between 0 and 1).
Multivariable analysis (validation set)
The dataset used to validate the model had similar characteristics to the development dataset (Table 2).
The results from fitting the previous multivariable model to this external validation dataset remained good with an AUC estimate of 0.87 (95% CI: 0.81 - 0.93) and a Brier score of 0.12.
Multivariable analysis (ensemble set)
This multivariable model was built with both the development and validation sets. Results are shown in Table 3. Coef-ficient estimates obtained by this model were used to estimate the CM signalling probabilities.
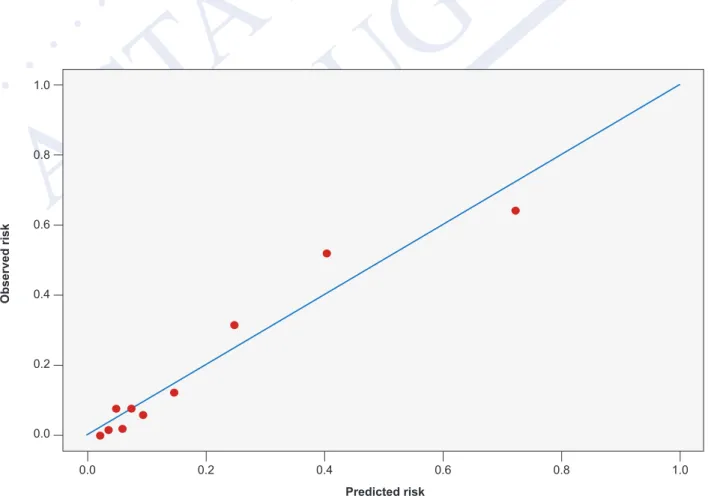
Age was associated with the outcome, with an increase of 4% in the odds of CM signalling for each yearly increase in age. Patients with more than three Cm and with higher values of the ASA score (≥ 3) had a 2-fold increase in the odds of CM signalling. Regarding surgical risk, a 56% increase in the odds of CM signalling was estimated for patients with high risk procedures. Recovery time, after being discretized, was also relevant in the context of the present study with patients with a stay in the recovery units longer than 24 hours having an approximately 6-fold increase in odds of CM signalling. The AUC of the model was 0.86 (95% CI: 0.81 - 0.90) and a 0.18 cut-off point of these probability estimates (above which the patient should be referred to CM), led to a sensitivity of 0.80, a specificity of 0.82, a PPV of 0.49, and an NPV of 0.95. The percentage of correct classifications was 81.3%. A calibration plot is depicted in Fig. 3.
To estimate the probability of CM signalling , the following formula was used: , where
Coefficient estimates were those obtained by the multivariable model fitted to the ensemble of both development and validation sets.
After obtaining , values higher than 0.18 support the decision of CM of the patient in the ward. ( )
=
ARTIGO ACEITE P ARA PUBLICAÇÃO DISPONÍVEL EM WWW .ACT AMEDICAPORTUGUESA.COM ARTIGO ORIGINAL DISCUSSION
The clinical progression of the operated patient is complex and dependent on many factors.
As perioperative risk appears to be concentrated within a small subgroup of surgical patients,36,37 early signalling of
these individuals may be valuable. To refer high-risk patients, clinicians should use a risk stratification approach that is ac-curate, simple and easy to use in order to ensure implementation.38
Most of the scores available in the literature are designed to predict mortality and, in only a few, morbidity.39-41 Placing
the focus on the need for CM in the ward, in previous studies we showed that it is possible in a anaesthetic clinic to pre-dict (with an accuracy of 77%, a sensitivity of 74%, a specificity of 78% and a negative prepre-dictive value of 93%) if patients need to be comanaged.42,43 However, the events in the operating room and in the first 24 hours of the recovery period were
not included in this analysis and, as we hypothesized that this information might be important to improve the results, we added another variable to the model. In fact, the ability of the single variable ‘recovery time’ to gather the ensemble of the complex interplay of different events and circumstances led to a simple and clear model with a very good performance us-ing only five variables. The selection of the variables to include in the model was determined by a statistical approach, but also the need for a tool that was clinically relevant. In fact, if we looked at the statistical rules only, the variables Cm-Burden and Surgical Risk have been excluded. However, as they are clinically important, we decided to keep them. Keeping these two variables adds relevant information to the model and both have OR estimates that confers risk with clinical relevance to the outcome (respectively 2.2 and 1.56).
Regarding the performance of the model, the discriminatory ability is good with an AUC of 0.85 in the developing data-set, 0.87 in the external validation datadata-set, and 0.86 in the ensemble set. The sensitivity and specificity obtained for this last model (considering the cut-off point of 0.18 for the probability estimate of CM signalling) were quite satisfactory (0.80 and 0.82, respectively). The accuracy was 81.3%. In fact, the analysis of the outliers from the multivariable model shows that, from the total of 19 patients who were previously not referred but who ended up co-managed, the model correctly predicted their need for CM in seven cases (35%) suggesting the model outperformed the empirical selection of patients for CM. To our knowledge, this is the first study to use an outcome intended to guide the practical clinical decisions on how to offer the best level of clinical care to the operated patient.
It does, however, have some limitations, namely 1) the origin of the dataset in a single centre limits the representative-ness and the size of the sample, 2) the single operated organ and, consequently, the limited number of procedures also requires further validation before application in other clinical settings, 3) the differences between the development and validation sets were not as pronounced as it would be desirable to ensure the generalizability of the results to other set-tings, and 4) the generalization of the model and its results are limited by the fact that some of the variables, including the outcome variable, are based in expert knowledge, so other medical opinions might lead to different results.
We intend to implement this tool in the hospital’s day-to-day practice and, in the future, monitor and fine tune if war-ranted.
This study adds some knowledge regarding to the implementation of practical measures to reduce the FTR of surgi-cal patients and, simultaneously, to promote a preventive attitude towards control of Cm in an increasingly older surgisurgi-cal population.
Despite the aforementioned limitations above, our methodological approach is most probably generalizable to other clinical settings, namely to other surgical procedures and other hospitals allowing for the development of other customized clinical support decision tools.
CONCLUSION
We built a tool to support the decision for selection of patients for CM. It allows this decision to be less empirical, less dependent on the experience of the doctors involved and, therefore, via its coding, more readily transmissible and useable by others thus streamlining the integration of objective evidence with individual expertise.
The tool, using information about Cm-burden, surgical risk, age, ASA score and time spent in the recovery unit achieved a good discriminative performance and an acceptable predictive ability.
By applying this model at the end of the 24 hour postoperative period to predict the need of CM in the ward setting, we expect a better management of the IM team allocation for CM in the wards and a reduction of the FTR of surgical patients, thus adding management reasoning to hospital practice.
ACKNOWLEDGEMENTS
The authors would like to thank Hospital da Luz and Grupo Luz Saúde for providing the necessary data for the develop-ment of this study
PROTECTION OF HUMANS AND ANIMALS
The authors declare that the procedures were followed according to the regulations established by the Clinical Re-search and Ethics Committee and to the 2013 Helsinki Declaration of the World Medical Association.
ARTIGO ACEITE P ARA PUBLICAÇÃO DISPONÍVEL EM WWW .ACT AMEDICAPORTUGUESA.COM
ARTIGO ORIGINAL DATA CONFIDENTIALITY Patients were not directly studied, and their informed consent was not deemed necessary because the data collected was retrospective and immediately anonymized.
COMPETING INTERESTS
There are no actual or potential conflicts of interest. FUNDING SOURCES
The work of A.L. Papoila and C. Geraldes is partially sponsored by national funds through Fundação Nacional para a Ciência e Tecnologia, Portugal—FCT under the project PEst-OE/MAT/UI0006/2014. The work of Cátia Salgado was supported by the PhD Scholarship SFRH/BD/121875/2016 from Portuguese Foundation for Science & Technology. S. M. Vieira acknowledges the support by Program Investigador FCT (IF/00833/2014) from FCT, co-funded by the European Social Fund (ESF) through the Operational Program Human Potential (POPH).
REFERENCES
1. Whinney C, Michota F. Surgical comanagement: a natural evolution of hospitalist practice. J Hosp Med. 2008;3:394-7.
2. Horta AB. Co-management ou responsabilidade partilhada entre a Medicina Interna e as especialidades cirúrgicas: a identificação dos doentes de alto risco. Med Interna. 2017;24:44-7.
3. Tadros RO, Faries PL, Malik R, Vouyouka A, Ting W, Dunn A, et al. The effect of a hospitalist comanagement service on vascular surgery inpatients. J Vasc Surg. 2015;61:1550-5.
4. Thompson RE, Pfeifer K, Grant PJ, Taylor C, Slawski B, Whinney C, et al. Hospital medicine and perioperative care: a framework for quality, high-value collaborative care. J Hosp Med. 2017;12:277-82.
5. Auerbach AD, Wachter RM, Cheng HQ, Maselli J, McDermott M, Vittinghoff E, et al. Comanagement of surgical patients between neurosurgeons and hospitalists. Arch Intern Med. 2010;170:2004-10.
6. Story DA, Shelton A, Jones D, Heland M, Belomo R, et al. Audit of co-management and critical care outreach for high risk postoperative patients (The POST audit). Anaesth Intensive Care. 2013;41:793-8.
7. Lizaur-Utrilla A, Calduch Broseta JV, Miralles Muñoz FA, Segarra Soria M, Díaz Castellano M, Andreu Giménez L. Eficacia de la asistencia compartida entre cirujanos e internistas para ancianos con fractura de cadera. Med Clin. 2014;143:386-91.
8. Sharma G, Kuo Y, Freeman J, Dong D, Goodwin JS. Comanagement of hospitalized surgical patients by medicine physicians in the United States. Arch Intern Med. 2010;170:363-8.
9. Rohatgi N, Loftus ÃP, Grujic ÃO, Cullen M, Hopkins J, Ahuja N. Surgical comanagement by hospitalists improves patient outcomes. Ann Surg. 2016; 264:275-82.
10. Rohatgi N, Wei PH, Grujic O, Ahuja N. Surgical comanagement by hospitalists in colorectal surgery. J Am Coll Surg. 2018 :404-10.e5.
11. Kahan BC, Koulenti D, Arvaniti K, Beavis V, Campbell D, Chan M, et al. Critical care admission following elective surgery was not associated with survival benefit: prospective analysis of data from 27 countries. Intensive Care Med. 2017;43:971-9.
12. Weiser TG, Haynes AB, Molina G, Lipsitz SR, Esquivel MM, Uribe-Leitz T, et al. Estimate of the global volume of surgery in 2012: an assessment supporting improved health outcomes. Lancet. 2015;385:S11.
13. Weiser TG, Regenbogen SE, Thompson KD, Haynes A, Lipsitz S, Berry W, et al. An estimation of the global volume of surgery: a modelling strategy based on available data. Lancet. 2012;372:139-44.
14. International Surgical Outcomes Study group. Global patient outcomes after elective surgery: prospective cohort study in 27 low-, middle- and high-income countries. Br J Anaesth. 2016;117:601-9.
15. Pearse R, Moreno R, Bauer P, Pelosi P, Metnitz P, Spies C, et al. Mortality after surgery in Europe: a 7 day cohort study. Lancet. 2012;380:1059-65. 16. Jhanji S, Thomas B, Ely A, Watson D, Hinds CJ, Pearse RM. Mortality and utilisation of critical care resources amongst high-risk surgical patients in a
large NHS trust*. Anaesthesia. 2008;63:695-700.
17. Glance L, Lustik S, Hannan E, Osler T, Mukamel D, Qian F, et al. The surgical mortality probability model. Derivation and validation of a simple risk prediction rule for noncardiac surgery. Ann Surg. 2012;255:696-702.
18. Abbott T, Fowler A, Pelosi P, Abreu M, Møller A, Canet J, et al. A systematic review and consensus definitions for standardised end-points in perioperative medicine: pulmonary complications. Br J Anaesth. 2018;120:1066-79.
19. Story D, Leslie K, Myles P, Fink M, Poustie S, Yap S, et al. Complications and mortality in older surgical patients in Australia and New Zealand (the REASON study): a multicentre, prospective, observational study. Anaesthesia. 2010;65:1022-30.
20. Khuri SF, Henderson WG, Depalma RG. Determinants of long-term survival after major surgery and the adverse effect of postoperative complications. Ann Surg. 2005;242:326-43.
21. Silber J, Rosenbaum P, Schwartz J, Ross R, Williams S. Evaluation of the complication rate as a measure of quality of care in coronary artery bypass graft surgery. JAMA. 1995;274:317-23.
22. Sinha S, Ozdemir B, Khalid U, Karthikesalingam A, Poloniecki J, Thompson M, et al. Failure-to-rescue and interprovider comparisons after elective abdominal aortic aneurysm repair. Br J Surg. 2014;101:1541-50.
23. Silber J, Rosenbaum P, Williams S, Ross R, Schwartz J. The relationship between choice of outcome measure and hospital rank in general surgical procedures: implications for quality assessment. Int J Qual Heal Care. 1997;9:193-200.
24. Pearse R, Holt P, Grocott M. Managing perioperative risk in patients undergoing elective non-cardiac surgery. BMJ. 2011;343:d5759.
25. Silber J, Rosenbaum P, Mchugh M, Ludwig J, Smith H, Niknam B, et al. Comparing the value of better nursing work environments across different levels of patient risk. JAMA Surg. 2016;151:527-36.
26. Cohen C, Flaks-Manov N, Low M, Balicer R, Shadmi E. High-risk case identification for use in comprehensive complex care management. Popul Health Manag. 2015;18:15-22.
27. Siegal E. Just because you can, doesn’t mean that you should: a call for the rational application of hospitalist comanagement. J Hosp Med. 2008;3:398-402.
28. Gillies M, Pearse R. Intensive care after high-risk surgery what’s in a name? Anesthesiology. 2016;124:761-2.
29. Sutton R, Bann S, Brooks M, Sarin S. The Surgical Risk scale as an improved tool for risk-adjusted analysis in comparative surgical audit. Br J Surg. 2002;89:763-8.
30. Bagnall N, Pring E, Malietzis G, Athanasiou, Fiaz O, Kennedy R, et al. Perioperative risk prediction in the era of enhanced recovery: a comparison of POSSUM, ACPGBI, and E-PASS scoring systems in major surgical procedures of the colorectal surgeon. Int J Colorectal Dis. 2018;33:1627-34. 31. Glance LG, Lustik SJ, Hannan EL, Osler T, Mukamel D, Qian F, et al. The Surgical Mortality Probability Model. Ann Surg. 2012;255:696-702.
ARTIGO ACEITE P ARA PUBLICAÇÃO DISPONÍVEL EM WWW .ACT AMEDICAPORTUGUESA.COM ARTIGO ORIGINAL
32. Charlson M, Pompei P, Ales K, Al E. A new method of classifying prognostic in longitudinal studies: development and validation. J Chronic Dis. 1987;40:373-83.
33. Steyerberg E. Clinical prediction models: a practical approach to development, validation, and updating. New York: Springer; 2009.
34. Debray T, Vergouwe Y, Koffijberg H, Nieboer D, Steyerberg E, Moons K. A new framework to enhance the interpretation of external validation studies of clinical prediction models. J Clin Epidemiol. 2015;68:279-89.
35. Mazumdar M, Glassman JR. Prognostic variables: categorizing a prognostic variable: review of methods, code for easy implementation and applications to decision-making about cancer treatments. Stat Med. 2000;19:113-32.
36. Pearse R, Harrison D, James P, Watson D, Hins C, Rhodes A, et al. Identification and characterisation of the high-risk surgical population in the United Kingdom. Crit Care. 2006;10:10-5.
37. Cook PA, Bellis M.. Knowing the risk. Public Health. 2001;115:54-61.
38. Sankar A, Beattie WS, Wijeysundera DN. How can we identify the high-risk patient? Curr Opin Crit Care. 2015;21:328-35. 39. Leung E, McArdle K, Wong L. Risk-adjusted scoring systems in colorectal surgery. Int J Surg. 2011;9:130-5.
40. Oliver C, Walker E, Giannaris S, Grocott M, Moonesinghe S. Risk assessment tools validated for patients undergoing emergency laparotomy: a systematic review. Br J Anaesth. 2015;115:849-60.
41. Protopapa K, Simpson J, Smith N, Moonesinghe S. Development and validation of the Surgical Outcome Risk Tool (SORT). Br J Surg. 2014;101:1774-83. 42. Salgado C, Fernandes M, Horta A, Xavier M, Sousa J, Vieira S. Multistage modeling for the classification of numerical and categorical datasets: 2017
IEEE International Conference on Fuzzy Systems, FUZZ 2017. 2017. doi: 10.1109/FUZZ-IEEE.2017.8015665
43. Horta A, Salgado C, Fernandes M, Vieira S, Sousa J, Papoila L, et al. Clinical decision support tool for Co-management signalling. Int J Med Inform. 2018;113:56-62.
Table 1 – Collected variables
Variables collected 1) Patient’s age at admission (years)
2) Urgency of the surgery (urgent/elective) 3) Open surgery (yes/no)
4) Type of procedure (anterior rectal resection, Hartmann, left hemicolectomy, right hemicolectomy, total colectomy, bowel anastomosis)
5) Procedure risk
6) Diagnosis for which the procedure was done (neoplasm, diverticulitis or other) 7) Presence of a specific preoperative comorbidity
a. Chronic obstructive pulmonary disease (COPD)
b. Cardio-vascular disease (CVd) (heart failure, ischemic cardiac disease, valvular cardiac disease, arrhythmic disease) c. Cerebrovascular diseases (CVD) (ischemic transient accident or stroke)
d. Neoplasm diagnosis (other than the disease for which the patient was being treated) e. Metastatic disease (including from the active disease for which the patient was being treated)
f. Arterial hypertension on treatment
g. Diabetes mellitus (DM) on pharmacological treatment h. Renal failure (with creatinine values above 1.5 mg/dL)
i. Other comorbidities (includes peripheral vascular disease, hypocoagulation, epilepsy, Parkinson disease, major
psychiatric disease including psychotropic addiction, inflammatory bowel disease, gastrointestinal haemorrhagic disease, gastrointestinal ulcerous disease, soft tissue ulcers or infection)
8) Burden of comorbidities (Cm-Burden) where 0 means that the patient does not have Cm*, 1 means 1 Cm, 2 means 2 Cm, 3
means 3 Cm, 4 means 4 Cm and 5 means 5 or more Cm.
9) American Society of Anaesthesiologists Physical Status classification system (ASA-PS) 10) Surgical Mortality Probability Model (S–MPM)
11) Recovery time (in hours)
ARTIGO ACEITE P ARA PUBLICAÇÃO DISPONÍVEL EM WWW .ACT AMEDICAPORTUGUESA.COM
ARTIGO ORIGINAL Table 2 – Baseline characteristics of patients of the development and validation datasets with corresponding comparisons1st set Total
n = 344 2 nd set Total n = 168 p 1 st set Referred n = 62 (18.0%) 2 nd set Referred n = 33 (19.6%) Patient characteristics n (%)
Mean age (min - max) 65.5 (26 - 97) 66.5 (26 - 94) 0.336 74.1 (50 - 97) 73.2 (49 - 89)
Preoperative diagnosis Neoplasm 221 (64.2) 116 (69)
0.282 35 (56,4) 26 (78.8)
Other 123 (35.8) 50 (29.8) 26 (41.9) 7 (21.2)
Individual comorbidities COPD* 32 (9.3) 6 (3.6) 0.020 7 (11.2) 2 (6.0)
CV** 60 (17.4) 18 (10.7) 0.047 20 (32.2) 9 (27.2) CVD*** 19 (5.5) 6 (3.6) 0.336 6 (9.6) 1 (3.0) Neoplasm 61 (17.7) 17 (10.1) 0.024 20 (32.2) 6 (18.1) Metastatic disease 7 (2.0) 10 (6.0) 0.020 0 (0.0) 6 (18.1) DM**** 33 (9.6) 30 (17.9) 0.008 11 (17.7) 5 (15.2) Arterial hypertension 196 (57.0) 89 (53.0) 0.392 45 (72.5) 23 (69.6) Renal 32 (9.3) 23 (13.7) 0.132 12 (19.3) 5 (15.2) Others 248 (72.1) 134 (79.8) 0.061 51 (82.2) 29 (87.8) Cm-Burden† 0 76 (22.1) 44 (26.2) 0.325 4 (6.4) 4 (12.1) 1 110 (32.0) 48 (28.6) 10 (16.1) 4 (12.1) 2 73 (21.2) 38 (22.6) 17 (27.4) 8 (24.2) 3 43 (12.5) 17 (10.1) 9 (14.5) 6 (18.1) 4 23 (6.7) 12 (7.1) 9 (14.5) 6 (18.1) ≥ 5 19 (5.5) 9 (5.4) 12 (19.3) 5 (15.2) Cm-Burden Bin ≤ 2 259 (75.3) 130 (77.4) 0.603 31 (12) 16 (48.5) ≥ 3 85 (24.7) 38 (22.6) 31 (36.5) 16 (48.5) Preoperative scores ASA-PS†† 1 28 (8.1) 12 (7.1) 0.744 0 (0.0) 0 (0.0) 2 245 (71.2) 119 (70.8) 29 (46.7) 18 (54.5) 3 63 (18.3) 32 (19.0) 28 (45.1) 11 (33.3) 4 6 (1.7) 5 (3.0) 4 (6.4) 4 (12.1) 5 2 (0.6) 0 (0.0) 0 (0.0) 0 (0.0) ASA-PS Bin ≤ 2 273 (79.4) 131 (78) 0.718 29 (10.6) 18 (54.5) ≥ 3 71 (20.6) 37 (22.0) 33 (46.5) 14 (42.4) S-MPM††† 1 16 (4.7) 6 (3.6) 0.003 0 (0.0) 0 (0.0) 2 9 (2.6) 7 (4.2) 0 (0.0) 0 (0.0) 3 139 (40.4) 92 (54.8) 10 (16.1) 10 (30.3) 4 88 (25.6) 20 (11.9) 16 (25.8) 8 (24.2) 5 33 (9.6) 24 (14.3) 7 (11.2) 6 (18.1) 6 24 (7.0) 5 (3.0) 13 (20.9) 4 (12.1) 7 30 (8.7) 11 (6.5) 13 (20.9) 3 (9.1) 8 4 (1.2) 3 (1.8) 2 (3.2) 2 (6.0) 9 1 (0.3) 0 (0.0) 0 (0.0) 0 (0.0) S-MPM Bin ≤ 5 285 (82.8) 149 (88.7) 0.084 33 (11.6) 24 (72.7) ≥ 6 59 (17.2) 19 (11.3) 29 (49.2) 8 (24.2) Procedure characteristics n (%) Urgent 73 (21.2) 31 (18.5) 0.465 20 (32.2) 8 (24.2) Open surgery (159; 46.2%) 159 (46.2) 47 (28) < 0.001 44 (71.0) 18 (54.5)
Surgical risk (High) 163 (47.4) 47 (28.0) < 0.001 45 (72.5) 18 (54.5)
Type of procedure Anterior rectal resection 123 (35.8) 48 (28.6)
0.365 9 (14.5) 6 (18.1) Hartmann’s 30 (8.7) 10 (6.0) 10 (16.1) 4 (12.1) Left colectomy 31 (9.0) 20 (11.9) 6 (9.6) 4 (12.1) Total colectomy 37 (10.8) 18 (10.7) 15 (24.1) 5 (15) Right colectomy 109 (31.7) 65 (38.7) 21 (33.8) 11 (33.3) Other 14 (4.1) 7 (4.2) 1 (1.6) 3 (9.1) Recovery time < 24h 271 (78.8) 135 (80.4) 0.679 24 (8.9) 13 (39.4) > 24h 73 (21.2) 33 (19.6) 38 (52.1) 19 (57.6)
1st set. development dataset; 2nd set. validation dataset; *COPD: chronic obstructive pulmonary disease; **CV: cardio-vascular disease; *** CVD; cerebrovascular disease; **** DM:
diabetes mellitus; Bin: binary; Cm: comorbidity; †Cm-Burden; burden of comorbidities; †† ASA-PS: American Society of Anaesthesiologists Physical Status classification system; ††† S-MPM: surgical mortality probability model.
ARTIGO ACEITE P ARA PUBLICAÇÃO DISPONÍVEL EM WWW .ACT AMEDICAPORTUGUESA.COM ARTIGO ORIGINAL
Figure 1 – Patient flowchart of the development and validation dataset
Development set Validation set
Analised surgical procedures
n = 398 Analised surgical proceduresn = 212
Patients included in the study
n = 344 Patients included in the studyn = 168
Patients not signalized for comanagement
n = 282
Patients not signalized for comanagement
n = 135 Patients signalized for
comanagement n = 62
Patients signalized for comanagement n = 33 7 non primary CRS excluded 47 second procedures of CRS in the same patient excluded 44 second procedures of CRS in the same patient excluded
Table 3 – Results of the multivariable analysis for the development, validation and ensemble datasets
Predictors OR estimates Development set Validation set Ensemble set
(95% CI) p OR estimates (95% CI) p OR estimates (95% CI) p
Age 1.04 (1.01 - 1.08) 0.016 1.03 (0.98 - 1.08) 0.335 1.04 (1.01 - 1.07) 0.010
Cm-Burden*≥ 3 1.68 (0.79 - 3.53) 0.170 3.97 (1.37 - 12.12) 0.012 2.17 (1.188 - 3.956) 0.011
ASA-PS**≥ 3 2.37 (1.11 - 4.99) 0.024 1.59 (0.53 - 4.64) 0.396 2.06 (1.115 - 3.762) 0.020
High surgical risk 1.66 (0.81 - 3.40) 0.164 1.59 (0.55 - 4.37) 0.378 1.56 (0.881 - 2.742) 0.124
Recovery time ≥ 24h 5.58 (2.80 - 11.24) < 0.001 10.40 (3.82 - 30.49) < 0.001 6.76 (3.859 - 11.956) < 0.001
Model performance
AUC 0.85 (0.79 - 0.90) 0.88 (0.82 - 0.93) 0.86 (0.81 - 0.90)
Brier score 0.10 0.11 0.11
Accuracy 80.0% 78.6% 81.3%
ARTIGO ACEITE P ARA PUBLICAÇÃO DISPONÍVEL EM WWW .ACT AMEDICAPORTUGUESA.COM ARTIGO ORIGINAL
Figure 2 – GAM function plot showing the cut-off point of 24 hours. Graphic of the GAM’s model showing the functional form of the as-sociation between the time of recovery and the co-management probability. The full curve represents the estimation of this functional form and the dashed curves represent the limits of the 95% confidential intervals estimated for each 24 hours in the recovery. Negative values mean a lower probability of management. At 24 hours we can see a change in the signal direction meaning that the probability of co-management is greater when the time of recovery is more than 24 hours.
Influence of recovery time in the odds of CM
Recovery time (days) -2 0 2 4 6 0 2 4 6 8 10 12 14 24h
Figure 3 – Calibration plot of the model considering the ensemble set
Observed risk Predicted risk 0.0 0.2 0.4 0.6 0.8 1.0 0.0 0.2 0.4 0.6 0.8 1.0