M
ASTER OF
S
CIENCE IN
A
CTUARIAL
S
CIENCE
M
ASTERS
F
INAL
W
ORK
I
NTERNSHIP
R
EPORT
R
ISK
A
NALYSIS AND
S
OLVENCY
I
MPACT OF THE
E
XPOSURE OF
P
ORTUGUESE
I
NSURANCE AND
P
ENSION
F
UNDS
S
ECTOR TO THE
P
ROPERTY
M
ARKET
F
RANCISCO
M
IGUEL
P
IRES
N
UNES
T
IAGO
L
OUREIRO
M
ASTER OF
S
CIENCE IN
A
CTUARIAL
S
CIENCE
M
ASTERS
F
INAL
W
ORK
I
NTERNSHIP
R
EPORT
R
ISK
A
NALYSIS AND
S
OLVENCY
I
MPACT OF THE
E
XPOSURE OF
P
ORTUGUESE
I
NSURANCE AND
P
ENSION
F
UNDS
S
ECTOR TO THE
P
ROPERTY
M
ARKET
F
RANCISCO
M
IGUEL
P
IRES
N
UNES
T
IAGO
L
OUREIRO
S
UPERVISORS
:
H
UGO
M
IGUEL
M
OREIRA
B
ORGINHO
J
OSÉ
F
ILIPE
N
UNES
J
ARDIM
Abstract
The origin and consequences of the financial crisis bursting in the summer of 2007 accentuate the concerns regarding the impacts of exposure to property linked assets in the stability of the financial system. In the scope of supervision of insurance companies and pension funds the emphasis lays upon the possible influence of these assets in the
perception of such undertakings’ financial and solvency positions, and capability to cover liabilities.
This text is the report of a curricular internship developed in the Portuguese Insurance and Pension Funds Supervisory Authority. The underlying study, performed in the Solvency II environment, targets the analysis of property related investments of the supervised entities, aiming to protect policyholders and beneficiaries from the potential impacts of this cyclical market, generator of systemic risk and financial bubbles.
Resumo
A origem e consequências da crise financeira com início no verão de 2007 acentuaram as preocupações relativas aos impactos da exposição a ativos imobiliários na estabilidade do sistema financeiro. No âmbito da supervisão de empresas de seguros e fundos de pensões a ênfase centra-se na possível influência destes ativos na aferição das posições financeira e de solvência, e capacidade de cumprir responsabilidades por parte destas entidades. Este texto é o relatório de estágio curricular realizado na Autoridade de Supervisão de Seguros e Fundos de Pensões. O estudo subjacente, realizado em ambiente de Solvência II, visa a análise do investimento em ativos imobiliários pelas entidades supervisionadas, para deste modo salvaguardar os tomadores de seguros e beneficiários dos potenciais impactos deste mercado cíclico, gerador de risco sistémico e bolhas financeiras.
Acknowledgements
I would like to express my gratitude to Autoridade de Supervisão de Seguros e Fundos de
Pensões for the opportunity of starting my actuarial career involved with cutting edge topics,
surrounded by colleagues with top-caliber skills and who are great people as well. I felt like part of the team since day one.
I acknowledge Professor Lourdes Centeno for the support and availability to help me secure this internship.
I am indebted to my supervisors: José Jardim and Hugo Borginho. I really need to thank José, not only for lending me his knowledge, but especially for his permanent availability. I want to mention Hugo for his confidence in me, guidance, and praise him on his ability to lead.
I dedicate not only this work, but this entire journey, to my parents and wife. To the force of nature that is my mom, who never lets me down. To the man of vision that is my father, who steered me in the right direction.
To my wife, who accumulates the position of my best friend and role model. I thank her for the support and belief in me, the maturity and will of accompanying me while taking a step sideways, before moving forward.
Contents
1. Introduction ... 1
2. The Portuguese real estate market ... 4
2.1. The immovable property market ... 4
2.2. The Real Estate Investment Funds market ... 6
3. The real estate exposure of insurance companies and pension funds ... 7
3.1. The dataset ... 7
3.2. Direct exposure of the supervised undertakings ... 7
3.2.1 The property portfolio of the insurance industry ... 7
3.2.2. The property portfolio of the pension funds sector ... 8
3.2.3. Geographical and seismic distribution of the supervised entities’ properties ... 8
3.2.5. Evolution of the direct exposure of pension funds ... 9
3.2.6. Insurers: valuation prudency and fitting in real estate indexes ... 10
3.2.7. Pension funds: valuation prudence and fitting in real estate indexes ... 13
3.3. Indirect exposure of the supervised undertakings ... 14
3.3.1. Indirect exposure of insurers ... 14
3.3.2. Indirect exposure of pension funds ... 15
4. Outlook of the supervised insurers and pension funds exposure to property ... 17
4.1. Overview of property exposure ... 17
4.2. Risks arising from property exposure ... 18
4.3. Framing property exposure into Solvency II ... 19
4.3.1. Mktprop: property risk capital charge ... 19
4.3.2. Concentration risk in case of immovable properties ... 22
5. Property appraisal and valuation on the insurance and pension funds industry ... 27
5.1. Valuation basics and accepted approaches ... 27
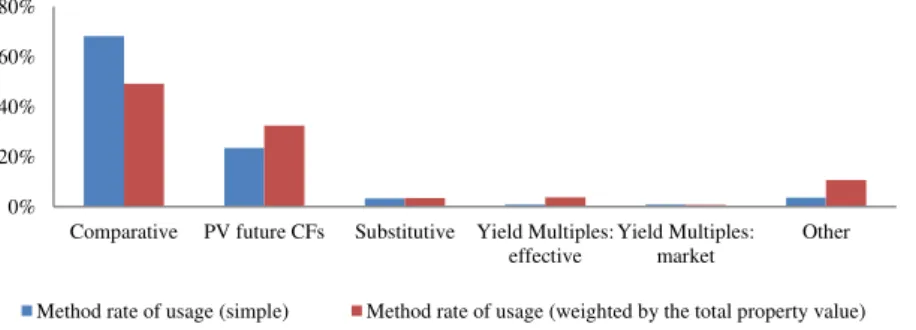
5.3. Appraisal methods in the insurance industry ... 31
5.3.1. Influence of the selected method in the appraisal’s accuracy or prudence ... 32
5.4. Appraisal methods in the pension funds industry ... 32
5.5. Appraisal features ... 33
5.5.1. Periodicity ... 33
5.5.2. Overexposure to appraisers ... 34
5.5.3. Compulsory second appraisal for properties exceeding a value threshold ... 35
6. Conclusions ... 37
A. Appendixes ... 39
A1. Assumptions for the dataset to property exposure ... 40
A2. Assumptions for empirical HPI comparison ... 41
A3. Commentaries on the sample used for empirical sales comparison ... 42
A4. Heterogeneity on appraisal terminology ... 43
A5. Advantages and disadvantages of the Substitutive method ... 44
List of Figures
Figure 1: Geographical and seismic distribution (EUR millions) of the properties detained by
the supervised insurers and pension funds. ... 8
Figure 2: Evolution of insurer's direct exposure and effects generating the losses (EUR
millions). ... 9
Figure 3: Evolution of pension funds’ direct exposure and effects generating the losses (EUR
millions). ... 9
Figure 4: Indirect exposure in the insurance industry (EUR millions). ... 15 Figure 5: Indirect exposure of pension funds. ... 16 Figure 6: Overview of exposure (EUR millions) and representativeness of property related
assets. ... 18
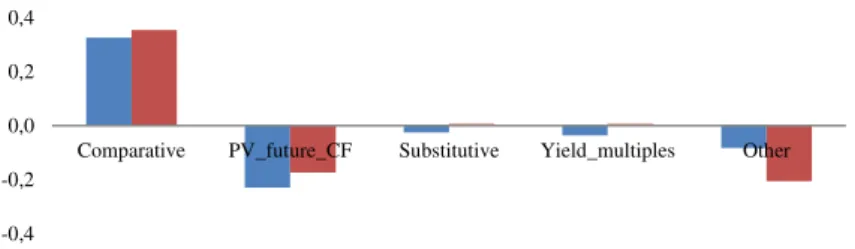
Figure 7: Appraisal methods: rates of usage in the insurance industry. ... 31 Figure 8: Appraisal methods in the Insurance industry: correlations with absolute deviation and
Losses. ... 32
List of Tables
Table 1: Empirical values for the insurance sector. ... 11
Table 2: Insurers: Empirical values for sales. ... 12
Table 3: Empirical values for pension funds. ... 13
Table 4: Pension Funds: Empirical values for sales. ... 13
Table 5: Insurers: total capital charges from property risk submodule (EUR millions). ... 20
Table 6: Capital charge: concentration risk in case of immovable properties (EUR millions). . 24
Table 7: Pension funds: aggregate capital charges from property risk submodule (EUR millions). ... 24
Acronyms and Abbreviations
ALM Asset-Liability Management
ASF Portuguese Insurance and Pension Funds Supervisory Authority
BIS Bank for International Settlements
BOF Basic Own Funds
CMVM National Supervisor for Financial Markets
CNSF National Council of Financial Supervisors
ECB European Central Bank
EIOPA European Insurance and Occupational Pensions Authority
EMF European Mortgage Federation
ESRB European Systemic Risk Board
EU-28 European Union at 28 member states
GDP Gross Domestic Product
HPI House Price Index
IASB International Accounting Standards Board
IAS International Accounting Standards
IFRS International Financial Reporting Standards
IMF International Monetary Fund
INE National Statistics Institute
IORP Institution for Occupational Retirement Provision
LoB Line of Business
NAV Net Asset Value
REIF Real Estate Investment Fund
REIT Real Estate Investment Trust
1
1. Introduction
This Actuarial Science Masters Final Work comprises a six-month internship involved in the endeavours of the Risk Analysis and Solvency Department (DRS) of the Portuguese Insurance and Pension Funds Supervisory Authority (ASF), starting at the 2nd March 2015. DRS’s mission is to operate under a risk-based perspective, aligned with European Insurance and Occupational Pensions Authority’s (EIOPA) developments, actively promoting the solvency, financial soundness and transparency of the insurance and pension funds industry.
This internship offered the possibility of dealing with the challenges headlining the present and shaping the future of the insurance landscape. The highlight goes, logically, to Solvency II, a
deep and comprehensive risk-based review of the regulatory and supervisory framework that the European (re)insurance companies must fit into, from the 1st January 2016 onwards. Also noteworthy is the exposure to the international developments pursuing the design of a regime with similar purposes to be applied to pension funds, which occurred in the form of a Quantitative Assessment (QA) and a Stress Test at the level of Institutions for Occupational Retirement Provisions (IORPs). These two experiences complement each other adequately, since while Solvency II is soon to be in force, the equivalent regime for pension funds is still
utterly open to assessment and reshaping, providing exposure to two outcome-equivalent regimes to be applicable to two key functional areas of an actuary, but at dissimilar points of maturation. Finally, the participation in the drafting of the annual report of insurance and pension funds activity, which is very helpful to take the pulse of the Portuguese market.
1.Introduction 2
In order to introduce the theme properly, it is essential to apprehend the influence of real estate linked investment in the shape of the financial system, due to the financial, economic and social impact it holds. It is also useful to distinguish real estate in two different perspectives: the underlying good alongside with the industrial process to produce and maintain it, from its price dynamics and consequences, role as an investment, an asset or a motivation to financial instruments.
From the first point of view, production techniques are developed and costs standardized, with efficient project management being the challenge. Regarding conservation, a predictive approach outperforms a merely reactive one, being more efficient and affordable, with costs estimated from the outset. The hold/usage expenses are acceptably manageable, except for taxes, which may change unilaterally.
So it is essentially in its dimension as a financial resource that property assets may become problematic, with the credit fed supply and demand spreading highly correlated default exposure, as financial institutions keep relevant portions of their portfolios as property related, since it should cover for a certain amount in liabilities in the case of insurance companies, and it
is taken as an asset by pension funds. The variation of real estate prices affects the consumer’s
wealth and eventually his confidence and investment attitude, conditions the sustainability of the construction industry and with it its role in the economy, and impacts the financial sector by exposing it to credit risk. Hence real estate property plays a key financial role, with potential systemic and pro-cyclical effects.
The property market displays cyclicality, with an upwards phase where credit underwriting is of easier access and more affordable, leveraging the demand and with it the prices, inflating speculative bubbles. During the downwards phase of the cycle, credit risk aversion increases, the credit access is constrained, prices drop due to lesser demand, hitting the resilience of the financial institutions involved and economy as a whole. Severe as the consequences of the burst of such bubbles are, the frenzy of the expansionary phase of the cycle still originates recurrence of the bubble state.
Furthermore the connection of property to “originate to distribute” financial techniques, issuing loans to financially engineer it in tranches and sell to investors, disseminating vastly the ramifications of default scenarios through secondary mortgage markets. Structured financial products involving pooling of credits are extremely dependent on the default correlation between the underlying assets. By pooling mortgage credits, it allows the tendency for different borrowers to default simultaneously, especially as the so called “normal correlations” increase
under stressed market conditions, an effect that Solvency II alerts for. Such approach, alongside
1.Introduction 3
States’ (US) financial assets, but infected the whole country and global banking systems. Tranches from such products were rated as bonds, implying that the probability of experiencing a loss was the same than in an equally rated bond. Banks were avid clients of such tranches, targeting regulatory arbitrage, as the corresponding regulatory capital required was
significantly lower than if holding the mortgages directly, and insurance companies, as the giant AIG, faced massive losses by issuing policies covering against losses in such products. In Portugal, mortgage loans securitisation funds ascended up to EUR35.000 million by 2009, dropping to less than 1/3 in mid-20131.
Property market developments have potential to damage the entire financial system, as it was the case for the recent global financial crisis triggered by the subprime segment of mortgage loans, with origin in the US but quickly spreading globally. Real estate bubbles also occurred in the UK (mostly London), Ireland, Spain or Iceland, to quote a few cases.
Monitoring this market is thus indispensable to prevent bubbles that may affect financial stability. A few examples of latent signals of property related crisis are an expansion of the gap between issued credit and GDP, total credit growth2, the landscape of credit conditions stimulating credit issuance, a risk tolerant and market aggressive attitude of credit institutions, elevated mortgage debt/total household debt ratio, enlarged representativeness of construction
in GDP, alongside with steep increase of property prices.
For the same line of reasons it is important, within the scope of ASF, to deepen the analysis on the exposure of the supervised entities to property, realizing how it evolved through time, especially under financial crisis stressed conditions, how it may influence their solvency position and ability to meet liabilities, contingently upon how accurately and opportunely value adjustments occur.
The agenda includes an overview of the Portuguese property market, at chapter 2, with special focus on the developments between 2010 and 2014, a period accounting, concurrently, for a financial crises and a depressed phase of the real estate cycle. In the third chapter the emphasis will be on the real estate linked investments of insurers and pension funds. Chapter 4 focuses on risks, providing an outlook of the ones incurred due to property exposure. For insurers the context will be linked to Solvency II in the form of Solvency Capital Requirements (SCR)
arising from property exposure. To attain similar insight for pension funds, the shocks established by the QA of IORPs to the submodule of property risk will be used. Still in the fourth chapter will be analysed the impact of property exposure in Asset-Liability Management (ALM), given the nature of liabilities. Chapter 5 focuses on the valuation process, aiming to connect methodologies to the developments verified in the supervised entities’ exposures. The final chapter is set for conclusions.
1 CMVM data.
4
2. The Portuguese real estate market
2.1. The immovable property market
The Portuguese market endured a significant hit with the financial crisis and the bailout program. It was registered a severe decrease of real estate investment, both residential and other, with fewer issued construction licenses and concluded undertakings.
From 2007/08 to 2012/13 the residential construction investment has fallen more than 50%, as house prices fell more than 10%3. The evolution of residential property market is linked to the banking availability to leverage it; across this period banks faced liquidity constraints and aversion towards credit default exposure. According to European Central Bank (ECB) and European Mortgage Federation (EMF), in 2013 the residential mortgage debt represented 64% of the Portuguese GDP.
Conditions to credit concession were tightened and the average bank valuation decreased4, which is connected with additional prudence from the banking industry with respect to default scenarios, and potentially with the uncertainty component of risk in the valuation. Coincidently the average Loan-To-Value ratio5 for residential mortgage loans dropped five percentage points
between 2007 and 2013 (64% in the latter). Such chain of reactions, justified by the amount of credit default at stake, produced pro-cyclical effects. The credit risk premium of banks (spreads) overpowered the EURIBOR, commanding the trend of interest rates. Both pre-crisis and
afterwards the prevailing typology of interest rate is variable, and it will remain as such, since more than 90% of new loans are issued attached to variable interest rates6. The typical mortgage maturity was evaluated in 2013 at 29 years, a top tier value at the European level, signalling that the wealth of Portuguese households is conditioned for long-term, due to home acquisition.
3 Source: Eurostat. 4 Source: INE.
2.The Portuguese real estate market 5
The residential market accumulated the most significant burden at mid-2013, slightly recovering since7. Worth mentioning, to analyse possible effects in the renting market, that the ratio between purchase and renting costs has fallen below 1 in late pre-crisis and remained in a descending tendency8. After aggregating the quoted shocks, the number of houses per head still displays a growing trajectory, unchanged by the financial crisis.
Office property market was also impacted by the descending phase of the cycle, hitting in 2013 historical minimums in the levels of demand and absorption. This segment is intimately linked to the corporate landscape, which tends to display lower confidence through severely depressed periods of economy, consequently the market value of such properties dropped as well, since the yields conveyed are significantly lower than in 2010. The exposed facts, alongside with favourable developments registered in 2014 on most office property market indexes 9 (
e.g.
number of transactions, average transactioned area, vacancy rates) suggest that, throughout this period, the evolution of office real estate is considerably correlated to residential, both being proportional to the shape of economy and the financial system.
The financial crisis severely impacted consumption, hence the retail property market as well. For the most part of this period the offer was barely expanded, as the already vast market and depressed consumption levels advised against financing, or investing in, such undertakings. Again, the second half of 2013 displayed market recovery10, similarly to the residential and office segments.
Anti-cyclically were implemented measures targeting foreign investment, as the attribution of
golden visas in exchange of purchasing a property priced above half a million euros. This
approach provided a considerable boost during the year of 2013, via the high-end market11. The Portuguese market benefits from foreign attraction towards southern Europe spreading beyond Spain. Despite the constraints of fiscal incentives arising from home purchase and the growth of municipal property taxes endured by Portuguese households, still national property taxes revenue (1.5% of GDP in 2012) is below the average for EU-28 (2.3%12 for the homologous period), reinforcing the perception of the country as an attractive property investment location.
Investors’ confidence has also strengthened due to the exit clean from the EUR78.000 million EU/IMF bailout and the forecast of 1.5% growth in GDP for 2015. Still some investors point the limited number of assets that can earn top return as the concern13.
7 Eurostat, BIS, National sources.
8 Ratio between the expenses, for a similar property and equal period of time, arising from acquisition or rental. 9 Source:
Jones Lang LaSalle (JLL) report on Portuguese real estate market (2014).
10 Source:
JLL.
11 Source: Banco de Portugal on direct foreign investment in Portuguese real estate. 12 Source: Eurostat.
2.The Portuguese real estate market 6
2.2. The Real Estate Investment Funds market
Portuguese REIFs14 became an investment alternative in 1985, but the market only matured when Portugal joined the Euro zone, as the elimination of currency risk with respect to most European countries contributed to the attraction of foreign investors. The market expanded until 2010, wavering since then at around EUR12.000 million in total Net Asset Value (NAV) 15 and
250 funds.
The total number of participants, which tended to revert to a mean of 120.000 participants since 2005, reached a maximum at mid-2010, slightly above 133.000 participants, decreasing 50% in the subsequent three-year period. The steep fall may be explained by the scarcity of attractive returns, while liquidity needs may also have forced some participants to drop their units. Although the number of participants registered such severe decline, the REIF market totals for NAV and number of funds did not endure a proportional hit, which is significantly due to the expansion of REIF investments by insurers, specially the Life sector.
The dominant types of property usage in REIFs’ asset portfolios are services (EUR4.000 million) and commerce (EUR2.500 million), both in slightly decreasing amounts since 2010. There is stronger investment in housing (EUR1.500 million by the end of 2012) and industry usage, as funds seem to promote diversification in this matter16. Since REIFs must keep real estate related investments as their core, such measures promote diversification. It is, nonetheless, a field of business where correlations tend to be significant, an effect hardly diversifiable under this framework, as shown in section 2.1, with properties from different segments declining in value throughout the crisis, and also by recalling the difficulties of REIFs to obtain attractive results after the burst of the crisis.
In 2015 the REIFs operating under national jurisdiction are programmed to be exempt of taxation on most returns, with taxes only applying at the level of fund unit holders, at the cashing-in of returns.
14 In this work the term Real Estate Investment Funds will be used, simplified as REIFs, since it corresponds to CMVM’s English
translation for “Fundos de Investmento Imobiliário”. This has been the vehicle available in Portugal for indirect exposure to real
estate throughout the period of analysis. Useful to bear in mind, though, that Portuguese legislators have been working on the introduction of a distinct vehicle of investment in real estate assets, the Real Estate Investment Trusts (REITs), in Portuguese
“Sociedades de Investimento em Património Imobiliário”. This investment vehicle was originally introduced in 1960 by the
American Congress, and already exists in the major European legal systems. REITs have historically been particularly important to attract capital to real estate investment, due to its particularly favorable fiscal regime.
15 Throughout the period of analysis, NAV remained above EUR12.000 million the majority of the time. From 2011 onwards there
have been periods of sustained decrease, but at the end of 2013 a combined value of EUR13.000 million was exceeded. In early 2014 is recorded a steep decrease.
7
3. The real estate exposure of insurance
companies and pension funds
3.1. The dataset
The analysis heading this chapter is based on the dataset assembled as ASF requested from the supervised undertakings information concerning their real estate investment positions as at 31st December of years 2010 to 2014. The set of assumptions established to deal with sources of noise in the data regarding the direct exposure is enclosed in appendix A1.
3.2. Direct exposure of the supervised undertakings
In this subsection, a brief description of the industry’s property portfolio is performed, and then the evolution of the exposure and embedded prudency is evaluated within our timeframe. Monetary values are expressed in millions of euros, unless stated otherwise.
3.2.1 The property portfolio of the insurance industry
For decades the insurance industry has been developing a real estate patrimony that fulfills investment, marketability and operational purposes. Taking as reference values in force at the end of 2014, around half of property patrimony entered portfolios before 1990. Mainly, insurance companies hold Income Property, i.e. yield producing property assets (the
representativeness of properties for own use is around one third, using as reference the held properties, and respective values in force, at the end of 2014). The directly held properties are mostly allocated to commercial17/offices purposes.
Direct exposure applies mainly to the Non-Life sector, and so will do the subsequent analysis and concerns, as its direct exposure is around seven times the homologous for Life18.
17 Generic label for property meant for the practice of commercial activities. Often literature links “commercial real estate” to
income production purposes, regardless of use.
3.The real estate exposure of insurance companies and pension funds 8
3.2.2. The property portfolio of the pension funds sector
Pension funds currently display considerably heavier direct real estate exposure than insurers; however such patrimony entered the portfolios much later. Taking values in force at 2014, more than 80% of such value entered portfolios already during the 21st century. Recalling that pension funds are often connected to other financial institutions, such evolution should be linked to the perception that, due to the long-term horizon of pension funds liabilities, the lack of liquidity arising from property exposure is more suitable to be allocated to their portfolios. The properties detained by pension funds are mostly destined to office usage.
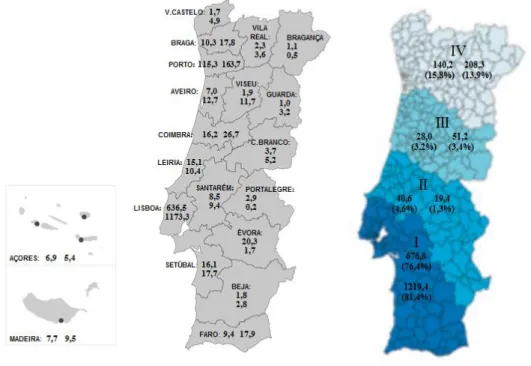
3.2.3. Geographical and seismic distribution of the supervised entities’ properties
Within the period of analysis, the properties detained are located in national territory. There is a predominance of properties located in the district of Lisboa, accompanied by an unbalanced distribution leaning towards the coast side of the country. For insurers, the district of Évora emerges as a noteworthy outlier, contradicting the reigning trend. Broadly, the islands tend to rank between the districts from the coast side and the ones from the interior.
Using as reference the property portfolios and values in force at the end of 2014, the following distributions are obtained. For each district or seismic zone19, the first value is meant for insurers whereas the second is for pension funds.
Figure 1: Geographical and seismic distribution (EUR millions) of the properties detained by the supervised insurers and pension funds20.
19 Basis: ASF seismic zones (Zone I corresponds to most intense seismic activity, Zone IV to fewest). (Açores: zone I, Madeira:
zone IV)
3.The real estate exposure of insurance companies and pension funds 9
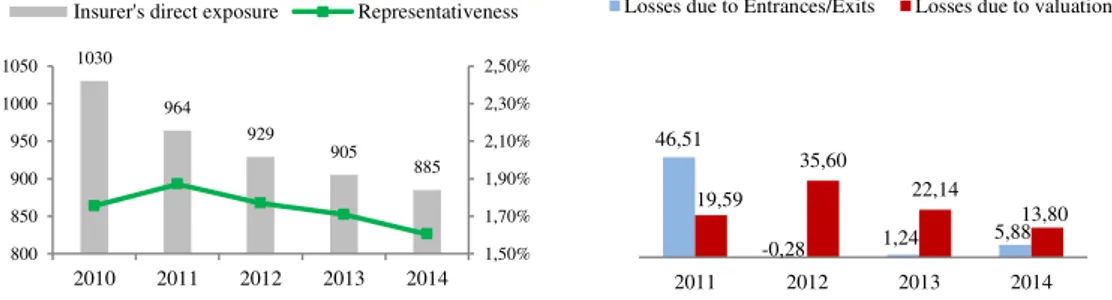
3.2.4. Evolution of the direct exposure of insurers
From 31/12/2010 to 31/12/2014, the direct exposure of insurers suffered a total 14% reduction, due to property portfolio entrances/exits21 and value variation of properties re-assessed meanwhile. One will pursue more granular detail on this regard, since it is entirely different if the reduction in value of property assets derives mostly from willingly unload properties (i.e.
exits overwhelming entrances), or mostly from decrease in asset value motivated by the valuation process. Using the dataset to deepen such conclusions, by isolating effects, it is observable that the valuation effect overpowered the entrances/exits contribution, commanding a trend of decline in property asset value as new appraisals took place.
Figure 2: Evolution of insurer's direct exposure and effects generating the losses (EUR millions).
The outlier is the amount in exits during 2011, justified by a particularly significant selling attitude of one insurer. But 2012, 2013, and even 2014, confirm 2011 as exception, since for 2012/13 virtually no impact arises from entrances/exits, but updated valuations generate dozens of millions in property value decrease. So, isolating the individual effect of one company in 2011, insurers seem to have interpreted that throughout financial turbulent times, and a depressed phase of the property market, it would be preferable to adopt a holding posture, rather than unload assets while worth bottom tier value.
Concurrently acquisitions occurred, generating that, from 2012 to 2014, the effect of property entrances/exits from portfolios did not caused a yearly decrease of exposure surpassing 1%.
3.2.5. Evolution of the direct exposure of pension funds
The direct exposure of pension funds endured a decline, mostly due to the valuation process.
Figure 3: Evolution of pension funds’ direct exposure and effects generating the losses (EUR millions).
21 Entrances/Exits nomenclature favors coherence. Entrances are equivalent to acquisitions, since a purchased property enters
portfolio at the acquisition value until further valuation. However the exits differ from the sales: once a property is sold there is the theoretical value that exits portfolio (valuation in force) and the effective amount the sale occurs at.
1030 964 929 905 885 1,50% 1,70% 1,90% 2,10% 2,30% 2,50% 800 850 900 950 1000 1050
2010 2011 2012 2013 2014 Insurer's direct exposure Representativeness
46,51
-0,28 1,24 5,88 19,59
35,60
22,14
13,80
2011 2012 2013 2014 Losses due to Entrances/Exits Losses due to valuation
1874 1816 1765 1686 1498 0,0% 2,5% 5,0% 7,5% 10,0% 12,5% 15,0% 0 500 1000 1500 2000
2010 2011 2012 2013 2014
Pension Funds' direct exposure Representativeness
4,90 10,37 3,24
91,05 52,25 40,85 75,98
96,81
3.The real estate exposure of insurance companies and pension funds 10
Again there is an outlier related with the level of exits, in this case at 2014, leveraged by the selling emphasis of two pension fund management companies. For the remaining period, entrances/exits produced a yearly reduction of exposure inferior to 1%, thus pension funds did not interpret this depressed period as suitable for property unloading.
3.2.6. Insurers: valuation prudency and fitting in real estate indexes
Prior analysis confirmed that throughout this period insurer’s properties devaluated and were mostly kept in the portfolios. Hence the point will precisely be if the held properties had its value readjusted coherently, or prudently, to the market22, to detect possible asset overvaluation,
i.e. artificial technical provisions coverage and protection of policyholders/beneficiaries.
To reach for such conclusions two complementary analyses will be performed: the comparison to a market index that should work as a benchmark, and the losses, or surpluses, generated as held properties were sold.
For market fitting, the choice fell on the House Price Index (HPI) 23. HPI expresses prices with
reference to their average value in 2010 (2010=100), and is proportional to the effect that real estate causes in the economy and the financial system, as it is extremely broad by being linked to dimension of property that is more extensible to all citizens: housing purposes.
It is coherent in first degree to economic principles, as it is obtained from the quoted price in active market for that specific asset, thus extremely reactive. Evidently the range of properties used as data to HPI production does not match the segments mostly sought-after by insurers, but one should retrieve that the focus is upon financial impact of real estate, rather than property features. Furthermore, as described in section 2.1, during the period of analysis the residential, office and retail segments registered analogous developments24, and recall 2.2, where is stated that REIFs could hardly obtain attractive returns despite promoting property usage diversification, proving that developments in these segments are not far apart.
In order to proceed with index fitting, the gathered values from property investment positions of insurers were treated in such a way that could make them classifiable into the index’s concept,
i.e. were empirically expressed with reference to the respective value at 2010. Some
assumptions were required, alongside with simple calculations; both are set in the appendix A2, alongside with extra commentaries on HPI.
Through a broad indicator of the Portuguese property market evolution, one can witness that prices took a considerable hit throughout this period. The quarterly HPI series (see appendix A2) shows that the hardest fall occurred at the second quarter of 2013, followed by a light
22 Valuations should have a minimum frequency of once every 3 years, and properties worth above EUR7,5 million require two
independent valuations, with the lower one standing. It should exist diversification among appraisers.
23 HPI describes the price developments of all residential properties purchased by households, both newly built and existing,
independently of their final use and independently of their previous owners. The Member States' HPIs are compiled by the National Statistical Institutes while the euro area and the EU aggregate HPIs are compiled by Eurostat.
Sources: National sources, BIS Residential Property Price database, http://www.bis.org/statistics/pp.htm
3.The real estate exposure of insurance companies and pension funds 11
recovery, still at the end of 2014 there is approximately a 10% loss when comparing to the reference of 2010=100.
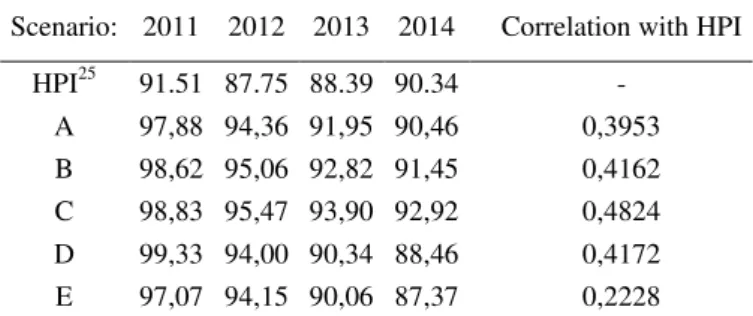
Let us now analyze the evolution of our empirical values obtained for insurers:
Scenario: 2011 2012 2013 2014 Correlation with HPI
HPI25 91.51 87.75 88.39 90.34 -
A 97,88 94,36 91,95 90,46 0,3953 B 98,62 95,06 92,82 91,45 0,4162 C 98,83 95,47 93,90 92,92 0,4824 D 99,33 94,00 90,34 88,46 0,4172 E 97,07 94,15 90,06 87,37 0,2228
A Excluding the properties for which assumptions were required to register either the sale price or appraisal values (common to all scenarios). Allowance for the presence of outliers.
B Removal of outliers, by considering as an outlier any property which during the period was valued at more than 200%, or less than 50%, of the reference level.
C Removal of outliers and only properties located in Lisboa. D Removal of outliers and only properties located in Porto.
E Removal outliers and only properties located neither in Lisboa nor Porto.
Table 1: Empirical values for the insurance sector.
It is observable that the evolution of insurer’s property values recognizes the occurrence of a downwards phase of the market. Notwithstanding, such appraisals took a considerable delay in reflecting the pace, and even the trend, of such developments, since while the market steeply fell in 2011, accumulating up to the harshest hit at 2012/2013, and lightly recovered since, insurer’s properties remain on descending trajectory still not touching the minimums the market verified two years ago. By the end of 2014, while the market is recovering and appraisals react with inertia, insurers’ property values are closer to the index than ever before, within this interval. Since this matching occurs while market and insures evolve on opposite trajectories, and the correlation between both is positive but lower than 0,5, it should be prudently considered that such circumstance may not be a solid symptom of reinforced accuracy on valuations.
The removal of outliers enabled to conclude that their presence functioned as prudency add-on,
pulling the insurer’s value nearer to the market’s (also correlation increases slightly from 0,3953 to 0,4162). But since the criteria for outlier label was quite bland, given how short the period of analysis is, it seems fair to consider that outlier removal is an enhancement to the sample. For extra detail, geographical segregation was tested, showing that properties in Lisboa were considered to have retained value better than the remaining. Since the reference index does not
25 Values selected from the HPI quarterly series for Portugal. For each year it was only selected the value for the fourth quarter, due
to comparability reasons, since in the data collection implemented by ASF the yearly property investment position is for the 31st of
3.The real estate exposure of insurance companies and pension funds 12
provide information detailed up to geographical level, no further conclusions can be added on this regard.
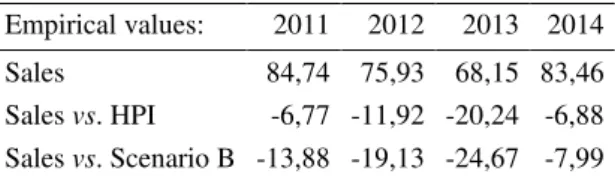
It is also useful to reproduce the same empirical reasoning using the sub-sample of properties sold throughout this period, by expressing their sale amount in function of their worth in 2010, and compare the outcome with both HPI and the evolution of insurer’s property values:
Empirical values: 2011 2012 2013 2014 Sales 84,74 75,93 68,15 83,46 Sales vs. HPI -6,77 -11,92 -20,24 -6,88 Sales vs. Scenario B -13,88 -19,13 -24,67 -7,99
Table 2: Insurers: Empirical values for sales.
As aforementioned, insurers did not display consolidated eagerness of unloading properties during this period, so the sub-sample for sales is not vast, especially as it is split yearly. The upside, though, is that sales may then be taken as performed by a willing, but not desperate, seller, hence their respective values are legitimate to analyze under market logic. By doing so, disturbing results are verified, as effective transactions occur at a shortfall hardly accounted for by the pace insurers adjust valuations. Additionally, HPI was a far better estimate of what to
expect when insurer’s properties hit the market, rather than their own valuations. In the previous table is shown that the discrepancies between real values for insurers (i.e. effective sales) vs.
theoretical values for insurers (i.e. appraisals in force by the time of sale) are much greater than
the ones between effective sales vs. the generic HPI.
For the sake of intellectual honesty, it should be mentioned that part of these deviations certainly arise from the fact that while the official HPI is computed with reference to effective sales in 2010 (therefore reflecting 100% of the shock suffered by the market up to that point), the empirical values for insurers were obtained with reference to the valuations in force at 31st December 2010, which were not already capturing all the burden endured by the market until then, dragging artificially to the period of analysis some inaccuracies26 whose inception actually occurs between 2008 and 2010, at the earlier stages of the crisis. Other criticism that may be pointed out is that while HPI only incorporates prices, the empirical analysis performed above
uses values as reference but also uses prices. Although from a purist’s point of view such mix is
undesirable, value should function as an unbiased estimator of price, and especially as we link
the issue to real estate, a seller expects to sell a property by an amount similar to the valuation in force, because under the interpretation of absence of material changes in value, therefore no need for updated valuation, value is not supposed to be an inflated forecast of price27.
26 Note that if the values in force at 31.12.2010 were already more accurate (lower) the perception of downwards adjustment in the
following years could be even smaller.
27 Conceptual differences settled by
3.The real estate exposure of insurance companies and pension funds 13
Still it is a matter of deep concern that when properties from insurers’ portfolios hit the market, the amounts yielded by the transactions are better predicted by an arguably too generic property index, than by the valuations in force, which are supposed to be calibrated to each individual property.
Complementarily, one can affirm that through this period insurers took to the market a set of properties28 whose valuations programmed cashing-in a total of EUR55,8 million, but yielded just EUR46,1 million, thus generating a EUR9,7 million loss. This shortfall corresponds to about 17,4% of the total estimated worth, sustaining that properties have been overvalued or market decay poorly reflected. In the appendix A3 there are further references for this analysis.
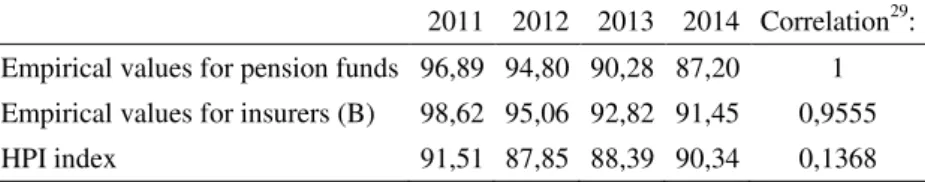
3.2.7. Pension funds: valuation prudence and fitting in real estate indexes
Once more, the focus is to comprehend if the decrease in property value is market coherent, or prudent, and to attain comparability between pension funds and insurers as well, will be applied an equivalent empirical reasoning:
2011 2012 2013 2014 Correlation29: Empirical values for pension funds 96,89 94,80 90,28 87,20 1 Empirical values for insurers (B) 98,62 95,06 92,82 91,45 0,9555 HPI index 91,51 87,85 88,39 90,34 0,1368
Table 3: Empirical values for pension funds.
Pension funds display a superior level of prudency, despite the lower correlation with HPI of such empirical values than the homologous for insurers. The empirical values for pension funds and insurers display almost a perfect correlation, suggesting that both industries reveal a degree of delay to reflect in their direct exposure the developments of property market.
Extending such logic to sold properties, summarized in the following table, in 2011/12 pension funds performed selling deals with very low decrease in value with reference to 2010. During 2013 the value decrease was larger, but the retained worth of the sub-sample of sold properties still outperformed HPI. In 2014 losses occurred, as sale values were underwhelming given both the estimate of current worth by the appraisal in force, and the decrease in value, with respect to 2010, predicted by HPI. This should be, at least partially, connected with the unusual selling appetite of two pension funds affecting regular market logic.
Empirical values: 2011 2012 2013 2014 Sales 98,08 98,76 91,04 78,59 Sales vs. HPI 6,57 10,91 2,65 -11,75 Sales vs. Pension Funds’ values 1,19 3,96 0,76 -8,61
Table 4: Pension Funds: Empirical values for sales.
28 Subsample of outflowing properties for which no assumptions were required (71% representativeness, in value, of the set of
properties exiting portfolios).
3.The real estate exposure of insurance companies and pension funds 14
The positive differences in Sales vs. HPI and Sales vs. Pension Fund’s values do not mean that
pension funds were undervaluing properties at some point. Given the differences in sample size, such conclusions are not plausible to extrapolate to the whole property portfolio, also because throughout this period pension funds sold a set of properties valued at a total of EUR177,9 million, cashing-in a total of EUR159,1 million, thus experiencing a negative surplus of EUR18,8 million, i.e. a 10,6% loss. Definitely worth reference that above 90% of the EUR18+
million losses took place within 2014, which was a particular sub-interval due to the quoted reasons. Isolating such contribution proves that superior appraisal prudency results in greater matching between expected worth and actual worth once property assets are cashed-in.
Additionally, pension funds are likely to have finished 2010 with property values more in line with the market than insurers, enabling that although posterior decreasing adjustments are not as significant as HPI, losses arising from sales are lower (10,6% vs. 17,4%).
It was expectable that pension funds would display superior prudence on property values, given the features of the respective liabilities, which put less immediate pressure on asset valuation.
3.3. Indirect exposure of the supervised undertakings
Subscribing REIFs allows for distancing from management, operation, depreciation dynamics of the good itself, or conservation, in favor of a strictly yield oriented equity approach. That
preference was expectable, as most corporates opt for subcontracting such services, rather than dealing directly with it.
Hence, given the investment nature of the insurance or pension business, linking the involvement in property markets to a holding investment units perspective is relatively natural.
It enables to interpret property assets as purely financial securities, to monitor returns simply through the value of the REIF’s unit, and dividends potentially paid, while cutting on valuation expenses.
Indirect exposure offers a more straightforward way to diversify real estate investment, to invest internationally, or to pursue returns in expansionary markets, through investment vehicles in
general subjected to prudential supervision themselves.
3.3.1. Indirect exposure of insurers
The indirect property exposure, unlike direct ownership, is leveraged by the Life sector. The supervised insurers largely favor the underwriting of Portuguese REIFs over foreign, with Life insurers significantly more exposed in either case.
3.The real estate exposure of insurance companies and pension funds 15
Figure 4: Indirect exposure in the insurance industry (EUR millions).
Although the quoted REIFs’ redeems may have been inevitable due to liquidity reasons, or actually meant as a shift of investment direction motivated by skepticism about real estate returns, still the Life sector became considerably more exposed to a segment that one in every two investors was leaving. This expansion of exposure is, nonetheless, concentrated on a single Life insurer, and via REIFs related to the same economic group.
Given the scale of the Life sector investment, the Non-Life plays a diminished role in terms of global indirect exposure, as underwriting, redeems and oscillations in the REIFs’ unit value
combine for a relatively unchanged level of exposure. It is worth mentioning that the Non-Life’s
course of actions is far from neutral: the number of units held in 2013 more than doubles the number of units held in 2010 (whereas in 2012 it was lower). Such variations may be interpreted as the Non-Life sector strategically pursuing reinforcement/releasing of indirect property investment, contingent upon unit value evolution. The total level of investment remains stable, because the average value of the REIF unit held in 2013 dropped to less than half of the correspondent in 2010, neutralizing the potential effect in indirect exposure of the reinforced underwriting.
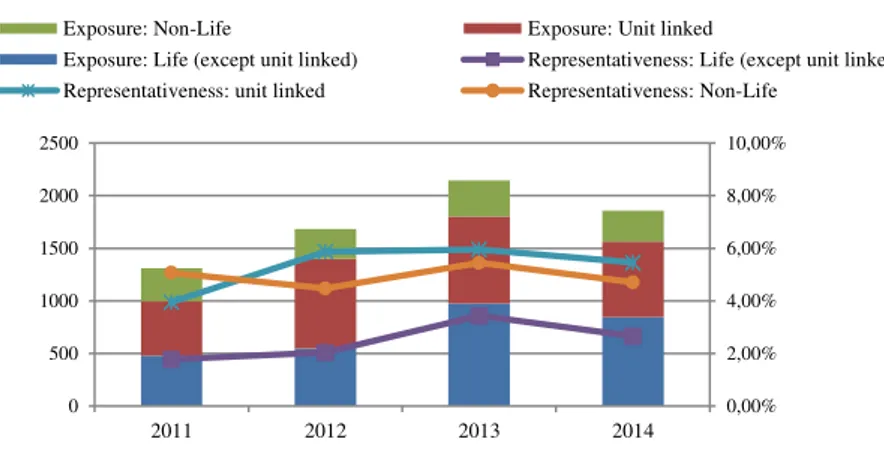
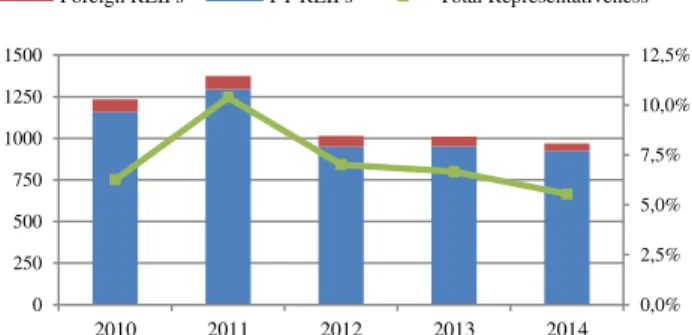
3.3.2. Indirect exposure of pension funds
Pension funds launched the period of analysis with vaster indirect exposure than insurers, the situation was reversed due to the increased underwriting performed by the Life sector.
In terms of number of units, is observed significant subscription of foreign REIFs, deriving almost uniquely from the investment activity of a specific pension fund management company. Nevertheless, national REIFs represent the vast majority of the financial indirect exposure.
0,00% 2,00% 4,00% 6,00% 8,00% 10,00%
0 500 1000 1500 2000 2500
2011 2012 2013 2014 Exposure: Non-Life Exposure: Unit linked
3.The real estate exposure of insurance companies and pension funds 16
Figure 5: Indirect exposure of pension funds.
At the beginning of the period of analysis occurred a reinforcement of underwriting, followed by a considerable number of redeems in 2012. Since then, the level of attraction towards REIFs (i.e. number of subscribed fund units) remained stable, with the level of tied-up capital evolving
accordingly. The almost perfectly negative correlation between subscription of units and average value of the unit held (-0,9754), suggests a common embedded strategy of subscription at lower tier value, to redeem at higher tier one.
0,0% 2,5% 5,0% 7,5% 10,0% 12,5%
0 250 500 750 1000 1250 1500
17
4. Outlook of the supervised insurers and
pension funds exposure to property
This chapter presents the overview of property exposure (4.1), followed by the respective risk analysis (4.2) and solvency impact (4.3 and 4.4). In subsection 4.5, the ALM role of property assets is discussed, given the nature of liabilities.
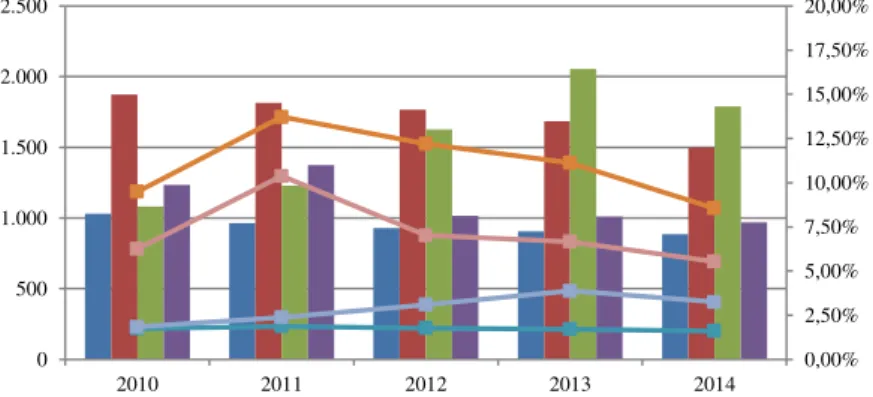
4.1. Overview of property exposure
Throughout this period, the total property investment of insurers surpassed the homologous for pension funds, despite the almost EUR1.000 million gap registered initially. This reversion is mostly justified by the growth of indirect exposure of the Life sector, notwithstanding the particularity mentioned in the section 3.3.1.
For insurers, the direct and indirect exposures were strongly negatively correlated (-0,8955), as the Life sector’s exposure to REIFs expanded while Non-Life lost value in held properties. Concurrently, for pension funds, both exposures were considerably positively correlated (0,7250).
All supervised undertakings lost value on direct property ownership, despite acknowledging it differently on their asset portfolio re-valuation. Non-Life and pension funds treat REIF units exactly as shares, with an embedded strategy of purchasing at lower value and redeeming at a higher one, operating in short cycles.
4.Outlook of the supervised entities’ exposure to real estate 18
Figure 6: Overview of exposure (EUR millions) and representativeness of property related assets.
4.2. Risks arising from property exposure
By directly owning property, insurance companies and pension funds become exposed to a set of risks debated in this subsection.
Liquidity risk plays a key role, as owned properties are highly illiquid assets, their transactions involve temporal costs and, especially under liquidity pressure, may yield an amount considerably beneath their projected value. There is the strategic risk of investing in a cyclical type of market, recurrently revisiting a depressive state, alongside with speculation risk due to exposure to a market likely to generate bubble scenarios, and diversification risk, since property
market tends to fall as a whole, jeopardizing diversification among the same class of assets. It should also be considered the pro-cyclicality risk, given that when the cycle enters downwards motion then most of the market players30 tend to display extended risk aversion, aggravating the market shape, and hedging risk, as there are no matured mechanisms to directly hedge against
property-linked losses. The valuation process generates exposure to the systematic, and non-diversifiable, uncertainty component of risk, due to inaccuracies in appraisal models/parameters. Considering that insurers and pension funds invest mostly in income properties, there is exposure to vacancy risk arising from insufficient demand.
The effectiveness of these risks is proved by the scarcity of REIFs attaining attractive returns during depressive phases of the cycle, but may be mitigated for insurers and pension funds purely because, unlike REIFs, property investment is not their core activity, thus the exposure is smaller. Nonetheless, for supervisory reasons it is important to be aware of these risks, because exposure to cyclical and speculative markets for which the typical risk mitigation techniques are
30 Particularly credit institutions, which leverage the market while exposing themselves to default risk.
0,00% 2,50% 5,00% 7,50% 10,00% 12,50% 15,00% 17,50% 20,00% 0 500 1.000 1.500 2.000 2.500
2010 2011 2012 2013 2014
Direct exposure of Insurers Direct Exposure of Pension Funds (PF) Indirect exposure of Insurers Indirect exposure of PF
4.Outlook of the supervised entities’ exposure to real estate 19
hardly feasible, and where liquidity is constrained, may ultimately affect policyholders and beneficiaries.
Then there is catastrophic risk arising from holding immovable goods, which is insurable, legal risk as legislation changes may impact income generating capability or add expenses other than taxes (e.g. compulsory energetic certificates for transactioned properties, possible shortening of
the period among consecutive appraisals), and tax risks as property taxes are a vehicle to increase sovereign or municipal income. It should also be mentioned thedepreciation risk from holding an asset that, by nature, endures physical wear down and becomes economic and functional obsolete at a pace linked to conservation, and conservation risk itself, from exposure to the interconnectedness between the deferment of the property’s obsolescence, its lifespan and net income generating capability. Operational risk may be included, in a broad manner.
For the indirect exposure, the risks quoted in the immediately previous paragraph will only apply in a collateral form, with potential impact in the value of the REIF unit. The remaining risks are however applicable to indirect exposure, with exception of liquidity issues, which may be assuaged.
4.3. Framing property exposure into Solvency II
For the case of insurers, property exposure will be linked to the regulatory capital charges specified by Solvency II, which are meant to be proportional to risk exposure and reflect the
change in the excess of assets over liabilities, from normal conditions to after-shock ones. The shocks are designed to portray an unfavourable development in a type of risk, impacting the value of assets and liabilities exposed to it. The submodules that must be taken in account both belong to the module of market risk, and are property risk (subsection 4.3.1) and concentration risk in case of immovable properties (4.3.2), if applicable.
4.3.1.
Mkt
prop: property risk capital charge
Property risk arises from the sensitivity of assets, liabilities and financial investments to the level or volatility of property market prices. The SCR for property risk (Mktprop) is obtained as:
Mktprop = Max (ΔBOF│propertyShock; 0)
with: BOF = Net value of assets - Liabilities
The property shock is the immediate effect on the net value of assets and liabilities in the occurrence of an instantaneous decrease of 25% in the value of investments in immovable properties, taking in account all the direct and indirect exposures to property prices31.
31 The scenario should be set without taking in account the loss absorbing capacity of technical provisions (TP),
i.e. the change in
the value of TP due to benefits is somewhat conditional or discretionary. When one accounts for it, obtains nMktprop, the capital
4.Outlook of the supervised entities’ exposure to real estate 20
For the supervised insurers, the Mktpropfor each exercise year may be taken as the impact on
assets of a 25% loss of value in property, yielding that the market’s aggregate values would be:
Dec-2010 Dec-2011 Dec-2012 Dec-2013 Dec-2014
Mktprop 541 574 664 778 699
Table 5: Insurers: total capital charges from property risk submodule (EUR millions)32.
To obtain individual company values, the aggregate value would be split between each exposed insurer, proportionally to the weight of its exposure in the total for the industry. For 2014, the capital requirement for this submodule exhibits representativeness of 7,5%, 21,7% and 8,3%, respectively for Life, Non-Life and composites, in the total SCR for the market risk module, before considering diversification benefits.
Quantifying the SCR for property risk stresses the relevancy of this work by displaying the role of Mktprop in Basic Own Funds (BOF) consumption, although the burden could be assuaged due
to diversification effects, as the capital charges for different submodules are combined. It is also a synonym of Solvency II’s concerns towards property exposure, the appraisal process, and the
perils of targeting fair values in the absence of univocal standards.
Up next, are presented statistical tests which enable to argue that, for the national market, the prescribed 25% shock cannot be considered excessive, at least given the evidences unveiled during this period.
First statistical test: Examining the existence of overall bias in the valuation of
insurer’s directly hold properties.
Previous note:
The following reasoning is inspired by the signs tests lectured in Actuarial Topics during the
Master, at the time regarding the exam of the existence of overall bias in graduation processes applied to crude mortality rates obtained from mortality studies.
Framework:
Previously it was performed a quantitative analysis centered on the losses/gains arising from relationship between sale price and valuation in force. Here the scope will be to search for
statistical evidence of possible overall bias in the valuation process.
Assumptions:
Firstly, the cases where properties were sold within a 10% deviation (above or below) of their value in force will be considered as accurate. Then it will be searched for statistical evidence of
4.Outlook of the supervised entities’ exposure to real estate 21
global bias for the properties valued inaccurately, which is to say if there is a systematic scenario of overvaluation or undervaluation, given inaccuracy.
There are 61 trials (transactions associated with a deviation superior to 10% of the expected property value). If there is no overall bias in the valuations, then, in case of inaccurate valuation, negative and positive deviations should be equally likely. Hence:
P= “number of positive/negative deviations” ~ Binomial (61; 0,5)
For the null hypothesis:
H0: Approximately the same number of positive and negative deviations are expected, i.e. no
systematic bias in the appraisals.
Test:
The observed number of negative deviations (losses) is 42, while the positive (gains) is 19. Using a p-value approach, that provides insight about the probability of a scenario equally or
more extreme than the one foreseen by the null, given the observed evidences:
p-value≅ 2 × Prob. (P≤ 19) = 0,0044.
Conclusion:
Since the p-value is << 5% we find strong statistical evidence to reject the null, for such
significance level. Thus there is indeed systematic bias in the appraisals, which, linked to previous acknowledgements, leads to the conclusion that overall bias is in favor of overvaluation.
Second statistical test: P
roportionality between Solvency II’s
25% downwards
property shock and the insurance industry appraisal
’s
landscape.
Here will be considered a weaker measure of accuracy, allowing for 20% deviation (for any side) and still take the valuation as accuracy. The sample is reduced to 46 trials.
Such a bland consideration for accuracy aims to analyze if the size of the shock programmed by Solvency II is a proportional protection measure, given the developments in the appraisals requested by insurers. In this case:
P= “number of positive/negative deviations” ~ Binomial (46; 0,5)
Test:
By defining the same null than previously, having 31 negative deviations (losses) and 15
4.Outlook of the supervised entities’ exposure to real estate 22
p-value≅ 2 × Prob. (P≤ 15) = 0,0259.
Decision:
Since the p-value is < 5% there still is statistical evidence to reject the null. Thus there is
systematic bias in the appraisals remaining as inaccurate under such weak accuracy criteria.
Conclusion:
If the procedure is repeated while allowing for 25% deviation (again for both sides) as still an accurate valuation, then the null can finally be not rejected, for the 5% significance level.
So, considering evidences of the quoted period of time, if there is the need for 25% tolerance as accuracy criteria to not reject the non-existence of overall bias in the valuations, then the size of the property shock established by Solvency II does not seem to be disproportionate. In fact, for
this period, the 25% programed fluctuation seems to be more within appraisal inaccuracy territory than simulating an objective downwards shock in the value of property investments supposedly kept at fair value.
A summary of the latter test:
Keeping the null hypothesis, and with:
P= “number of positive/negative deviations” ~ Binomial (40; 0,5)
Were observed 26 negative deviations and 14 positive ones. And:
p-value≅ 2 × Prob. (P≤ 14) = 0,0807 > 5% ⇒ Thus do not reject the null.
4.3.2. Concentration risk in case of immovable properties
Concentration risk arises from inadequate diversification, generating an excess of volatility that could be otherwise diversified away. In property context, overexposure corresponds to exceed the threshold of a single property33 weighing more than 10% of the company’s total assets,
whether via direct ownership or indirect exposure.
While for direct ownership it is straightforward, the indirect exposure would formally require a
look through approach to the subscribed REIFs, to identify the actual assets the underwriter is
exposed to. Such analysis enables to fulfil a Solvency II principle of substance over form, which
in this case translates into decomposing indirect exposure into the (mostly) property assets the insurer is exposed to, by investing in each REIF.
4.Outlook of the supervised entities’ exposure to real estate 23
Since this work comprehends the whole national insurance market, such analysis is evidently not feasible, and a simplification will be used. One will assume that given the relatively reduced weight of REIFs in each insurer’s portfolio, and that investment funds use diversification strategies, no single property exposure arises from REIF underwriting. The assumption that exposure to a single REIF does not generate property overexposure is not problematic, since even in the extreme case of the entire exposure to a REIF corresponding a 100% to a single property, it would still not account for 10% of any company’s assets.
The potential issue, though, is the disregard of possible situations where combining indirect exposure and directly held properties, or different underwritten REIFs, could generate single
property excessive exposure by being exposed to it through different manners.
i. Identification of excessive exposure
Among the 22 insurers reporting directly owned properties, there are two incurring in excessive exposure. Additionally, two out of the remaining 20 verified single property exposures near the
threshold in certain years. Nevertheless, the majority of insurers are far from such concentration, which provides an extra comfort with respect to the aforementioned simplification, regarding cases of concentration deriving from the aggregation of direct with indirect exposures.
In terms of overexposure arising from the combination of multiple indirect exposures, sustaining the previously enunciated simplification is equivalent to assume that the low representativeness of each individual REIF, alongside with the fact that REIFs are supervised and must use diversification measures, is enough to avoid generation of excessive exposure this way.
ii. Concentration risk capital charge
The capital charge per excessive exposure i is calculated as the product of the excess exposure
on a single name exposure (XSi) and a risk factor gi. For the case of exposures to a single
property shall be assigned a risk factor of 12%.
Conci = XSi * gi
The XSi is here interpreted as the excess of exposure to a single property. It is obtained as:
XSi = Max(0; Ei – CTi * Assets)
Where Ei denotes the exposure at default to a single name exposure i (here a single property i)
that is included in the calculation base of the market risk concentration submodule. CTi denotes