support
Working Paper CEsA CSG 136 / 2015
AN ANALYSIS OF
MOZAMBIQUE’S
POLITICAL AND
ECONOMIC NETWORKS
1
Andes CHIVANGUE
Edson CORTEZ
Abstract
This paper analyses the social networks existing among politicians and economists in contemporary Mozambique, using the SNA-Social Networks Analysis method to identify the links between these individuals, to discern their relationships and to measure both the density and the centrality of the political-business network. Mozambique’s political and business elite is thus identified. A network sociogram is presented identifying the individual position in the network and the linkages among these individuals and several positional metrics of the individuals in the network are estimated, allowing identifying each individual and its influence in the network. As this network is resource accumulation driven, this exercise permits to identify the main political and economic individual active in Mozambique economy. President Guebuza define the major network centre and other individuals, Joaquim Chissano, the former president, and Graça Machel, the widow of another former president. Policy implications are derived and the links between them displayed, allowing for an accurate view of Mozambique’s political and business world.
WORKING PAPER
CEsA neither confirms nor informs any opinions expressed by the authors in this document.
CEsAis a research Centre that belongs to CSG/Research in Social Sciences and Management that is
hosted by the Lisbon School of Economics and Management of the University of Lisbon an institution dedicated to teaching and research founded in 1911. In 2015, CSG was object of the international evaluation process of R&D units carried out by the Portuguese national funding agency for science, research and
technology (FCT - Foundation for Science and Technology) having been ranked as “Excellent”.
Founded in 1983, it is a private institution without lucrative purposes, whose research team is composed of ISEG faculty, full time research fellows and faculty from other higher education institutions. It is dedicated to the study of economic, social and cultural development in developing countries in Africa, Asia and Latin America, although it places particular emphasis on the study of African Portuguese-speaking countries,
China and Pacific Asia, as well as Brazil and other Mercosur countries. Additionally, CEsA also promotes
research on any other theoretical or applied topic in development studies, including globalization and economic integration, in other regions generally or across several regions.
From a methodological point of view, CEsA has always sought to foster a multidisciplinary approach to the
phenomenon of development, and a permanent interconnection between the theoretical and applied aspects of research. Besides, the centre pays particular attention to the organization and expansion of research supporting bibliographic resources, the acquisition of databases and publication exchange with other research centres.
AUTHORS
ANDES CHIVANGUE
Lecture at Eduardo Mondlane University, Maputo; PhD candidate at Lisbon School of Economics & Management, Universidade de Lisboa. Email address: chivangue@gmail.com
EDSON CORTEZ
ÍNDICE
1. INTRODUCTION ... 4
2. BACKGROUND... 5
3. LITERATURE SURVEY ... 7
4. METHODOLOGY ... 8
5. THEORETICAL BACKGROUND ... 9
6. DATA AND RESULTS ... 10
6.1. Empirical Results ... 13
1.
INTRODUCTION
This paper analyses Mozambique’s social networks and political power using SNA-Social Network Analysis. SNA is a subfield of graph theory and is used for analysing relational data2. With the aid of graphs, SNA describes the network and seeks to understand how important, or how central, the different actors are in the network, as well as to discover how concentrated the network is. The paper therefore presents a graph plotting the network of relationships observed between political actors and economic actors in Mozambique, and then it presents metrics relating to the network. SNA research in the field of sociology includes studies of elites3.
The motivation for the present research is as follows: firstly, although there is some research in Mozambique4, the relationship between political power and economic power is similar to those found in other contemporary countries, and therefore it is interesting to discover who the prominent individuals are and what role they play in the network; secondly, although there has been some research conducted into Mozambican politics and business5, the SNA methodology has so far not been used to describe Mozambique. Finally, the paper also seeks to measure both the centrality and the density of this network.
The paper is organised as follows: in the next section, the contextual setting is presented; Section 3 consists of a literature survey; in Section 4, the methodology is explained; Section 5 contains the data and the empirical specification; the results are presented in Section 6; finally we make our concluding remarks in Section 7.
2 Prell, C. Social Network Analysis: History, Theory & Methodology. (Thousand Oaks, CA: Sage Publications Ltd. 2012).
3 Laumann, E. and Pappi, F. “New Directions in the study of Elites”. American Sociology Review, (1973) pp. 38, 212-230; Burt, R. (1982) “Toward a Structural Theory of Action”. New York, Academic Press; Granoveter, M. “Economic Action and Social Structure: The problem of Embeddness”. American Journal of Sociology, 91 (1985), 481-510; Gil-Mendieta, J. and Schmidt, S. “The political network in Mexico”. Social Networks, 18 (1996), 355-381. 4 Hamar, A. “Ambivalent mobilities: Zimbabwean commercial farmers in Mozambique”. Journal of Southern African Studies, 36, 2 (2010), 395-416; Cramer, R. “Privatisation and adjustment in Mozambique: A Hospital Pass?” Journal of Southern African Studies, 27, 1 (2010), 79-103; Sender, J. and Oya, C. and Cramer, C. “Women working for wages: Putting flesh on the bones of a rural labour market survey in Mozambique”. Journal of Southern African Studies, 32, 2 (2006), pp. 313-333; Cramer, Christopher and Oya, Carlos and Sender, John. “Lifting the Blinkers: A New View of Power, Diversity and Poverty in Mozambican Rural Labour Market”. Journal of Modern African Studies, 46, 3 (2008), pp. 361-392; Vines, A. “Disarmament in Mozambique”. Journal of Southern African studies, 24, 1 (1998),191-205.
5 Mira, F.J.B (2005). Les élites et les entreprises au Mozambique: Globalisation, systèmes de pouvoir et
2.
BACKGROUND
Mozambique achieved independence from Portugal in 1975, only to become immediately engulfed in a civil war that lasted from 1976 to 1992. In recent years, the Mozambican economy has been characterised by a growth rate in GDP of 7%, despite showing a heavy concentration in the extractive sector, which is dominated by capital-intensive mega-projects that benefit from fiscal incentives, without upstream and downstream linkages, and have little impact on the economy as a whole6. Nearly 90% of the workforce earns their survival income in the informal sector, while the small formal sector is dominated by a few powerful economic groups and actors, most of whom benefit from their connections with the dominant political party, Frelimo. Most business people in Mozambique are members of the CTA-Confederation of Mozambican Business Associations, an organisation that clearly enjoys close relations with the ruling party. According to Pitcher7, “rather than constituting an autonomous sphere independent of the
government, CTA and the government were interwoven. CTA’s member associations in banking, tourism, commerce, and manufacturing contained powerful supporters of the
party.”
To understand the link between politics and business in Mozambique after independence, it is important to go back to the beginning of the construction of the new state and the consolidation of the Frelimo coalition. In 1977, Frelimo held its third congress, at which it declared itself to be a Marxist-Leninist party, and one of the main implications of this decision was that thereafter the economy began to be managed through central planning in a typically socialist fashion. The second feature emanating from the congress was a coercive modernisation project involving communal villages, consumption cooperatives and state farms. During this period, opposing political parties were not allowed to exist and the private sector was either residual or non-existent. The state became confused with the Frelimo party itself and vice-versa, and decision-makers believed that industrialisation could take place in 10 years, under the scope of a programme entitled “Plano Prospectivo Indicativo” and commonly referred to as PPI.
According to Harrison8, the expansion of Frelimo’s control over the economy can only be explained as a reaction to the crisis that had created a heated environment in the country immediately after independence. By 1978, 50% of all businesses were already under state control, and, by 1981, 65% of industrial production, 85% of the transport sector and 90% of the construction sector were positioned inside the state sector. This suggests that Frelimo’s aim was to increase state control and consolidate itself as the
6 Castel-Branco, Nuno. Dependência de Ajuda Externa, Acumulação e Ownership. Cadernos IESE n° 7/2011, (2011). Maputo: IESE.
7 Pitcher, M.A. Party Politics and Economic Reform in Africa’s Democracy. (USA: Cambridge University Press, 2012), p.182.
central elite governing Mozambique’s political economy. The absence of economic power is viewed by this author as the second motive that encouraged the party to expand its economic power through the state and not through the promotion of private interests, which were practically non-existent.
Although some literature speaks about the absence of a private sector in Mozambique, Pitcher9 argues that enterprises such as “Banco Standard Totta de
Moçambique”, “Companhia de Moçambique” (including “Entreposto”), “João Ferreira dos Santos” and “Grupo Madal” were not nationalised or interfered with because of “the government’s lack of will or its incapacity to extend its control to all enterprises”. The author says that it was precisely “the existence of a residual private sector during the socialist period [that] had the simultaneous effect of saving and undermining the transformative project of the Frelimo government. Without the support of the private sector, it is likely that the consequences of social engineering would have been worse.”
After the fourth Congress in 1983, the first steps were taken to open up the market, but the decisive moment was the fifth Congress in 1989, which effectively allowed Frelimo members to enrich themselves. Thus, “as the congress authorised the Frelimo members to participate in the private sector, this afforded the party the power to re-express the nature of its support, while also giving its members control over state enterprises.” In the privatisation process, the internal groups saw an opportunity to get rich. Therefore, the elites used their power to benefit from privatisation, and, through a process that Pitcher describes as ‘transformative preservation’, the first attempts were made to establish a support base composed of members of the elites from the private sector, a move that allowed them to hold on to political power10.
Pitcher’s view is confirmed by Harrison when he argues that the stabilisation and structural adjustment programme legitimised the acquisitive spirit that had been strongly condemned in the name of socialism. This led to a situation in which everyone, at all levels of society, tried to pillage public funds for the accumulation of their own personal wealth or simply for survival purposes. As the privatisations that were introduced were not transparent, this made it possible for those with good political connections to benefit from them. As an example, Pitcher speaks about ‘inside knowledge’ of the privatisation process, saying that political networks may have distorted prices and information, favouring individuals or interest groups. In such a context, top officials used their public position to gain an advantage in the turbulent and growing arena of private enterprise.
Effectively, despite certain distributional conflicts during the course of the privatisation of state enterprises, the discipline and experience of the ruling party (operating within a system of two-party stability) proved strong enough for it to maintain
9 Pitcher, M.A. “Sobreviver à transição: o legado das antigas empresas coloniais em Moçambique”. Análise Social, Vol. XXXVIII, 168 (2003), 793-820, p. 797 and 798.
its support. Patronage, corruption and a lack of accountability were some of the features of this strategy, including both the plea made by the leadership for loyalty within the party and the appeasement of its rank and file members through the provision of club goods. In fact, the government used the privatisation process to strengthen the social network existing within the ruling party. Frelimo took advantage of the process to further its
members’ interests by investing in the private sector11.
Pitcher says that those domestic investors that had close connections with Frelimo were either given or bought enterprises whose business ranged from tourism to finance, which meant that members of the party moved from politics to business or, like the current president of Mozambique, used their network in the political arena to further their expansion into the market economy. In the case of the country’s presidents, there was a long list of politically well-connected entrepreneurs, including ex-first ladies, former prime ministers, members of the army, etc. The centralised state control over the privatisation process guaranteed that the ruling party was able to enjoy substantial influence over the way in which enterprises were sold and to whom. The government used its authority to favour the party’s interests and to divide control of these enterprises among the loyal members of the party. Additional legislation was created to strengthen the state’s presence and to ensure continued favouritism for party members, even after having already created the necessary institutions for a market economy. In order to explain this logic, Harrison suggests that the unstable liberalisation process to which Mozambique was subjected created conditions for corruption, making this process a key element in the country’s democratic politics and leading to an erosion of the state and the legitimisation of a political elite.
3.
LITERATURE SURVEY
African social capital and social networks are a theme that has attracted some research in the past12. However, in recent years, SNA has emerged as a research paradigm in the social sciences13, being used to arrive at a description of social networks14. For
11 Pitcher, M.A. Party Politics and Economic Reform in Africa’s Democracy. (USA: Cambridge University Press, 2012).
12Meagher, K. “Social capital, social liabilities and political capital: Social networks and informal manufacturing in Nigeria”. African Affairs, 105, 421, (2006), 553-582; Bräutigam. “Close encounters: Chinese business networks as industrial catalysts in sub-Saharan Africa”. African Affairs, 102, 408 (2003), 447-467; Donge, J.K.V. “Waluguru traders in Dar Es Salaam: An analysis of the social construction of economic life”. African Affairs, 91, 363, (1992), 181-205.
13Córten, R. (2011) “Visualisation of social networks in Stata using multidimensional scaling”. Stata Journal, 11,1, 52-63; Miura, H. (2011) “Network analysis for directed or undirected networks with no weights”. Paper submitted to the Stata Journal.
example, Mistrulli15 analysed bank failures in Italy as part of a social network process. Other applications of SNA have also been made in the field of management16, in the field of sociology17, in tourism18 and politics19.
4.
METHODOLOGY
Social network analysis (SNA) studies the different patterns of interaction among social entities20. Network visualisation is concerned with showing binary relations between entities. Adopting the terminology of graph theory, these entities are given the name of nodes or vertices. Relations between nodes may be considered to be directed if they can be understood as flowing from one node to another, or they may be considered to be non-directed if no such flow can be identified. Directed relations are referred to as arcs and non-directed relations are referred to as edges21.
A graph model representing a network G = (V; E) consists of a set of nodes V and a set of arcs E. Vj equals the number of nodes and Ej equals the number of arcs. An arc is defined as a link between two vertices i and j (not necessarily distinct) that has node i at one end and node j at the other end. There are several types of nodes: (i) isolated nodes
– nodes that are not attached to any arc; (ii) parallel arcs – two or more arcs that connect the same pair of nodes; (iii) self-loop – an arc connecting node i to itself; and (iv) a zero or negative-weighted arc22.
A typical representation of a network of relations is an adjacency matrix. In this matrix, every cell represents a relation from one node (row) to another node (column); for non-directed networks, this matrix is symmetrical. Nodes that have no edges or arcs are called isolates. The number of edges connected to a node is known as the degree of
15 Mistrulli, P.M. “Assessing financial contagion in the interbank market: Maximum entropy versus observed interbank lending patterns”. Journal of Banking and Finance, 35, (2011), 1114–1127; Tichy, N., Tushman, M. and Fombrun, C. “Social network analysis for organizations”. The Academy of Management Review, 4, (1979), 507–519. 16 Tichy, N., Tushman, M. and Fombrun, C. “Social network analysis for organizations”. The Academy of
Management Review, 4, (1979), 507–519; Cross, R., Parker, A., and Borgatti, S.P. 2002. “Making Invisible Work Visible: Using Social Network Analysis to Support Strategic Collaboration”. California Management Review. 44(2): 25-46.
17 Laumann, E. and Pappi, F. “New Directions in the study of Elites”. American Sociology Review, 38, (1973) 212-230; Burt, R. (1982) “Toward a Structural Theory of Action”. New York, Academic Press; Granoveter, M. (1985). “Economic Action and Social Structure: The problem of Embeddedness”. American Journal of Sociology, 91, 481-510.
18 Bággio, R.; Scott, N. e Cooper, C. (2010) “ Network Science: A review focused in tourism”. Annals of Tourism Research, 37, 3, 802-827;
19 Gil-Mendieta, J. and Schmidt, S. “The political network in Mexico”. Social Networks, 18, (1996), 355-381. 20 Wasserman, S. and K. Faust. Social Network Analysis: Methods and Applications. (Cambridge: Cambridge University Press, 1994); Scott, J. Social Network Analysis: A Handbook. (2nd ed.). (London: Sage Publications Ltd, 2000).
21 Córten, R. (2011) “Visualisation of social networks in Stata using multidimensional scaling”. Stata Journal, 11,1, 52-63.
the node, which is a measure of node centrality. Lastly, the distance between two nodes is defined as the shortest path between them. If there is no path between two isolates, the distance between them is said to be infinite23.
The main task to be performed in a network analysis is the visualisation of the relationships between the players and it is important to determine the positions of the vertices in a (typically two-dimensional) graphical layout. Obviously, the optimal placement of vertices depends on the purpose of the analysis; however, it is often desirable to centrally locate in the graph those vertices that have a central position in the SNA and to represent a larger distance in the network by a larger distance in the two-dimensional graph24.
The network graph measured with the adjacency matrix describes the network, but additional measurements can describe the network more accurately. Two measurements are central, the measurement of centrality and the measurement of density. Degree centrality measures the importance of a node by the number of connections that the node has if the network is unweighted, and by the aggregate of the weights of edges that are connected to the node if the network is weighted25.
5.
THEORETICAL BACKGROUND
The theoretical background of the present research is the embeddedness concept26. Embeddedness is the degree to which individuals or organisations are enmeshed in a social network and it involves the overlap between social and economic ties within and between organisations. The concept refers both to the effects of social relationships (trust and cohesion) on economic outcomes and to the inertial tendency to repeat transactions over time. Job embeddedness is considered to be a good predictor of an employee’s tendency to stay in a job despite an external shock that might otherwise cause him to quit27. By analogy, social embeddedness is the persistence of the social structures analysed in this context.
23 Córten, R. (2011) “Visualisation of social networks in Stata using multidimensional scaling”. Stata Journal, 11,1, 52-63.
24 Córten, R. (2011) “Visualisation of social networks in Stata using multidimensional scaling”. Stata Journal, 11,1, 52-63.
25 Freeman, L. C. (1978). “Centrality in social networks: Conceptual clarification”. Social Networks 1, 215-239. 26 Granoveter, M. “Economic Action and Social Structure: The problem of Embeddedness”. American Journal of Sociology, 91, (1985), 481-510.
6.
DATA AND RESULTS
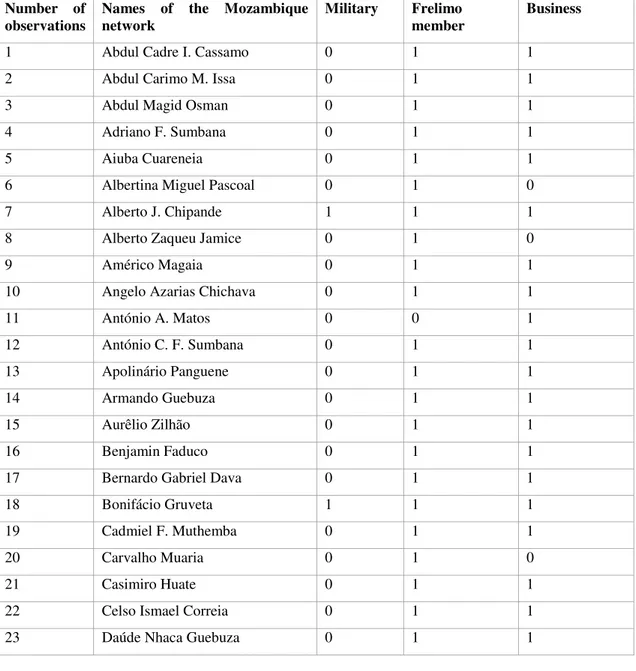
The data set consists of qualitative information on the networks existing between the Mozambican politicians and economic players described in the table 1 below. The data were obtained from the website of the Maputo Centre for Public Integrity28. The data describe relationships among individuals, which are by their very nature directed between two individuals. Such a network is a network of k relations, there is a k × 2 data matrix
in which every row represents an arc (if the network is directed) between two nodes defined by the names of individual people. The use of edge lists and arc lists often provides a more economical way of storing network data than an adjacency matrix.
Table 1: Names of the Mozambique Political and Business Network
Number of observations
Names of the Mozambique network
Military Frelimo member
Business
1 Abdul Cadre I. Cassamo 0 1 1
2 Abdul Carimo M. Issa 0 1 1
3 Abdul Magid Osman 0 1 1
4 Adriano F. Sumbana 0 1 1
5 Aiuba Cuareneia 0 1 1
6 Albertina Miguel Pascoal 0 1 0
7 Alberto J. Chipande 1 1 1
8 Alberto Zaqueu Jamice 0 1 0
9 Américo Magaia 0 1 1
10 Angelo Azarias Chichava 0 1 1
11 António A. Matos 0 0 1
12 António C. F. Sumbana 0 1 1
13 Apolinário Panguene 0 1 1
14 Armando Guebuza 0 1 1
15 Aurêlio Zilhão 0 1 1
16 Benjamin Faduco 0 1 1
17 Bernardo Gabriel Dava 0 1 1
18 Bonifácio Gruveta 1 1 1
19 Cadmiel F. Muthemba 0 1 1
20 Carvalho Muaria 0 1 0
21 Casimiro Huate 0 1 1
22 Celso Ismael Correia 0 1 1
23 Daúde Nhaca Guebuza 0 1 1
24 Domingos Fondo 1 1 0
25 Eduardo Arão 0 1 0
26 Eduardo Filipe Magaia 0 1 1
27 Egas Mussanhane 0 1 1
28 Egidio Leite 0 1 1
29 Elias Jaime Zimba 0 0 1
30 Elisio J. Z. Langa 0 1 0
31 Félix Júlio Massingue 0 1 1
32 Fernando Manuel P. Costa 0 0 1
33 Fernando Sumbana Jr 0 1 1
34 Graça Simbine Machel 0 1 1
35 Henrique J. Macuácua 0 1 1
36 Hermenegildo Gamito 0 1 1
37 Isidora Faztudo 0 1 1
38 Jacinto Soares Veloso 1 1 1
39 Jesus Joaquim C. Gomes 0 0 1
40 João Américo Mfumo 1 1 1
41 Joaquim Chissano 0 1 1
42 José A. Tomo Psico 0 1 1
43 José Eduardo Dai 0 1 1
44 José Ferreira Songane 0 1 0
45 José Luis da Costa Virott 0 0 1
46 José Mateus Kathupa 0 1 1
47 José Solomone Cossa 0 1 1
48 Josina Ziyaya Machel 0 1 1
49 Judite Tembe Mutaca 0 1 0
50 Luis Magaço Junior 0 0 1
51 Malengane D. Machel 0 1 1
52 Manuel C. F. Sumbana 0 1 1
53 Manuel F. Arede 0 0 1
54 Manuel Jorge Tomé 0 1 1
55 Manuel M. P. Braga 0 0 1
56 Mariano Matsinha 1 1 1
57 Matias Zefanias Mboa 0 1 1
58 Miguel Nhaca Guebuza 0 1 1
59 Modesta Daniel 0 1 1
60 Moises R. Massinga 0 1 1
62 Ndambi Guebuza 0 1 1
63 Nkutema Chipande 0 1 1
64 N'naite Joaquim Chissano 0 1 1
65 Norah Armando Guebuza 0 1 1
66 Nyeleti Brooke Mondlane 0 1 1
67 Octavio F. Muthemba 0 1 1
68 Oliveira Amimo 0 1 1
69 Pascoal Mocumbi 0 1 1
70 Paulo Ratilal 0 1 1
71 Rafael Maguni 0 1 1
72 Raimundo Pachinuapa 1 1 1
73 Ricardo Rangeiro 0 0 1
74 Rosa Massavanhane 0 1 0
75 Rui M. S. Melo 0 0 1
76 Salimo Amad Abdula 0 1 1
77 Samora Machel Júnior 0 1 1
78 Sérgio Pantie 0 1 1
79 Sérgio Vieira 0 1 1
80 Teodato M. S. Hunguana 0 1 1
81 Teodoro Andrade Waty 0 1 1
82 Timothy Wade George 0 0 1
83 Tobias Joaquim Dai 1 1 1
84 Ussumane Ali Dauto 0 1 1
85 Valentina Guebuza 0 1 1
86 Valeriano Pedro 0 1 1
87 Venâncio M. Mazivele 0 1 1
88 Zeferino Martins 0 1 1
Mean 0.090 0.875 0.897
6.1. Empirical Results
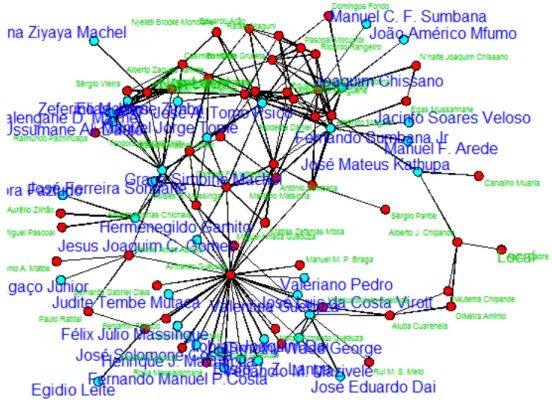
The analysis consists of two sequential stages: firstly, the network is visualised with the aim of identifying each player’s position within it, in the form of a sociogram in which the data are represented as a list of nodes and links29; secondly, the network metrics are calculated in order to measure the centrality and density of the networks30. Figure 1 presents the sociogram of the Mozambique network.
Figure 1: Sociogram of the Mozambique network
In analysing the sociogram, the first thing to be observed is that it identifies specific nodes in the network, adding individual name labels to the plot using the label option. Focusing on the inner nodes first of all, it can be seen that there are two main inner nodes, defined by political individuals who organise the network. The first centre is headed by the Mozambique President Armando Guebuza and the second by the former president Joaquim Chissano. Therefore the leading position belongs to two major political individuals in the network. Another less concentrated centre is headed by Graça Machel, the wife of another former president. Business personnel have outlying positions, signifying that the leading role is played by politicians and not by business people (e.g.
29 Córten, R. (2011) “Visualisation of social networks in Stata using multidimensional scaling”. Stata Journal, 11,1, 52-63.
Salimo Abdula and Celso Correia from Intelec Holding, whose public visibility derives from the new presidency of Armando Guebuza, with whom the company has links). Figure 1 therefore confirms the importance of the political and business network in Mozambique.
At a second stage in the results, some networks are estimated for each node. Because of the high number of edges, the metrics are displayed for the initial 10 edges. This information is presented in Table 2 below.
Table 2: Network metrics
Degree centrality Closeness centrality
Betweenness centrality
Eigen vector centrality Numb
er of observ
ations Names
In-degree
Total degree
Out-degree
_ _
1 Abdul Cadre I. Cassamo 49 91 42 0.659 47.737 0.104
2 Abdul Carimo M. Issa 41 89 48 0.690 47.317 0.118
3 Abdul Magid Osman 49 94 45 0.674 54.233 0.110
4 Adriano F. Sumbana 44 77 33 0.617 37.032 0.081
5 Aiuba Cuareneia 40 83 43 0.664 39.628 0.107
6 Albertina Miguel Pascoal 38 76 38 0.639 31.702 0.089
7 Alberto J. Chipande 42 87 45 0.674 42.730 0.108
8 Alberto Zaqueu Jamice 48 89 41 0.654 49.359 0.102
9 Américo Magaia 42 82 40 0.649 38.959 0.098
10 Angelo Azarias Chichava 42 94 52 0.713 51.284 0.128
11 António A. Matos 43 72 29 0.600 28.356 0.069
12 António C.F. Sumbana 45 92 47 0.685 49.694 0.114
13 Apolinário Panguene 48 86 38 0.639 43.951 0.094
14 Armando Guebuza 41 84 43 0.664 41.680 0.106
15 Aurêlio Zilhão 54 97 43 0.664 51.355 0.106
16 Benjamin Faduco 43 91 48 0.690 47.015 0.116
17 Bernardo Gabriel Dava 48 86 38 0.639 45.369 0.092
18 Bonifácio Gruveta 46 91 45 0.674 49.113 0.112
19 Cadmiel F. Muthemba 43 85 42 0.659 41.646 0.100
20 Carvalho Muaria 46 90 44 0.669 45.922 0.108
21 Casimiro Huate 48 94 46 0.679 52.321 0.115
22 Celso Ismael Correia 50 97 47 0.685 58.499 0.115
24 Domingos Fondo 40 75 35 0.625 32.835 0.084
25 Eduardo Arão 41 83 42 0.659 39.659 0.101
26 Eduardo Filipe Magaia 43 92 49 0.696 47.844 0.121
27 Egas Mussanhane 42 92 50 0.701 48.464 0.121
28 Egidio Leite 36 76 40 0.649 32.905 0.097
29 Elias Jaime Zimba 52 92 40 0.649 49.507 0.098
30 Elisio J. Z. Langa 48 96 48 0.690 52.208 0.115
31 Félix Júlio Massingue 45 89 44 0.669 47.412 0.107
32 Fernando Manuel P. Costa 49 85 36 0.630 38.863 0.090
33 Fernando Sumbana Jr 46 92 46 0.679 51.512 0.111
34 Graça Simbine Machel 37 83 46 0.679 39.132 0.111
35 Henrique J. Macuácua 38 78 40 0.649 38.511 0.098
36 Hermenegildo Gamito 41 80 39 0.644 37.793 0.097
37 Isidora Faztudo 50 90 40 0.649 46.732 0.098
38 Jacinto Soares Veloso 35 81 46 0.679 37.911 0.111
39 Jesus Joaquim C. Gomes 38 86 48 0.690 44.394 0.117
40 João Américo Mfumo 44 85 41 0.654 39.760 0.100
41 Joaquim Chissano 46 83 37 0.635 41.504 0.090
42 José A. Tomo Psico 48 96 48 0.690 55.270 0.118
43 José Eduardo Dai 48 93 45 0.674 53.911 0.111
44 José Ferreira Songane 45 94 49 0.696 49.823 0.120
45 José Luis da Costa Virott 45 87 42 0.659 45.641 0.103
46 José Mateus Kathupa 42 78 36 0.630 33.690 0.090
47 José Solomone Cossa 46 84 38 0.639 42.150 0.093
48 Josina Ziyaya Machel 45 93 48 0.690 52.985 0.116
49 Judite Tembe Mutaca 40 82 42 0.659 39.726 0.103
50 Luis Magaço Junior 41 87 46 0.679 45.072 0.114
51 Malengane D. Machel 45 88 43 0.664 46.981 0.105
52 Manuel C. F. Sumbana 41 85 44 0.669 44.231 0.107
53 Manuel F. Arede 41 78 37 0.639 34.742 0.090
54 Manuel Jorge Tomé 40 81 41 0.654 39.153 0.098
55 Manuel M. P. Braga 36 85 49 0.696 40.344 0.122
56 Mariano Matsinha 43 76 33 0.617 30.607 0.080
57 Matias Zefanias Mboa 44 81 37 0.635 40.839 0.091
58 Miguel Nhaca Guebuza 49 88 39 0.644 43.459 0.099
59 Modesta Daniel 42 87 45 0.674 44.398 0.109
60 Moises R. Massinga 40 84 44 0.669 41.066 0.108
62 Ndambi Guebuza 35 77 42 0.659 35.288 0.103
63 Nkutema Chipande 46 93 47 0.685 49.511 0.116
64 N'naite Joaquim Chissano 39 83 44 0.669 38.898 0.106
65 Norah Armando Guebuza 46 88 42 0.659 44.231 0.103
66 Nyeleti Brooke Mondlane 43 89 46 0.679 46.369 0.113
67 Octavio F. Muthemba 43 93 50 0.701 49.534 0.119
68 Oliveira Amimo 39 84 45 0.674 42.391 0.110
69 Pascoal Mocumbi 44 98 54 0.725 57.108 0.131
70 Paulo Ratilal 44 90 46 0.679 49.791 0.114
71 Rafael Maguni 51 97 46 0.679 55.181 0.112
72 Raimundo Pachinuapa 43 88 45 0.674 44.152 0.111
73 Ricardo Rangeiro 36 76 40 0.649 33.148 0.098
74 Rosa Massavanhane 39 82 43 0.664 37.129 0.106
75 Rui M. S. Melo 44 93 49 0.696 51.476 0.121
76 Salimo Amad Abdula 43 87 44 0.669 42.278 0.108
77 Samora Machel Júnior 36 82 46 0.679 37.763 0.111
78 Sérgio Pantie 40 89 49 0.696 47.707 0.119
79 Sérgio Vieira 42 91 49 0.696 49.384 0.119
80 Teodato M.S. Hunguana 43 84 41 0.654 42.381 0.101
81 Teodoro Andrade Waty 43 84 41 0.654 42.589 0.102
82 Timothy Wade George 40 81 41 0.654 38. 452 0.103
83 Tobias Joaquim Dai 47 92 45 0.674 52.324 0.111
84 Ussumane Ali Dauto 35 78 43 0.664 35.595 0.103
85 Valentina Guebuza 35 83 48 0.690 41.081 0.116
86 Valeriano Pedro 42 83 41 0.654 41.895 0.100
87 Venâncio M. Mazivele 42 81 39 0.644 38.401 0.096
Distinct central measures are presented, displaying a high level of centrality that varies from one individual node to another. The first and most common network metric is the degree. The degree measure of centrality is a directional measure of the number of links a person has31. As it is a directional measure, it is broken down into “in-degree”, which is the number of individual inward connections, and “out-degree”, which is the number of individual outward connections. The highest centrality is obtained by Pascoal Mocumbi with an index of 98, and this centrality is more outside-oriented (54) than inside-oriented (44). Leading positions in terms of centrality are held by Aurélio Zilhão, who is more outside–oriented, and Celso Ismael Correia and Rafael Maguni32, who are more inside-oriented. The central individuals in Figure 1 occupy a middle position, with the President Armando Guebuza reaching a score of 84, Joaquim Chissano reaching 83, and Graça Machel also reaching 83. Therefore centrality in the network is not achieved by the centrally placed persons, but rather by individuals that are very active in the network.
The closeness measure of centrality measures how close one node is to all other nodes in the set of nodes33. The above values display an average degree of closeness. The highest closeness is recorded by Pascoal Mocumbi with a score of 0.725, followed by Daúde Nhaca Guebuza with the same score of 0.725 and by Angelo Azarias Chichava with a score of 0.713. Graça Machel scores 0.679, the President Armando Guebuza 0.664 and Joaquim Chissano 0.635.
“Betweenness” measures the extent to which a particular node lies between the various other nodes in the set of nodes34. The betweenness centrality of a node is the sum of node i-estimated probabilities of standing along any geodesic that includes all nodes, and it is therefore an inherently asymmetrical measure of centrality. A node with a high level of betweenness centrality can potentially influence the spread of information throughout the network, by facilitating, hindering or altering communication between other nodes35. The highest level of betweenness centrality is reached by Timothy Wade George with a score of 58.452, followed by Celso Ismael Correia with 58.499 and Pascoal Mocumbi with a score of 57.108. Again the leading individuals have lower scores, with Armando Guebuza recording only 41.680, Joaquim Chissano 41.504, and Graça Machel 39.132.
Eigenvector centrality is a simple raw score that also measures centrality in the network, but this measure is less affected by sampling characteristics, namely zeros, since these are preserved.When calculated as a simple raw score, eigenvector centrality may
31 Freeman, L. C., 1978. Centrality in social networks: Conceptual clarification. Social Networks 1, 215-239. Freeman,L.C. Roeder,D. and Mulholland, R.R. (1980) Centrality in social networks: II. Experimental results. Social Networks, 2, 119-141.
32 He died in a car accident. Despite this, we consider that it is important to mention the name of this person in order to provide a better understanding of the various members of this network.
33 Wasserman, S. and K. Faust. Social Network Analysis: Methods and Applications. (Cambridge: Cambridge University Press, 1994).
indicate that it is the preferred centrality measure when the network data are incomplete, which is not the case in the present research. The highest level of eigenvector centrality is reached by Daúde Nhaca Guebuza with 0.133, followed by Pascoal Mocumbi with 0.131 and Angelo Azarias Chichava36 with 0.128. Again the leading individuals in Figure 1 have a lower position, with Graça Machel scoring 0.111, Armando Guebuza 0.106, and Joaquim Chissano 0.09.
The various centrality measures usually differ greatly in scale, but they are positively correlated and are designed to confirm and improve the identification obtained in the sociogram. High values represent high centrality, which means that the individuals are positioned in the inner nodes of the sociogram, but these values allow us to distinguish between distinct inner nodes. An individual with a high betweenness centrality but a low eigenvector centrality is a central gatekeeper to a central actor. An actor with a low betweenness centrality but a high eigenvector centrality may have unique access to central actors. Therefore, these metrics confirm the above sociogram, enabling us to form an accurate picture of the Mozambican social network. Therefore, the only way to uncover these relationships is by using methods that enable us to establish the precise nature of the network. The use of individual names allows us to control the quality of the present research and to establish the accuracy of the analysis. With the use of names, subsequent validation of the network is possible, allowing us to understand each individual’s role in the network.
7.
DISCUSSION AND CONCLUSION
This paper presents a descriptive analysis of the network formed by the political and business elite who lead the Mozambican economy. The results validate the embeddedness theory, with President Guebuza occupying the central role in the network, as can be observed in the sociogram. Two other individuals define minor centres in the network: Joaquim Chissano, the former president, and Graça Machel, the widow of another former president. This central role is supported by other centrally placed individuals in the network, who record high scores in the different measures of centrality, namely Pascoal Mocumbi.The identification of the network by names is similar to the methodology adopted by Gil-Mendieta and Schmidt37 and enables us to use this result accurately, since we know the lines that lead to an individual, which is regarded as a way of making contact with that individual.
This research shows that, just as happens elsewhere, Mozambique’s elite is organised into a network with a leader, a second level of figures, and a third and even a fourth level composed of outliers. Identifying the individuals by name and visualising
36 Angelo Azarias Chichava (deceased) was one of the founders of SPI Holding.
their network of links is a distinct result of this study, enabling us to compare the results with the real situation. This result draws the attention of the social observer to the second and third-level players in a political and economic network, overcoming the media’s tendency to focus mainly on the leader.
Seen in terms of common knowledge, the position of the president was as expected, but the position of former presidents and the widow of a former president, as well as the rankings of other first-line leaders, were not expected, since the common observer cannot actually see the network. Therefore, while some of the results were expected, others were not, and were only revealed by this research. Particularly important is the position of second-tier members in the network, some of whom frequently appear in the media and have therefore developed a public perception of their importance that is not revealed by the analysis. Therefore, this research accurately describes the political and business networks of Mozambique, with some expected results and some unexpected ones, and it should be used to observe the changes that will occur in this network over time. Of particular interest are the individuals placed centrally around the leader, who function as gatekeepers, the individuals in the middle, their family relationship and their relationship with Frelimo, and finally the outliers, who are present in the network but occupy an outside position, their function being to establish links between the network and minor provincial politicians, as well as other more general individuals outside the network. The network therefore shows the distribution of power in Mozambican society.
It is important to note that the sociogram validates the study made by Hanlon and Mosse38, in which the authors speak about three important families, namely the Chissano family, the Guebuza family and the family of Graça Machel. They argue that, unlike Guebuza, Chissano has not been successful in business. Effectively, the sociogram shows two important groups, with Joaquim Chissano, Pascoal Mocumbi, Sérgio Vieira, Fernando Sumbana Jr., Manuel Tomé, José A. Tomo Psico and others at the top. The main feature of this first group is the absence of a centre of power which is distributed among different nodes. In the sociogram, we find President Guebuza, from whom power flows, linked to people like Miguel Nhaca Guebuza, Valentina Guebuza, José Eduardo Dai, Manuel M. P. Braga and others. At the centre, we find Graça Machel and she appears as a point of connection between the two groups.
As far as comparison with other published works is concerned, this paper is related to that of Gil-Mendieta and Schmidt39, who analysed networks among Mexican political figures. However, no direct comparisons can be made, since the present paper specifically refers to elite political and business networkers in Mozambique. Furthermore, the present research supplements the network sociogram with metrics that are designed to complement the result. Based on the Mozambique in the African context, this paper seeks
38 Hanlon, J. and Mosse, M. “Is Mozambique’s elite moving from corruption to development?” UNU-WIDER Conference on the Role of Elites in Economic Development, 12-13, (June, 2009), Helsinki, Finland.
to draw the attention of researchers in Africa to the importance of the social context in the business world and ultimately in the management of the country’s economy.