adfa, p. 1, 2011.
© Springer-Verlag Berlin Heidelberg 2011
Analysis of Pancreas Histological Images for Glucose
Intolerance Identification using Wavelet Decomposition
Tathagata Bandyopadhyay1a, Sreetama Mitra1b,Shyamali Mitra2c,
Luis Miguel Rato3d,Nibaran Das4e
a [email protected], b [email protected], c
[email protected],d[email protected],e[email protected] 1School of Computer Engineering, KIIT University, Bhubaneswar, India, 2Department of Electronics and Telecomunication Engineering, Jadavpur University, India,
3University of Evora, Potugal,
4Department of Computer Science and Engineering, Jadavpur University, India
Abstract: Subtle structural differences can be observed in the islets of Langer-hans region of microscopic image of pancreas cell of the rats having normal glucose tolerance and the rats having pre-diabetic (glucose intolerant) situa-tions. This paper proposes a way to automatically segment the islets of Langer-hans region from the histological image of rat's pancreas cell and on the basis of some morphological feature extracted from the segmented region the images are classified as normal and pre-diabetic. The experiment is done on a set of 134 images of which 56 are of normal type and the rests 78 are of pre-diabetic type. The work has two stages: primarily, segmentation of the region of interest (roi) i.e. islets of Langerhans from the pancreatic cell and secondly, the extrac-tion of the morphological features from the region of interest for classificaextrac-tion. Wavelet analysis and connected component analysis method have been used for automatic segmentation of the images. A few classifiers like OneRule, Naïve Bayes, MLP, J48 Tree, SVM etc. are used for evaluation among which MLP performed the best.
Keywords: Automatic Segmentation, Pancreas Cell, Morphological Feature, Wavelet Analysis, Connected Component, Feature Extraction, Classification
1
INTRODUCTION
The challenge related to conventional clinical wisdom and expertise level has paved the way to develop Automatic Computer aided Diagnostic System. The broad goal of automatic computerized diagnostic system is to improve patient care by moving from an experienced based form of clinical practice to one informed by computer aided systematic application of medical knowledge. Moreover, it involves the risk of the pathologist to be infected with some contagious diseases while testing the samples. In the present interest, it is being observed that diabetic prone rats develop a cell
mediat-ed auto immune destruction of β-cells in pancreas resulting in an abrupt onset of dia-betes Maleates. The symptoms are generally observed between 60 and 120 days of age in both males and females. The onset of disease is characterized by glycosuria, hyper glycaemia, weight loss, ketosis etc. Detailed analysis shows that DP rats devel-op insulin that destroys only the pancreatic β-cells resulting in an islet devoid of insu-lin positive cells.
To address the challenges as mentioned above, an approach of automatic segmen-tation of images of pancreatic cells of Wister rats by using wavelet analysis has been developed in the present paper. The process is followed by connected component analysis to automatically segment the islets of Langerhans region from the histologi-cal images of rats' pancreas cell in order to histologi-calculate some morphologihistologi-cal features to classify the images as glucose tolerant (normal) or glucose intolerant (pre-diabetic)[1]. The segmentation of the image is done through 2D-DWT decomposition by using ‘haar’ wavelet. The co-occurrence matrices are calculated for the original sub image block under three detailed co-efficients are obtained for each sub image block.
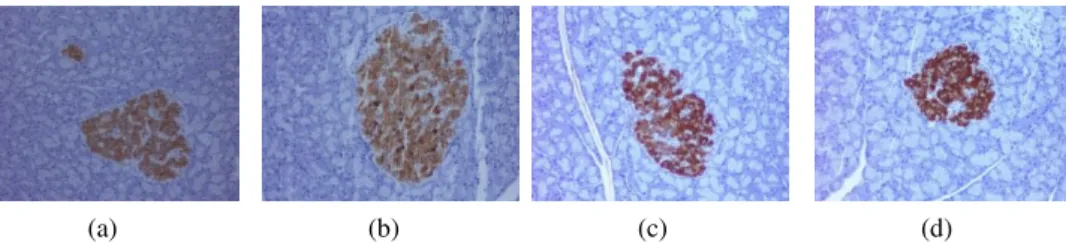
This paper is categorically divided into 6 sections. In section 2 the usage of wave-let transform strictly in relation to the work is briefly discussed in a nutshell. Section 3 gives a brief description of the color enhancement technique used in the present work. Connected component analysis techniques along with the masking out the orig-inal image is briefly mentioned in the Section 4. Section 5 covers the feature extrac-tion and classificaextrac-tion of the images. Finally in secextrac-tion 6, results and corresponding detailed analysis are given in tabular form. It is worthy to mention here that a real data set of 134 images (56 from rats with normal glucose tolerance and 78 from pre-diabetic ones) used in [1], are also used here. Few samples of the dataset are shown in Fig 1.
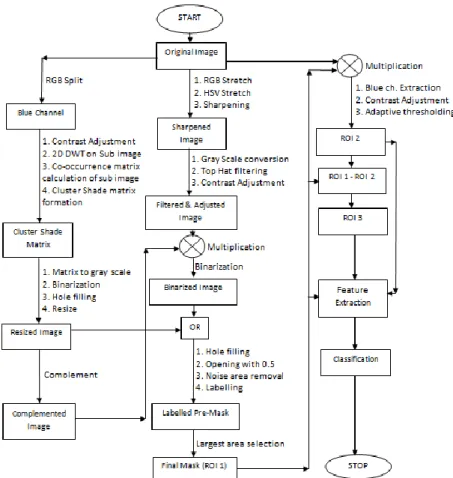
A convenient flow chart of developed methodology is given in Fig. 2 for better understanding of the system.
(a) (b) (c) (d)
Fig. 1. Histological sample images of (a-b) Normal (c-d) Pre-diabetic pancreas cell. The brown colour regions denotes the beta cells
Fig. 2.A schematic diagram of the entire system
2
WAVELET ANALYSIS
As mentioned before that Wavelet Analysis is applied first to segment out the β-cell region (the region with reddish brown shade). To do that first the input images are split into RGB channels. The blue channel is used for processing the image due to having priority of blue colours. Consecutive 32 × 32 sub image blocks [2] of the extracted blue channel, starting from the top left corner are used for single level 2D DWT (discrete wavelet transform) decomposition using 'haar'[3]wavelet. We have used the 'haar' wavelet due to its simplicity, low computational cost and having pow-er to identify the potential diffpow-erences between two adjacent pixels. Each sub image blocks are overlapping but differs by one row or column in the spatial location from its adjacent sub image block [2]. By 2D wavelet decomposition on each sub image block one approximate (𝑐𝐴) and three detail (𝑐𝐻, 𝑐𝑉, 𝑐𝐷) coefficients are obtained corresponding to each block. Now, the co-occurrence matrices are calculated for the original sub image block and the three detail co-efficients[2]using 8 gray level
ap-proximation. That means for each sub image block 4 co-occurrence matrices are ob-tained from which one average co-occurrence matrix is calculated. After normalizing the average co-occurrence matrix, cluster shade feature[2] is calculated using the formula:
Cluster shade =𝑖,=1𝑁(𝑖−𝑀𝑥+𝑗−𝑀𝑦)3𝐶(𝑖,𝑗) (1) where Mx= ∑𝑁𝑖,𝑗=1𝑖𝐶(𝑖, 𝑗) (2)
and My =∑𝑁𝑖,𝑗=1𝑗𝐶(𝑖, 𝑗) (3)
for this experiment N=8 (8 gray level approximation for co-occurrence matrix calcu-lation) and C is the normalized average co-occurrence matrix.
Thus for each sub image block one cluster shade feature value is obtained and stor-ing all the feature values for all the sub image blocks a matrix is formed. Then the matrix is converted to grayscale image. After binary conversion of the grayscale im-age and filling holes the β-cell area is obtained as white region on a black back-ground. This binary image is resized to the size of the extracted blue channel image.
3
COLOUR ENHANCEMENT
As shown in the Block Diagram (Fig. 1), RGB stretching is done on the original image followed by HSV stretching to enhance the contrast of colour. Then the ob-tained image is sharpened. These operations are done to make the Islets of Langer-hans area surrounding the β-cell region more conspicuous. After converting the sharpened coloured image to a grayscale image top hat filtering[4] is done to subtract an approximate background from the image. After contrast adjustment the filtered image is masked with the complement of the resized binary image obtained in wavelet analysis. Now the resulting image is converted to binary. Then OR operation is per-formed on this binarized image with the resized image obtained in the wavelet analy-sis stage. Now hole filling is done on the output image. Next the filled image is opened with square of width 5 to disconnect the thin connections and regions having area less than 50 pixels are considered as noise and are removed. The final output image obtained in this stage is named as 'pre_mask'.
4
CONNECTED COMPONENT ANALYSIS
All the connected components in the 'pre_mask'ed image are labeled and area of each region is calculated. Then, the connected region having maximum area is kept and others are discarded. Image, thus obtained, is named as 'final_mask'. This is also termed as roi1.
4.1 MASKING ORIGINAL IMAGE
Original image is masked with the 'final_mask' to segment out the β-cell region along with the surrounding islets of Langerhans region. Now blue channel is extracted from this masked image and then the contrast adjustment is done. Then on resulting image adaptive thresholding [5](median method with 32 window size) is performed to separate out only the β-cell region from the mixture of β-cell and islets of Langerhans. Resulting image is named as 'roi2'. Another region, 'roi3' is calculated by subtracting 'roi2' from 'roi1'.
Fig.3. Intermediate Images
5
FEATURE EXTRACTION AND CLASSIFICATION
Here, we have used three morphological features for classification of the image, 1)the ratio between the area of the β-cells and the area of islets of Langerhans , 2) ratio of the area of 'roi2' to 'roi1', 3) the perimeter per area ratio of islets of
Langer-hans. First one is calculated by taking the ratio of area of 'roi3' and 'roi1'. Second one is calculated by taking the ratio of area of 'roi2' and 'roi1' To calculate the third feature first, the boundary points of 'roi1' is obtained. Then perimeter is calculated by taking the sum of the distances of two successive boundary points. Now this perimeter value is divided by the area of the same region to obtain the perimeter per area (PPA) ratio. Thus, three features are calculated for all the images. It is worthy to mention here that all the image processing modules have been developed using MATLAB.
The obtained extracted features are then used for training and testing using differ-ent standard classifiers. To do that, Weka 3.6, a well-known open source software is used. Five different classifiers such as a)OneRule, b) Naïve Bayes, c) J48Tree, d) Multi-Layer Perceptron(MLP), e) SVM[6] are used here to evaluate the performance with 10 fold cross validation.
6
RESULTS
As mentioned before, the entire work is divided into parts: 1) automatic segmenta-tion of Islets of Langerhans 2) classificasegmenta-tion of image as normal or pre-diabetic im-age. It is worthy to mention here, in the paper[1], Ratio et al. used the manual seg-mentation to achieve their results. A picture of automatic segseg-mentation has been shown in Fig 3 and Fig. 4. From the images it can be said that the results are quite satisfactory when compared to the manual segmentation. Results of classification are shown in Table 1.From the Table 1, it is observed that maximum recognition accuracy observed for is84.3284% using MLP classifiers. It can also be observed that all the classifiers provide recognition accuracy above 70%. Furthermore, most of the classi-fiers used here (except One Rule)give ROC area higher than 0.8. The results indicate that the proposed automatic segmentation and classification algorithm can diagnose diabetic condition accurately in most of the cases. However, accuracy can vary de-pending on the classifiers and their specification selected. Comparative chart of using different classifiers is shown in Fig 5 and Fig. 6.
(a) (b)
Fig. 4. (a) Manual Segmentation of Islets of Langerhans by the method [1] (b) Automatic Segmentation of Islets of Langerhans from the same image
Table 1. Performanceof different classifiers using 10 fold cross Validation techniques
Fig. 5.Accuracy (%) of different classifiers
Fig. 6.Area under ROC Curve for different classifiers
60 70 80 90 A cc u racy
Classifier performance -Accuracy
OneR J48 Tree SVM MLP 0 0.5 1 A re a U nde r R O C curv eClassifier performance -ROC Area
OneR J48 Tree SVM MLP Classifier Correctly classified(in percent %) TPrate FP rate Precession recall F-measure ROC area
OneR 70.8955 0.709 0.305 0.71 0.709 0.709 0.702 J48 tree 78.3582 0.784 0.211 0.79 0.784 0.785 0.827 SVM 82.0896 0.821 0.169 0.829 0.821 0.822 0.826 MLP 84.3284 0.843 0.133 0.861 0.843 0.844 0.866 Naive Bayes 71.6418 0.716 0.319 0.714 0.716 0.712 0.837
7
CONCLUSION
The proposed segmentation model is capable enough to segment out the β-cell re-gions along with the surrounding Islets of Langerhans (which is more challenging to segment) without human intervention. The classification results can also be consid-ered satisfactory. Moreover all the classifiers (except ‘one rule’) used here gives ROC area higher than 0.8. That means the proposed automatic segmentation and classifica-tion algorithm can diagnose diabetic condiclassifica-tion accurately in most of the cases. How-ever, accuracy can vary depending on the classifiers and their specification selected. Further improvement in the results can be made by considering more robust features. Our algorithm cannot segment out the smaller β-cell areas in the images having mul-tiple β-cell regions. Moreover, the proposed algorithm is slow as it uses wavelet anal-ysis in a particular sub region. So, for real time implementation of this method some improvement should be done in the algorithm to achieve faster processing and to ad-dress multiple β-cell regions.
ACKNOWLEDGMENTS
The authors thank Professor Fernando Capela e Silva, from the Department of Biolo-gy and Ana R. Costa and Célia M. Antunes, from the Department of Chemistry, Uni-versity of Évora, Portugal, for the data set used in this article.
REFERENCES
[1]
L. M. Rato, F. C. e Silva, A. R. Costa, and C. M. Antunes,
“Analysis of pancreas histological images for glucose
intolerance identification using imagej-preliminary results,” in
4th Eccomas Thematic Conference on Computational Vision and
Medical Image Processing (VipIMAGE), 2013, pp. 319–322.
[2]
S. Arivazhagan and L. Ganesan, “Texture segmentation using
wavelet transform,” Pattern Recognition Letters, vol. 24, no. 16,
pp. 3197–3203, 2003.
[3]
A. Gavlasov´a, A. and Proch´azka, and M. Mudrov, “Wavelet
based image segmentation,” in Proceedings of the 14th Annual
Conference Techincal Computing, 2006, pp. 1–7.
[4]
“http://in.mathworks.com”, (last accessed 15
thJune 2016) .
[5]
“http://homepages.inf.
ed.ac.uk/rbf/HIPR2/adpthrsh.htm.”, (last
accessed 15
thJune 2016) .
[6]
B. Nunes, L. Rato, F. Silva, A. Rafael, and A. Cabrita,
“Processing and classification of biological images,” in
Technology and Medical Sciences, CRC Press, 2011, pp. 233–
237.
View publication stats View publication stats