1
A Work Project, presented as part of the requirements for the Award of a Master Degree in Management from the NOVA – School of Business and Economics
BALANCED SCORECARD ADOPTION: THE CASE OF THE MILAN TA TEAM AT BNP PARIBAS
MARCO ZONTA #2179
A Project carried out on the master in Management Program, under the supervision of Prof. Maria Joao Major
2
LIST OF ABBREVIATIONS BSC: Balanced Scorecard
BP2S: BNP Paribas Securities Services TA: Transfer Agent
IOC: International Operations Centre KPI: Key Performance Indicator
UCITS: Undertakings for Collective Investment in Transferable Securities SIP: Subject In charge of Payment
STF: Stock Transfer Form
SWOT: Strengths, weaknesses, opportunities and threats WF: Cirrus Workflow
KRI: Key Risk Indicator
ABSTRACT
This Work Project, written in the form of a Direct Research, is to develop a Balanced Scorecard (BSC), specifically designed for the Milan Transfer Agent (TA) Team of BNP Paribas Securities Services (BP2S), located in Warsaw. The goal is not to focus on the whole company, but to identify the main characteristics of the aforementioned team and to develop the BSC that suit it the most, according also to the strategy given by the corporation. As for all the BSC implementations, the purpose is to balance long-term goals, stemming from the corporate strategy and competitive advantage needs, and short-term objectives.
3
INDEX
I - INTRODUCTION ... 3
II - LITERATURE REVIEW ... 4
III – METHODOLOGY ... 9
IV - THE EMPIRICAL STUDY ... 11
V - THE DESIGNED BSC ... 20
VI - CONCLUSIONS AND CONTRIBUTIONS OF THIS WP ... 26
VII - APPENDIX ... 28
I - INTRODUCTION
The main research question this Work Project (WP) seeks to answer is how to develop a Balanced Scorecard (BSC) for a back-office outsourced team belonging to a multinational bank. More specifically, the study will be about the Milan Transfer Agent (TA) team of BNP Paribas Securities Services (BP2S) that runs its operations at the International Operations Centre1 (IOC), which is the European services centre of BNP Paribas carrying out supporting activities for many BNP Paribas Securities Services European branches. Although the work will have to move from corporate strategy and goals, the focus will be just on the team and its back-office activities. The first purpose by designing this BSC is to provide managers with a complete set of measures encompassing all the different areas that will enable the team to improve its performance and eventually achieve the set objectives. Moreover, the designing of this BSC may also highlight how it can change the established approach to performance measurement. Furthermore, implementing a BSC in this team may also give some insights on
1 International Operations Centre: it is the polish branch, under whose umbrella many functions (like private
4
how suitable it is on enabling the achievement of the different objectives that have to be reached.
The next section reviews the literature on BSC taken into consideration by the researcher. Section III describes the methodology followed in the development of the BSC. Section IV presents the empirical study while section V finally depicts the designed BSC. Section VI contains conclusions and main contributions of this WP.
II - LITERATURE REVIEW
The Balanced Scorecard (BSC) concept has been introduced by Robert Kaplan and David Norton in 1992. The former was a Harvard Business School professor, while the latter was a famous consultant. By merging their knowledge and their experience, they realised that traditional accounting practices were no longer appropriate, given the changes that economy had experienced with the introduction of new inventions. The authors claimed that a shift from industrial to information economy had occurred. That’s why they started thinking about a tool that gave a “fast and comprehensive view of the business” (Kaplan & Norton 1992, p.
1). Their underlying idea was that controlling and measurement of performance had not be seen as part of company’s strategy; they finally introduced the BSC in order to provide a
framework that translates strategy into a consistent set of measures (Kaplan & Norton 1993). BSC should have addressed also another critical problem, that’s the one of the link between
short and long-term goals (Kaplan & Norton, 2007). The BSC was thought to include four different perspectives: Financial, Customers, Internal processes, Learning and Growth. The tool should have comprised two categories for measures: Lead measures, whose function was to enable the firm to achieve targets of the lag measures, which is the other category, that mainly include financial performance indicators. The implementation path for BSC should start from clarifying and translating the vision and strategy, followed by the communication
5
of the strategy throughout the organization, after having set the goals and measures and linked the reward system to those measures. Then, consistent targets have to be set and, according to that, resources have to be allocated and strategic initiatives have to be aligned. Finally, managers have to give feedback in order to make strategy review and improvements easier (Norreklit, 2000). Over the years many scholars have contributed to the development of this tool. According to Perkins et al. (2014), three different generations of BSC can be identified. The first version evolved from the basic idea of a richer strategic tool to the introduction of targets and initiatives and then to the implementation of causality and strategic linkages between the different perspectives. The introduction of the causality between the objectives represents the real innovation brought by the BSC and it is why it moved from being a Performance Measurement Tool to a Performance Management Tool. What is called the BSC 2.0 was characterized by the adoption of a visual framework connecting strategy and everyday actions. Moreover, it was also transformed by the new role of Intangible Assets and how they can be translated into tangible assets. Basically, this version is known as Strategy Map. The last version of the BSC (3.0 version) is the only one that is not by Kaplan and Norton. The key contribution of this version is the concept of Destination Statement, which determines what the company should look like at a certain date. That would make easier the designing of the BSC by managers. Furthermore, the last BSC is much more concise as it comprises just two measures: Outcomes, which replace financial and customer perspective, and Activities, instead of Learning and Growth and Internal processes. This BSC version has been discussed by some authors, like Lawrie et al. (2004) and Shulver et al. (2000).
But what is BSC needed for? Basically, need for BSC arises when a gap between intended and implemented strategy exists. The BSC should give employees an idea on how they can contribute to the strategy and so it should improve the strategy execution (Dechow, 2012). According to Wiersma (2009), the purposes for which managers implement BSC can be
6
grouped into three categories: decision making, coordination and self monitoring. By the first aim, managers want to support problem solving and decision rationalization. Secondly, coordination means that managers aim at improving work integration, both their own tasks within the group and planning other people activities. The last reason is to make sure that individual goals are consistent with corporate’s ones. In addition to this, it can be said that
BSC can help to solve the existing trade-off between the maximization of decision quality and the limited processing capacity of decision makers, as it should contribute to overcome the “common measure bias”2 (Humphreys & Trotman 2011). In fact, BSC provides managers with strategy information and strategically linked measures; in few words, it gives a causal model that reduces cognitive complexity.
Although the BSC has been improved over these years, many criticisms have arisen as well. One of the first criticisms moved to the BSC is on the actual existence of cause-effect relationships between the different perspectives and measurements (Norreklit, 2000). The argument is quite important, since Kaplan & Norton (1992) claim this is the main difference between BSC and other performance measurement tools. Moreover, Norreklit brings some examples, for instance the relationship between customer satisfaction and profitability, saying that there’s no evidence to prove that a causal relation between the four perspectives really
exists, but that they are just interdependent. The relationship is not unidirectional. Furthermore, in the same paper some doubts about the validity of BSC as strategic control tools are expressed. These doubts are due to the impossibility to take into consideration all the stakeholders’ interest. According to Norreklit’s opinion, BSC would be too rigid and it doesn’t cope with external shocks that may prevent the firm from achieving its strategic goals.
In addition to this, Kaplan and Norton have not mentioned any possible problem for the BSC implementation, especially regarding motivation of employees in embracing this tool.
2 Overweighting of measures common to two different divisions, while measures used just for one division are
7
Norreklit criticizes the lack of attention towards the internal commitment3 of workers, saying also that goals alignment within the companies is taken for granted. What really matters in BSC implementation would be providing employees with a method, in order to let them understand what actions lead to the achievement of desired results. Lastly, companies have to solve a language issue; in fact they have to make sure that employees really understand the strategy and the meaning of the measures set by BSC designing. Furthermore, another criticism on the BSC is related to the time dimension. In fact, BSC would not consider that different initiatives and actions can different time span to get some outcomes (Johanson et al., 2006). The BSC is not able to distinguish between abstract and meaningful time4. That’s why an ongoing monitoring is required. Lastly, other disapprovals regard the lack of proper arguments and theoretical bases under the BSC (Norreklit, 2003). According to this researcher the BSC would be a proposal to fix old problems but without any theoretical base. The texts published by Kaplan and Norton would not fall into the “scholar category” as they just aim at catching reader’s attention by using metaphor, strong contrasts (like the one between
industrial and information era) and hyperboles, in order to overestimate the need for such a tool. To conclude, Norreklit believes that papers exposing BSC concept belong to Management Guru Text genre, and that the authors’ opinions are not backed by sound
arguments but just their prestige and university brand.
In addition to the already mentioned pitfalls in BSC designing and implementation, there is another one whose existence has been found, although it was one of the main issue that led Kaplan and Norton to conceive this tool (Bartlett et al., 2014; Hoque, 2014), that’s called the “non-financial performance bias”. Basically, it consists of the fixation of the managers and
evaluators on lag and financial measures, and it can be due to several causes; the most likely is the inability to translate leading performance effects on lagging ones. Bartlett et al. tried to
3 Internal commitment is motivation that comes from within, and not from external variables.
8
understand if this issue can be fixed by adding a strategy implementation timeline to the strategy map, and if it can enhance the effectiveness of performance evaluation. In the same paper, they investigated also how the understanding of the relation between leading and lagging measures is affected by the accountability of evaluators and consequently, how the role conflict5 problem evolves. The results of their research can be summarized in three main points. First, provision of a timeline, together with a visual representation, actually helps to overcome fixation on lagging measures and to break down complex problems. Awareness of temporal issues in relationships among metrics avoid managers from including measures whose outcome’s effects are beyond the controllable time horizon. Secondly, the effect of an
increase accountability of the evaluators cannot be determined ex-ante. On one hand, a more complete processing of information can reduce biases, but on the other hand it may also increase the dilution effect6. Thirdly, role conflict problem is lessened when evaluators are not accountable for subordinates’ performance and timeline is introduced, since they discriminate
more between beyond and in-time measures.
Apart from the one between financial and non-financial measures, other balancing problems can be found in the BSC implementation. One of the most important is probably the balancing of various stakeholders’ interests, besides the shareholders’ ones (Heidi et al., 2010). Two
possible ways of setting objectives can be identified within a company: Shareholders-centric, with unitary goal, and stakeholders-centric, which pays attention to every interested part. In particular, the second way sets new managerial challenges, as some objectives might be conflicting. There are two different approaches to deal with conflicting objectives. Prioritising, that means giving more importance to some goals, or satisficing, so trying to achieving a certain level of outcome for each goal. Management Control System are tools that
5 Disagreement between evaluators and subordinates regarding subjective performance evaluations.
6 Special conditions that require a search for all the information available to justify a decision. That may imply
9
should enable to align strategy, goals and individual behaviours, so it is apparent that first it is necessary to know all of them. In their paper, Heidi et al. (ibid) wonder how BSC enable balancing, since no final score is given and someone may argue that it could lead to contrasts and disappointment. The authors managed to identify three ways in which BSC can do that. First, it does that by recognising all the stakeholders and incorporating many objectives as important as others. That contradicts what Kaplan & Norton (2005) who believed that the financial performance is the endpoint, and all the perspective mentioned in BSC are only means to achieve that. Furthermore, by recognising different stakeholders’ goals, BSC lays
the foundations for day-to-day balancing. Secondly, by distinguishing between outcome goals and support goals, BSC allows managers to identify when conflicts may arise, to tackle them earlier and more effectively and to balance their attention. Lastly, BSC displays how improvements in one area affect other metrics. That doesn’t mean that a cause-effect exists
between the two measures, but at least a logical or finality relation does, so a manager undertakes a certain action because he thinks that is the best way to achieve his goal. The conclusion the author were able to draw from these three analyses is quite simple, and in part already mentioned in this thesis: BSC should be approached as a “thinking device” and that “balance is a temporal constellation” (Sundin et al., 2010, p. 213).
III – METHODOLOGY
As it has already been expressed in the introductive part, the main research question this Work Project (WP) seeks to answer is how to develop a Balanced Scorecard (BSC) for a back-office outsourced team belonging to a multinational bank. The real case will be about the Milan Transfer Agent (TA) team of BNP Paribas Securities Services (BP2S).
As already written at the beginning of the first section, this thesis falls into the Direct Research category. Nevertheless, it has to be said that it was possible only thanks to a four
10
months internship at BNP Paribas Securities Services. The time spent at the company’s premises allowed the researcher to observe the main processes undertaken by the team, the daily activities and to understand how the team was organized. The adoption of a BSC by this team was quite an interesting case for different reasons. First, the team operates in a market that is not very volatile and changing in terms of competitors and customer needs. This is quite a convenient environment for a BSC adoption as stability, regularity and connectivity are the most important features for a good understanding of the relationships between measures (Johanson et al., 2006). Secondly, performance controlling and monitoring are concepts already absorbed and widely accepted by team’s members, so the shock due to the implementation of a BSC is softened. In addition to this, team’s leader and deputy team
leaders are not perceived as being far from the other employees; that may reduce problems of managerial remoteness (Norreklit et al., 2008). Lastly, a set of KPIs is already in use, but it does not involve any perspective but the Internal Processes one. That’s why it might be
interesting to compare how the KPIs and their perception change with the adoption of the BSC.
The study conducted in order to develop the BSC followed a qualitative approach (see Mason,2002; Yin, 2015). Evidence for the investigation was gathered in two different moments. The first one occurred when the researcher attended trainings at the beginning of his internship, from the 1st to the 21st of February. Training allowed the researcher to observe interactions between actors of the Milan TA transfer team, and to get acquainted with the main actions and issues within the team. The second moment occurred later during the internship, approximately from the end of the training period to mid of April, when the researcher got permission to interview the team leader and deputy team leaders. Four interviews were conducted at this phase. The first interview was aimed to discuss the overall strategy and objectives sought for the project. After this, the researcher started formulating a
11
first draft of the BSC, with measures proposals and targets. The second and third interviews were used to discuss the proposed measures and targets, while the last one was used to review the whole work and for further suggestions and improvements. As it can be inferred by the sequence of the interviews a top-down approach was adopted, first identifying the main strategic goals, then objectives for each perspective and eventually measures and targets (Kaplan & Norton, 2003). Interviews took from one hour to sixty minutes to be completed. Written notes were used in order to keep record of the interviews. Figure 1 (see appendix) displays the date and location of the interviews and the interviewee’s position as well.
Along with interviews, team meetings and presentations were also useful to increase knowledge about the team and to listen about different opinions and point of views. In addition to this, files from IT systems were used, as well as documents provided during training sessions, presentations and an ongoing flow of information and advises by other employees. It is worthwhile to mention that the analysis started from the beginning of the training period, through a “progressive thinking” (Mason, 2002, p. 3), so observation that enabled the researcher to understand the situation and identify the main issues. That was extremely helpful to get a first idea about how to structure interviews and what kind of questions had to be addressed to the interviewees (Mason, 2002).
That is also how the researcher started drawing conclusions. By analysing interviews notes and the other sources, it was possible to have in mind all the variables and data that had to be taken into consideration and to realize what type of relationship existed among them (Miles & Huberman, 1994). Relationships proposed by the researcher were then reviewed during the interviews when critical feedback was provided.
IV - THE EMPIRICAL STUDY
12
BNP Paribas is a global corporation operating in 75 countries, whose core business activities can be divided into three main categories: (i) Retail Banking and Services; (ii) Corporate and Institutional Banking; and (iii) Other Activities, like Listed and Non-Listed Investment Management. BNP Paribas Securities Services (BP2S) falls in the second category, and it involves many activities concerning the post-trade needs of different market players, from Investment funds, banks, pension funds to retail banks. As stated in the company’s motto, “the bank for a changing world”, the main purpose of BNP Securities Services is to keep clients’ assets at safe, mitigate risk stemming from quick changes and give customers access
to asset services.
Transfer Agents (TA) Team belongs to this BNP fully owned company and it constitutes the communication line between the asset fund and the distributor (retail) bank. It keeps record of the registered owners and of the number of shares they own of each fund. It deals with the transfers of funds shares from one bank account to another, according to the willing of the retail customer. Furthermore, BNP takes care of collecting documentation, sending official communications to shareholders and processing corporate actions, like dividend payments. BNP is basically an intermediary between the retail bank and the Asset Management Fund (called UCITS), as it is in charge of the custody of the shares for UCITS’ shares owned by bank’s customers and it is also the player in charge of executing the payments from the fund
to the shareholder. There are different types of transfer, depending on whether the involved bank belongs to BNP’s network, the bank account holder, the urgency and the characteristics
of the UCITS’ transferred shares. More specifically, Milan TA Transfer team acts as a correspondent bank of foreign UCITS selling their shares in Italian market.
The organizational chart of the TA Team is quite flat as there are one team leader, two deputy leaders, in charge of their sub-team, and the rest of the team is more or less on the same level. Above the team leader there’s the Head of Transfer Agent Teams in Warsaw, who is not
13
involved in the daily activities and whose function is just to link different TA teams to the company. The team is composed of 22 people and each of them has both generic tasks, like first labelling of the incoming transfer orders, and specific ones, like dealing with one UCITS or taking charge of the flow of a delicate type of transfer. The organizational structure may also include managers belonging to Milan office, but they will not be taken into account as they will be consider as internal client to BNP Paribas Securities Services.
The environment BNP transfer agent team has to operate in is quite competitive, as many big players are offering the same services as BNP. What concerns is not the number of competitors but their size, since BNP has to cope with competition from companies like Société Generale, State Street, Monte dei Paschi di Siena and AllFunds. In addition to this, the competition is made even more fierce by the fact that the services these companies are able to provide are not very easy to differentiate. That doesn’t mean that the service is not
customizable but that customer needs are quite homogeneous as all the clients look at the quality of the service provided and at the time needed for the completion of the transfer. Due to the different communication mechanism and internal processes implemented by every UCITS and retail bank, BNP and its competitors can try to tailor their service to their counterparties’ needs, in order to reduce the amount of effort they have to put in the process.
This is another way to differentiate and customize the service and consequently to gain a competitive advantage over the competitors. Unfortunately, this takes time and money to invest in new trainings for the employees and it is not easy to implement. Quality of the service is obviously affected also by the reliability of the whole process, which can be measured by proxies like the number of mistakes or the number of claims over a certain time. Another element that increases the competition is that when a distributor bank start selling shares of a UCITS, it signs a univocal contract and it can rely on just one correspondent bank.
14
Obviously, that increases the competition between BNP and the other players in order to make sure to get the highest number of contracts.
By analysing more into deep Milan TA Transfer team’s structure and culture, it was possible
to pinpoint its main strengths and weaknesses as well as the opportunities and threats stemming from the external environment. First of all, it can be said that the skills, especially the language ones, of the employees of the team represent a great advantage. In fact, in the team there are four Italian native speakers and all the other team members have good proficiency in Italian language, since they spent some time, either studying or working in Italy. That really helps making the whole work of the team more fluent and easier as it avoid communicative issues with the workers in Milan office, it allows to write all the documents in Italian and it helps to create a more cooperative and cohesive relationship with the office in Italy. The second strength of the team is time efficiency and the good quality of the initial training provided to the new comers, in order to allow them to hit the ground running and start work in an efficient way in few weeks. Moreover, the training is carried out directly by team members. That increases the consistency of the job practices of all the newcomers. Thirdly, the overall environment within the team is not stressful at all and everyone is open to listen to suggestion in order to improve and speed up his work. Lastly, the environment at BNP offices in Warsaw is very stimulating as there are teams dealing with from all over Europe and people from different cultures and background work there. BNP is aware of this upside and a meeting for all team leaders is scheduled every month in order to share ideas and best practice from which all the teams could be better off.
On the other hand, it can be said that one of the main weaknesses is the few career opportunities within the team, given its flat organizational structure. That is why some people spend some months working for the team and then ask for a replacement in another team. That issue increases the turnover of employees, and consequently costs and time for new
15
trainings. Furthermore, a high turnover can hamper the climate within the team. In addition to this, it may decrease motivation and commitment of some employees. The second weakness comes from the organization itself of BNP. As already explained, Milan TA team is basically a service outsourced by the office in Milan and makes it an internal customer. That in turn means managers in Italy can impose decisions over the team in Warsaw and misunderstandings and failure in communication may arise.
When thinking about the external environment in which Milan TA transfer team has to work, you can easily identify some opportunities. They are mostly related to the business environment, rather than to possible product developments or technologies improvements. The first one is the fast growing market. According to managers, the main thrust to this growth is the increasing volatility of financial markets and the worsening conditions of some Italian banks that lead to migrations of shares. This volatility has also incentivized mergers and acquisitions in the Italian banking market. These processes are leading to an increase in the transfer volumes and to a more fierce competition among retail banks. In the future, that will probably mean that clients are going to change more frequently from one bank to another, according to fees and conditions.
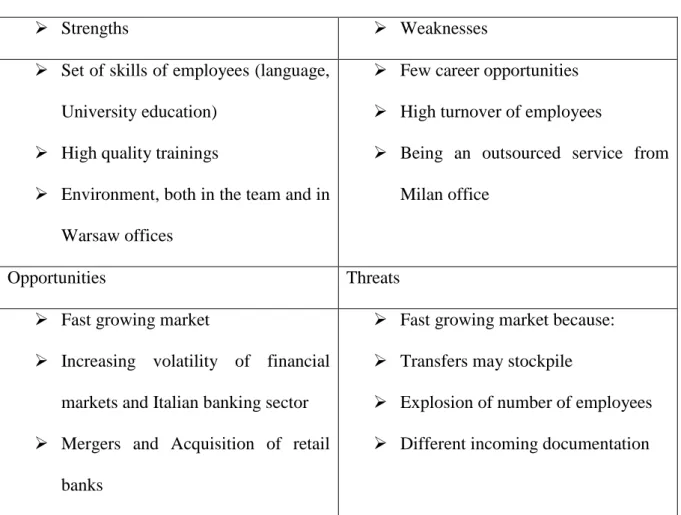
On the other hand, exploding market volume and fast growing market share can also be a threat because the workload can start being difficult to handle and transfer orders may stockpile. Moreover, acquiring new clients would imply an explosion of the number of employees needed in the team, as more people should be hired both for the generic processing of the transfers and for the relationship with the new UCITS. Lastly, new clients, like funds and retail banks, would mean different incoming documentations and slowing down processes. Main points of this SWOT analysis are summarized in Figure 2 (see appendix).
16
An overview of the team’s daily operation is needed because, as it became apparent after the
interviews had with the managers, the difference between the Internal Process Perspective and the Customer one is very thin. That probably stems from the impossibility to add more benefits to the value proposition the team is able to provide its clients. As already stated, it is true that the process might be tailored and customized according to clients’ needs, but at the same time all the clients are interested just in the process’ speed and accuracy. These two
features are strictly tied to their process drivers so it is quite hard to distinguish them. That is the reason why it is so important to display the whole process and its main steps. Moreover, this brief description will enable to introduce the IT system used by the team, that are worthwhile to know in order to better understand the Learning and Growth perspective of the designed Balanced Scorecard (BSC).
The process involves different players, starting from BNP Paribas Securities Services. BP2S belongs to the category called SIP (Subject In charge of Payment), which includes all its competitors that in this procedure act as counterpart of BP2S for the exchange of documents. The Asset Funds constitute the second category. Finally, another key partner in this procedure is the network bank, which is the distributor of the UCITS and the one in contact with the client retail, so the physical person who wants to transfer the shares.
There are two systems in use by the team. The first one is called Flash, an operative system to insert transfer’s orders and to generate STFs7 that will then be sent to the UCITS and the confirmations for the network banks. The second one is called Cirrus Workflow (WF) used to receive and manage all the transfer’s requests and to track their operation status. In fact, the
program split the transfers in different queues8, according to their operation status.
7 STF (Stock Transfer Form): SIP’s instruction sent to the UCITS to move the shares from one account to
another.
17
The procedure starts when a fax is sent either by an UCITS or by a network bank and enter in the WF system. If this fax is a transfer confirmation by an UCITS it is moved to the ‘closed queue’. In case the fax comes from a network bank or from another SIP, it is first labelled in the ‘triage queue’ and then moved to the ‘work’ one. At this stage, it is necessary that all the
data and documents required for the order processing have been received. If not, the case is not workable and it is moved to the ‘pending queue’. If all the needed validations have been
sent, then the different parts of a transfer can be matched. At this point the Milan Office assigned the daily objectives to the Warsaw’s team, prioritizing the older cases. This step is
basically about manually inputting in Flash, after verifying that all the information are correct. Through this step the transfers are divided into three categories, according to existing relationship between BP2S and the retail bank. If the bank that is going to receive the shares belongs to BNP’s network, while the sending one doesn’t, then the transfer is an “IN”, and in order to complete the procedure BNP has to add the account number and managers’ signature
to the STF. On the other hand, if both the banks are from within the BNP network then the transfer is labelled as “DT” (that stands for “Dossier Transfer”). If only the sending one belongs to BNP network the transfer is named “OUT”. In these two last cases the STF is generated by Flash and automatically sent to the UCITS. The case is moved to ‘conf-pend queue’, waiting for confirmation from the fund. Once the manual input on Flash is completed,
Warsaw team has to send the transfer instruction. In case it is dealing with a Dossier Transfer or a Transfer IN, instructions are sent to the UCITS that in turn execute the shares transfer. In case of a Transfer OUT, instructions are sent to the incoming SIP. The last stage of the process is the check of the confirmation provided by the UCITS with the instructions loaded on Flash. If all the information is consistent, then the transfer can be processed and sent to the closed queue. The flowchart representing the whole procedure is provided in Figure 3 (see appendix).
18
OBJECTIVE SETTING AND KPI USED BY THE TEAM
As already mentioned in the introductive part, the team is currently monitoring and controlling its operations through a set of KPIs. These KPIs are held in the form of Excel spreadsheets kept in shared folders so that everyone, either sitting at his desk in Milan or in Warsaw, can refer to it. Data are gathered and recorded daily and they are input manually by employees, according to a shift schedule set weekly. These KPIs are then reviewed jointly by managers from Milan office and by the team leaders in Warsaw. These measures are merely focused on team operations and they cover all the different working stages.
Another aspect is worth to mention is the internal organization within International Operation Centre. The polish branch has organized all the team it includes as cost centres. This means that the team is seen as an autonomous entity whose leaders are responsible for all the costs arising from team activity. That also means that revenues and costs cannot compensate for each other and saved costs or additional revenues cannot be retained. This also affects the goals that will be taken into consideration.
In addition to this, objectives coming from Milan office and IOC are then translated and communicated to employees by team leaders. These goals are discussed and shared during daily and weekly team meetings so that every employee can express his own opinion and providing his point of view. Moreover, individual meetings between deputy team leader and employee are scheduled quarterly. In these meetings deputy team leader provide each employee with an individual feedback on his performance and achievements; also, the deputy team leader is looking into suggestions, complaints or comments on every aspect concerning the team work.
19
Every consideration regarding a possible configuration of a Balanced Scorecard (BSC) for Milan TA Team has to start from the fact that this team’s operations do not generate any
additional revenue for BNP Paribas. As a matter of fact, transfers are an additional service offered free of charge to clients in order to encourage them to stay within BNP network or to leave their current correspondent bank and switch to BNP. Transitions to BNP network will in turn lead to more revenues since paid operations, like subscriptions of new shares or redemptions, will be commanded to the bank.
The objectives to Milan TA team are given basically by two actors. The first one is the office in Milan that originally outsourced the team. Secondly, objectives for Milan TA come from IOC management. Nevertheless, one main common objective can be identified. This objective is to have as many clients as possible within the company’s network, in order to maximize
earnings from other services. The target set by the top management is to become the biggest correspondent bank in the Italian market. Once this goal is achieved, the team has to meet other different needs. First of all, since the function of the team has been “outsourced”9 by the Milan office, other two basic objectives are given: production increase and cost reduction. In simplest terms, the Italian branch aims at keep growing and eating up market shares but not overreaching a given cost threshold, in order for the outsourcing to be a sensible decision. On the other hand, different goals are set by IOC, as its objectives are not necessarily aligned to Milan’s office ones, even if they are strongly affected by the latter. Basically, what IOC wants
to achieve is the largest possible cost reduction, but the rationale behind this operational internalization is wider. As already explained in the first part of the dissertation, the polish branch includes offices operating in different markets and belonging to different national branches of BNP Paribas group. All these teams have been pooled together because central
9 Outsourced has been written between quotation commas as is not a proper outsourcing case, since the activity
is still been provided by a company from the same group. Nevertheless, the distinction is important as it affects the objectives and goals for which this has been implemented. Managers prefer to say that this function has been “insourced”, as it is still provided by a company from within the same group.
20
management realized that “mother offices” were less open to changes and harder to innovate. This internalization aims at providing new perspectives to BNP’s operations and at reaching
new efficiency peaks, thanks to a more ambitious and well-educated workforce. At a first sight, the goals set by the two different stakeholders (the office in Milan and IOC) might seem more or less the same, but by going more into deep and talking with managers, it was possible to realize that they were stressing two different shades of meaning. On one side there is cost optimization by maintaining a given level of quality service. On the other side, there is a matter of efficiency, to be achieved by balancing decreasing costs and increasing volumes. A list of the strategy objectives is provided in Figure 4 (see appendix). The main challenge in designing the BSC probably will lie on meeting and balancing these two shades in objectives setting.
V - THE DESIGNED BSC
The designing of the Balanced Scorecard (BSC) embraced the first two and only part of third one of the stages provided by Kaplan and Norton (Kaplan & Norton, 1996). First of all, “clarifying and translating the vision” took place, by which strategy and broad objectives
were defined and expressed in a more practical way, in order to provide transparency, comprehension of the main drivers and motivation (LaChance, 2006). Secondly, communicating phase followed to set, integrate and discuss perspective goals and measures in order to ease intelligibility, empowerment and meaningfulness (Johanson et al., 2006). Finally, the planning and target setting part included only decisions about targets, while no study on proper initiative to implement was conducted. In replace of that, a part about the frequency of measurement was added to the BSC concerning the frequency of measurement, in order to fill the gap due to the lack of time perspective (Norreklit, 2000).
21
The BSC designed for the team of course moves from BNP Paribas Securities Services’ mission and vision. As displayed on corporate website, BP2S mission is “to be the leading
European bank with a global reach, the preferred long-term partner to our clients, and a contributor to responsible and sustainable growth”. By focusing just on Milan TA team, this
mission can be translated into being the first bank in the Italian market. The vision is to have a “positive impact on our stakeholders and society” through the delivery of first class services
thanks to the commitment and the expertise of their teams in order to be the “most trustworthy player in the industry”. BNP aims at offering its employees a stimulating and inspiring place
to work.
In order to achieve this vision and the strategy goals already presented in the previous section, nineteen measures belonging to the four different perspectives have been identified and after that depicted in a Strategy Map (see figure 5 in the appendix). Besides mission, vision and strategic goals, the definition of the objectives for each of the four perspectives is based on the SWOT analysis designed in the previous section, as it will be showed in each perspective explanation.
In order to cope with the increasing number of transfers but keeping the cost under the desired level, it has been decided to set as a key measure the number of cases (used as synonym of transfer) to employees ratio. It has been thought that if every employee manages to file 15 cases each day then this efficiency target has been achieved. At the same time, over the last two years an explosion in the number of over-time hours worked has been observed, due to the rocketing amount of work. In order to keep the first measure representative, and to not to see the overall cost rises since the over-time hours are paid 150% of the normal wage, a ceiling to this measure has been set a 80 monthly hours. The last measure concerning cost efficiency is not really related to the first two. In fact, it has been stated that the amount of fees and penalties paid by BNP because of mistakes must tend to zero. First of all, this
22
measure is tightly linked to quality of Internal Processes and customer satisfaction and secondly, it is just an unproductive cost for the company, so it is quite important to keep it as low as possible. Lastly, another measure has been added to the financial perspective, which at a fist sight it may look like a client perspective measure. This metric measures the number of transfers “IN” over the number of transfers “OUT”, setting the target at 175%. This measure
is important not only because it is a direct outcome of the quality of the work of the team, as good performance would enhance reputation that in turn leads to more client stepping into BNP’s network, but also because it is a direct expression of the strategic goal of becoming the leading bank in Italian market. As a matter of fact, if the transfers “IN” outnumber the transfer “OUT” that means that number of clients is increasing and the amount of assets under BNP
custody as well. Once these objectives had been defined, coherent lag and lead indicators were set for the other perspectives (Norreklit, 2000).
Moving to the client perspective, in order to attract new clients the team has to enhance its reputation among them. The only part of the process clients can see is the confirmation. That is why a measure on the number of mistakes made in confirmations has been set to be as close as possible to zero. In addition to this, another objective for client perspective is the number of customized services the team is able to offer to its big clients. Being able to do that increases the chances to work with the biggest distributors in the market, that bring more and more clients allowing to reach the last objective of the financial performance. Although these last two measures are not directly linked, the ability to offer tailored services to bigger players can be seen as a leading measure to increase BNP’s reputation. On the other hand, measures
about client satisfaction have been taken into consideration, in order to achieve financial goals on cost efficiency. The link between customer satisfaction and cost efficiency is explained by
23
the MyQueries10 tool. As already explained, retail banks have no way to monitor the working process of a case, except from the time. For this reason a platform for urging the completion of a case has been implemented. A MyQuery can be opened either by a network bank initiative (going through the Milan office), by employees in the office in Milan or by employees in Warsaw. Usually, a MyQuery is opened if the case takes too long to be processed or if it is more complex than the average. That is why the ratio between the number of MyQueries opened by retail banks and the total number of transfers has been taken as measure of client satisfaction. The more MyQueries clients have to open to urge a case’s completion, the less they’ll be satisfied. The same rationale stands behind the measure on time
needed to close a MyQuery. These two measures are considered as lead indicators for the last measure of the client perspective. In fact, being able to reduce the number of MyQueries and to cut down the time needed to close the open ones would save time to deal with the rest of the workload, and it would make easier to comply with deadlines set by contracts. This lag indicator is then important because it has direct consequences on the amount of fees and penalties the team will have to pay. In addition to this, less time spent on MyQueries issues means that it can be dedicated to remaining work, so you need less employees to get it done.
In order to achieve the client measures’ targets three different objectives for the Internal
Processes perspective have been considered. Time reduction is the first one and the measure originated by it is time needed to complete ‘triage’ and ‘matching’. This measure is extremely important because these two processes currently take two hours and a half to be carried out and they are very monotonous and repetitive. Such a boring task may end up decreasing workers’ motivation worsening the high turnover problems mentioned in the SWOT analysis.
Moreover, the second objective for this perspective is the quality and accuracy of the whole process. Once again, like in the client perspective, this is measured by the number of
10 MyQueries is an internal platform used to store all the information and communications on a given
24
MyQueries open. This time the ratio taken into consideration is the total number of MyQueries over the total number of cases. It differs from the measure mentioned in the client perspective because the numerator this time includes MyQuery open also by Milan and Warsaw office. That means that the difference between these two metrics is a good proxy for the effectiveness of the team in detecting its own mistakes before the clients get bothered with that. These two lead indicators are then crucial in order to free resources to keep up with the fast growing market without experiencing an explosion in the number of employees. These two are two of main threats mentioned in the SWOT analysis. The last objective for Internal Processes perspective is the amount of handled workload. This objective includes two lag measures. In fact, both of them are possible only thanks to the improvements presented in the first two. The first of the measures for this objective is number of cases in Back-log11. Decreasing the number of cases in Back-log means that the whole process will be shortened, as employees won’t have to work trying to reduce it, and cases on average will take much less to be worked. That directly affects the customer perspective’s measures on number of times
of exceeding deadlines. The last measure for this perspective is the number of daily objectives filed by the whole team. This metric is linked to the previous one as, in order to reduce the number of cases in Back-log, the number of daily objectives have to exceed the number of matched cases, that is also the target set for the measure.
Finally, for the Learning & Growth perspective five objectives have been identified. First of all, all the targets on efficiency, accuracy and working quality expressed in previous perspectives depends basically on three of these objectives. The first one is to improve the coordination among employees. Coordination means sharing best practices, knowledge and information. That is why it is so important for the team to monitor time spent on meeting sessions. Improving the coordination among employees and facing situations in the same way
11 Back-Log is basically the amount of workable cases that have not been worked yet, because of inability of the
25
can reduce mistakes and have a positive impact on other perspectives’ measures. In the same
way, achieving all the targets for the other perspectives requires to automate, at least partially, processes like ‘triage’, ‘matching’ or ‘confirmations’ processes. In order to do that, it is
needed to reduce the number of instructions coming in through fax system and increase the ones in excel format. That depends on the ability to negotiate with retail banks and UCITS and on being able to show them meaningful improvements. In fact, by automating these processes it would be possible not only to reduce time needed to complete them, but also the number of mistakes made by employees. Furthermore, in order to accomplish the desired improvements, IT systems and tools have to be changed and tailored to the flow of the process. The best proxy found for this objective is the number of change request12 implemented. It is based on the assumption that suggestions and request of changes made by employees who use the system should bring a lot more benefit as the changes implemented are more fitted to the use. In addition to the ones above mentioned, other two objectives have been set in the BSC. The first one is speeding up the process of on-boarding of the new comers. It has been decided that in case of need, a ratio of two hired employees in three months is suitable for team’s necessity. This measure is relevant for the team as the recruiting
process is mostly responsibility of the team leaders. Moreover, a measure on the number of weeks needed to achieve full autonomy by employees has been set. This can convey an idea about the efficiency of the trainings provided and also about quality of the recruitment process, as better employees are assumed to learn more quickly. Lastly, the team want to fix the issue of the high employee turnover, so it has been introduced an objective on the seniority of the team. The number of employees with less than twelve months of experience cannot be under the 15% of the team members. All these measures are important in order to
12 Improvements, suggestions for changes are made through an online procedures called 2S-TRACK. Providing
the type of problem or the investigation needed and his own User ID every worker can advise IT teams, either in Warsaw, Lisbon or Paris, according to the urgency and the type of problem.
26
face the problem of dramatic increase of workload in short time, already presented in the SWOT analysis.
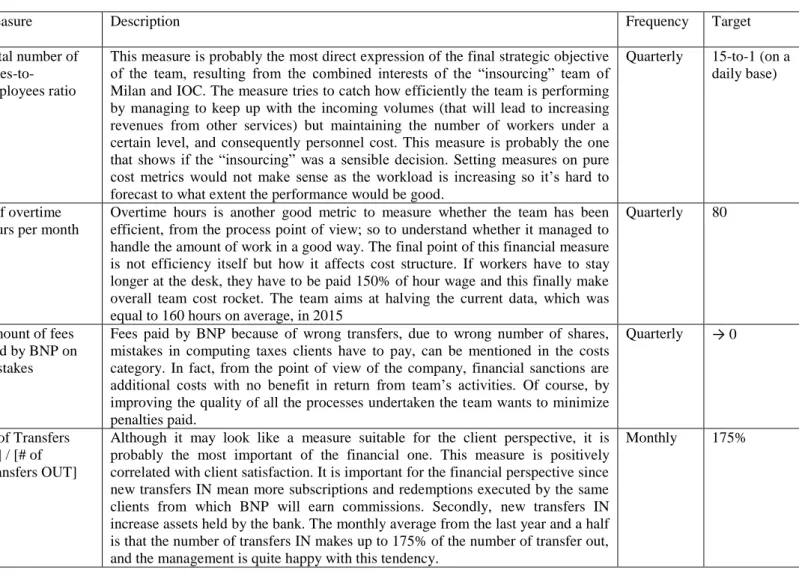
The objectives and measures for each perspective are displayed in Figure 6 (see appendix), along with a description of the measure, the frequency of measurement and the target.
VI - CONCLUSIONS AND CONTRIBUTIONS OF THIS WP
The outcomes of this work would have been different if the researcher had access to resources from the office located in Milan but this was not the case. The main difficulties found in the design of this Balanced Scorecard (BSC) stemmed from the nature of team’s operations since different objectives and perspectives were quite blurring, as it can be seen from the measures displayed in the final BSC showed in Figure 6. For instance, it was hard to identify the ratio between Transfers “IN” and Transfers “OUT” as a measure of the financial performance since
at a first sight it looked like an Internal Processes measure. The same might be said about the measure on the number of MyQueries open by clients over the number of transfers. This is to say that the nature of the team operation made difficult to get where a certain perspective ends and where another one begins. In this way it was also difficult to pinpoint suitable objectives for those performances. In addition to this, data collection for past performance, in order to get to sensible targets for measures, was not always easy as IT systems were not designed to provide it. An example for that could be the difficult process to extract the number of Transfers “IN” processed in each month or also the number of MyQueries that had been
opened over a certain period. That could be a suggestion for improvement in the future, as IT systems should be developed in order to provide needed data for monitoring teams activity, in case the designed BSC was implemented.
Nevertheless, the work required to design the final BSC was useful to provide the team leaders with different measures and perspective in evaluating the team performance, in
27
addition to the already implemented KPIs. In fact, the set of KPIs already in use by the team collected measures only about daily operations, such as number of mistakes in a given process. The BSC managed to include measures that could be seen as drivers of future performance enabling a long-term perspective. In addition to this, interviews and meetings needed to collect data and opinion allowed to focus on the real strategic advantages of the team and the upsides of being part of big company such as BNP Paribas. Moreover, the BSC threw light on the fact that the measures reported in the BSC are interdependent rather than linked by a one-way relationship (Norreklit, 2000). This stresses the fact BSC should not be used as a steady and fixed tool, but as an ongoing test of these relationship, since different perspectives causes changes each other (Campbell et al., 2015). Furthermore, by providing evidence of these relationships, the BSC may also motivate and incentivize improvements in areas that have been overlooked (Kaplan & Norton, 1993). Lastly, from a daily activities perspective, BSC can be very useful to the team in decisions like resources allocation and team meeting structuring (Sundin et al., 2010).
An interesting opportunity for further investigation relates to the study of the development of BSC for several teams and for the governance of IOC. The way performance measurement of teams whose activities are not necessarily interrelated interacts with a board BSC could say a lot on how different BSCs should be integrated. In addition to this, also finding if common ground can exist among different team performance measurement is worth to be studied.
28
VII – APPENDIX
Figure 1: Conducted Interviews
Interview Number
Date Place Interviewee Length
1 17/03/2016 BP2S Office Deputy Team Leader (A) 75 minutes
2 31/03/2016 BP2S Office Team Leader 75 minutes
3 01/04/2016 BP2S Office Deputy Team Leader (B) 60 minutes
4 07/04/2016 BP2S Office Team Leader 60 minutes
Figure 2: SWOT Analysis
Strengths Weaknesses
Set of skills of employees (language,
University education) High quality trainings
Environment, both in the team and in
Warsaw offices
Few career opportunities High turnover of employees
Being an outsourced service from
Milan office
Opportunities Threats
Fast growing market
Increasing volatility of financial
markets and Italian banking sector Mergers and Acquisition of retail
banks
Fast growing market because: Transfers may stockpile
Explosion of number of employees Different incoming documentation
29 Figure 3: Flow diagram of standard working process for a fax in Milan TA team.
30
Figure 4: Strategy objectives of Milan TA team
Common objective:
Achieve the highest possible number of clients, becoming the first correspondent bank in Italy Milan Office:
Keep up with workload Cost optimization
Maintain a given level of service quality
IOC:
Largest possible cost reduction Highest possible efficiency Innovate
31
Figure 5: Milan TA team Strategy Map
………. ………... ………. Seniority of the team IT tools improvements Improve coordination among employees Process automation
Learning and Growth Perspective
Quality/Accuracy
Time reduction Increase the amount of
handled workload
Internal Processes Perspective
Enhance reputation Meet contract deadlines Increase customer satisfaction Process customization for most important clients Increase incoming volumes Achieve highest possible cost efficiency Financial perspective Speed up on-boarding of new comers Customer perspective
32
Figure 6: Milan TA team BSC, with objectives, measures, descriptions, frequency of measurement and targets.
Perspective Objective #
Measure
Measure Description Frequency Target
Financial Achieve highest possible costs efficiency
1 Total number of cases-to-employees ratio
This measure is probably the most direct expression of the final strategic objective of the team, resulting from the combined interests of the “insourcing” team of Milan and IOC. The measure tries to catch how efficiently the team is performing by managing to keep up with the incoming volumes (that will lead to increasing revenues from other services) but maintaining the number of workers under a certain level, and consequently personnel cost. This measure is probably the one that shows if the “insourcing” was a sensible decision. Setting measures on pure cost metrics would not make sense as the workload is increasing so it’s hard to forecast to what extent the performance would be good.
Quarterly 15-to-1 (on a daily base)
Financial 2 # of overtime
hours per month
Overtime hours is another good metric to measure whether the team has been efficient, from the process point of view; so to understand whether it managed to handle the amount of work in a good way. The final point of this financial measure is not efficiency itself but how it affects cost structure. If workers have to stay longer at the desk, they have to be paid 150% of hour wage and this finally make overall team cost rocket. The team aims at halving the current data, which was equal to 160 hours on average, in 2015
Quarterly 80
Financial 3 Amount of fees
paid by BNP on mistakes
Fees paid by BNP because of wrong transfers, due to wrong number of shares, mistakes in computing taxes clients have to pay, can be mentioned in the costs category. In fact, from the point of view of the company, financial sanctions are additional costs with no benefit in return from team’s activities. Of course, by improving the quality of all the processes undertaken the team wants to minimize penalties paid.
Quarterly → 0
Financial Increase incoming
volumes
4 [# of Transfers IN] / [# of Transfers OUT]
Although it may look like a measure suitable for the client perspective, it is probably the most important of the financial one. This measure is positively correlated with client satisfaction. It is important for the financial perspective since new transfers IN mean more subscriptions and redemptions executed by the same clients from which BNP will earn commissions. Secondly, new transfers IN increase assets held by the bank. The monthly average from the last year and a half is that the number of transfers IN makes up to 175% of the number of transfer out, and the management is quite happy with this tendency.
33
Client Increase customer’s
satisfaction
5 # of MyQueries
opened by external clients/ Total transfers
The numerator is just the total MyQueries13 minus the ones opened by someone
working in BNP, either in Milan or in Warsaw. External clients cannot see mistakes in BNP processes, so they open a MyQuery when there is too much delay, and this is mainly due to mistakes in the working process. So this measures directly depends on how efficient the team has been in pointing its own mistakes, not making clients notice that. This ratio is a measure of satisfaction of the distribution network on teams’ work quality. This measure is directly linked to the measure #13.
Monthly ≤ 1%
Client 6 Average time for
closing a query
Time for solving problems issued through a query is also a good proxy for client satisfaction
Weekly 1 day
Client Enhance reputation
among clients
7 # of wrong
confirmations
Although this might look like an Internal Processes measure, and it is actually the direct outcome of the whole internal working process, it is a very important metric for BNP reputation among clients as this is the only thing that external clients can see of the whole process. So clients obviously are not aware of mistakes in ‘matching’ or other processes, but they can just see the final outcome. Moreover, a wrong confirmation has to be followed by a correction or the issue of a new case; that means additional work for the team. Even worse, when a wrong number of shares are moved, BNP may end up paying for the mistake; so this metric is also important for the financial measure that aims to keep fees paid because of mistakes under control.
Weekly → 0
Client Meet contracts deadlines 8 # of time
exceeding contract deadlines
This measure express how many times Milan TA team took longer than what has been written in the contract to complete a transfer. This measure not only affects BNP’s reputation, but it is also a key influencing factor of the financial perspective, as it may generate fees and penalties, according to contracts provisions
Monthly → 0
Client Process customization
for most important clients
9 # of new
customized services offered
Number of customized services offered is really important to the team as it can give a measure of ability to attract big distributors that are the ones that bring the highest number of new clients, enabling the team to achieve target set for the number of transfers IN. That is why is crucial to attract big network banks by offering them special services that better fit to their internal procedures and that prove to be less costly to them. It can mean either offering them tailored processed or special contractual conditions. This measure somehow goes against the ones established on Learning & Growth regarding process automation and standardization, but it is very important for the above mentioned reasons. In addition to this, the achievement of this target is enabled right by the resources freed from those processes optimization.
Annually 3
13 MyQueries is an internal platform used to store all the information and communications on a given problematic case. It is a tool to speed up the completion of a case and to
34
Internal Processes Time reduction 10 Average time
taken to complete Triage and matching procedures
As already explained, ‘triage’ is a first action of sorting and labelling incoming faxes. ‘Matching’ is the second working stage, and it is about matching documents belonging to the same case and coming from UCITS, network bank, or other SIPs. These two processes on average takes 2 hours and 30 minutes every day and this is hampering because, besides the amount of time it requires, it is a mechanical and not very stimulating duty; that is why spending so much time on it can decrease motivation of workers. This in turn leads to the L&G perspective, in which some measures of automation will be needed in order to cut down time spent on these activities. As it will be expressed in the next perspective, the aim of the team is to automate these processes except for most complicated cases that will be still worked manually.
Daily 1h and 15 minutes
Internal Processes Increase amount of handled workload
11 # of cases in Back-Log
The number of cases in Back-Log is important because it is a first measure of effectiveness of the team but it is important also because it affects the whole process, as it requires team leaders every day to ask 3 or 4 workers to spend the whole trying to reduce it. To summarize, the back-log is important because it absorbs resources of the team and it slows the work down.
Daily 600
Internal Processes 12 #of daily
Objectives
This measure is a direct consequence of the previous one since, in order to reduce the Back-Log, the number of Objectives14 has to exceed the number of matched
practices of that day. In order to keep the back log at the same level, the number of objectives filed in one day has to be about 80% of the matched file (since on average 20% of them need for extra documentation, so they are sent to pending queue). That is why, in order to reach back-log objective, completing as many objectives as many matched cases is a desirable goal.
Daily ≥ Matched cases
Internal Processes Quality/Accuracy 13 # of MyQueries/# of transfers
A MyQuery can be opened by a Warsaw team member, by a Milan team member, either on personal initiative or by a client request, depending on who found out the mistake. The current data shows that the percentage is slightly above 3%, and the management would like to keep it stable. This measure is really important because it affects both the final working time and the accuracy. It affects time because if documents are wrongly matched or filed they have to be sent to the ‘pending’ queue, waiting for the right match, and they require also additional work. Secondly, a wrong not recognised match may cause filing a wrong instruction to the UCITS and eventually a reputation damage.
Weekly 3%
Learning & Growth Improve coordination among employees
14 Time per week
spent on meeting sessions
Time spent on team meetings helps to create a more cohesive environment, to share best practices and to solve coordination issues. Two types of team meeting are currently taking place. A daily one, held in an open space, that everyone attends, and a weekly one, attended by people belonging to that sub-team. The
Weekly 1 hour