Assessing the Professional Growth of Post
Secondary Students Studying the Education
Applications of Emergent Technologies
Rick Mrazek, Doug OrrUniversity of Lethbridge
[email protected], [email protected]
Resumo: As avaliações “Level of Use of an Innovation” e o “Stages of Concern” são componentes
chave do modelo CBAM (Concerns-Based Adoption Model). Estas ferramentas provêem uma clara articulação e caracterização do nível de adoção de tecnologia educacional na inovação organizacional. Uma adaptação do LoU foi empregada para avaliar mudanças no entendimento da competência com tecnologias educacionais pelos participantes de um curso de pós-graduação focado no uso das tecnologias emergentes para o desenvolvimento profissional. O instrumento reflete os critérios originais da ferramenta LoU, mas foi adaptado para utilizar uma escala estruturada de auto-resposta do índice ‘nível de uso’ para promover uma auto-reflexão colaborativa. Os resultados indicam o crescimento no conhecimento, e da confiança, com as tecnologias emergentes, dando suporte ao uso da reflexão colaborativa e da avaliação do processo de desenvolvimento profissional para incrementar o crescimento profissional.
Palavras-chave: desenvolvimento profissional, auto-reflexão colaborativa, tecnologias emergentes.
Abstract. The “Level of Use of an Innovation” (LoU) and “Stages of Concern” (SoC) assessments are
key components of the Concerns-Based Adoption Model (CBAM). These tools can provide a clear articulation and characterization of the level of adoption of an organizational innovation in educational technology. An adaptation of the LoU was used to assess changes in understanding of and competence with educational technologies by participants in a graduate level course focused on the use of emergent technologies in professional development. The instrument reflected the criteria framework of the original LoU assessment tool, but was adapted to utilize a specifically structured self report scale of the “level of use” index to promote collaborative self-reflection. Growth in knowledge of, and confidence with, specific emergent technologies is clearly indicated by the results, thus supporting the use of collaborative reflection and assessment of the professional development process to foster professional growth.
Keywords: professional development, collaborative self-reflection, emergent technologies.
I BACKGROUND
The “Level of Use of an Innovation” (LoU) and “Stages of Concern” (SoC) assessments, identified by Hall, et al (1975), as key compo-nents of the Concerns-Based Adoption Model (CBAM) can provide an articulation and charac-terization of the stages of adoption of an organizational innovation. The LoU has been identified as “a valuable diagnostic tool for planning and facilitating the change process” (HALL & HORD, 1987). The LoU is intended to
describe the actual behaviors of adopters
rather than affective attributes (HALL, et al,
1975).
The thoughtful use of the LoU and SoC by a “professional learning community” (DUFOUR &
EAKER, 1998) or a “community of professional
practice” (WENGER, 1998) may allow members
of such a community to self-assess their process and progress toward adoption of an innovation and to identify critical decision points throu-ghout the process. An adaptation of the LoU was previously used by one of us working with
teachers in a school jurisdiction to allow members of that particular professional com-munity of practice to self-assess personal and systemic professional growth during the course of the implementation of a staff development program. Components of the LoU and SoC indices have been adapted by various resear-chers to assess and facilitate personal, collec-tive, and systemic professional growth during planned processes of implementation and adoption of educational technology innovations (BAILEY & PALSHA, 1992; GRISWOLD, 1993; ADEY,
1995; NEWHOUSE, 2001; GERSHNER, SNIDER & SHAR -LA, 2001.) We were interested in investigating
the potential for using an adaptation of the level of use index as a tool to describe professional growth among professionals pursuing graduate course work in educational technology.
During “summer-session” (May-August) 2007 we taught a blended delivery graduate level education course at the University of Lethbridge (Alberta, Canada) titled “Using Emergent Technologies to Support School Im-provement.” During May and June students accessed readings, assignments, and instruction online via the university’s learning management system (LMS). For two weeks in July the class convened in an intensive daily three-hour on-campus format. Following this, class activities concluded again online via the LMS. The stu-dents in this course were classroom teachers and school administrators who brought to the class a range of experience and expertise with educational technologies. The course instruc-tors wished to ascertain (a) what levels of expe-rience, expertise, and confidence with various technologies students were bringing to the class, and (b) if this experience, expertise, and confidence changed as a result of class parti-cipation. To that end, a LoU index questionnaire was adapted and administered to students in the class via the LMS survey function.
II DESIGN AND DATA COLLECTION
While a focused interview format is traditio-nally used to collect LoU data (HORD, et al, 1987;
GERSHNER, SNIDER & SHARLA, 2001), the
adapta-tion of the LoU used in this study utilized a
specifically structured self-report scale of “level of use” to allow participants to self-reflect through the reporting process. The original “Level of Use” matrix (HALL, et al, 1975)
iden-tifies eight levels or stages of adoption of an innovation: “non-use”, “orientation”, “prepara-tion”, “mechanical use”, “routine”, “refine-ment”, “integration”, and “renewal”.
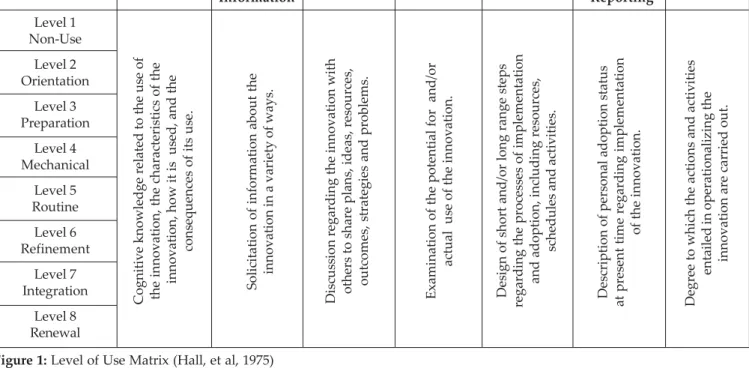
Each of these levels of adoption is further defined in the terms of the attributes or actions of participants regarding “knowledge”, “acqui-ring information’, “sha“acqui-ring”, “assessing”, “plan-ning”, “status reporting”, and “performing” as indicated by Figure 1. This complex of des-criptors from the original CBAM/LoU (HALL,
et al, 1975) was not used directly in our appli-cation as an assessment of level of adoption of educational technologies, but rather was uti-lized to frame precise stem structures and level descriptors related to the specific educational technologies of interest.
As the attribution of level of use in our application is self-reported, attention was paid to the design of the LoU for this purpose and in this format in order to be able to address issues of content validity (NEUMAN, 1997).
The validity of an instrument utilized in this fashion depends primarily on the researchers’ skill in framing accurate and focused descrip-tors. In this instance, it was critical to ensure that the self-report scale devised was as spe-cific as possible and accurately described the kinds of behaviors and changes in professional knowledge and praxis which we wished to assess. The response choices were worded iden-tically for each stem related to each specific technology adoption being investigated.
Further, it was deemed important to use identical “radio buttons” or “check boxes” to identify individual choices rather than num-bers (0, 1, 2, 3, etc.) on the respondents’ forms used to assess their own level of adoption, so that no implied value was associated with a specific response. (See Figure 2.) The “levels” of the LoU in this application should not and do not imply a hierarchical progression, but rather a nominal description of the state of the community’s adoption of an innovation.
Categories
Levels of Use Knowledge Acquiring Sharing Assessing Planning Status Performing
Information Reporting
Cognitive knowledge related to the use of the innovation, the characteristics of the
innovation, how it is used, and the
consequences of its use.
Figure 1: Level of Use Matrix (Hall, et al, 1975)
Solicitation of information about the
innovation in a variety of ways.
Discussion regarding the innovation with others to share plans, ideas, resources,
outcomes, strategies and problems.
Examination of the potential for and/or
actual use of the innovation.
Design of short and/or long range steps
regarding the processes of implementation
and adoption, including resources,
schedules and activities.
Description of personal adoption status
at present time regarding implementation
of the innovation.
Degree to which the actions and activities
entailed in operationalizing the innovation are carried out. Level 1 Non-Use Level 2 Orientation Level 3 Preparation Level 4 Mechanical Level 5 Routine Level 6 Refinement Level 7 Integration Level 8 Renewal Θ Θ Θ Θ
Θ I really don’t know anything about this technology, or I am not sure that it would be useful for my classes I have some information about this technology, and I am considering whether it might be useful for my classes Θ
Θ Θ Θ
Θ I now know enough about this technology that I am preparing to use it for my classes Θ
Θ Θ Θ
Θ I am using this technology now and I am primarily focused on learning the skills necessary to use it properly and effectively for my classes
Θ Θ Θ Θ
Θ I use this technology routinely without much conscious thought, and my use of this technology is fairly routine for my classes
Θ Θ Θ Θ
Θ I use this technology regularly, and I am implementing ways of varying its use to improve the outcomes derived for my classes
Θ Θ Θ Θ
Θ I am collaborating with colleagues to develop ways in which we can use this technology to better meet our common objectives for our classes
Θ Θ Θ Θ
Θ I still use this technology, but I am exploring other technologies to replace it that will better meet the objectives for my classes
Figure 2: Level of Use Descriptors adapted by Douglas Orr, from: Hord, et al (1987)
Results were considered (for purposes of analysis) in an ordinal fashion – indicating de-gree of adoption with respect to the “level of use.” It is our contention that, as this use of the LoU index is intended to inform professio-nal praxis and development, the instrument may be administered subsequently to the same participants in an identical form throughout the process of a professional development
pro-gram (in this instance a graduate course in educational technology) to assess efficacy of the program and to provide a self-reflective “mirror” for participants in the professional development program.
The LoU, in this fashion, can be used to collect information over time, sampling a po-pulation at various points throughout the im-plementation of an innovation in practice – one
of the strengths of this type of tool. If the des-criptor stems and responses are framed care-fully and appropriately, the same survey can be repeated at various times during a project and the results can reasonably be expected to provide useful longitudinal data about change in professional understanding and practice.
In this particular application – where the intention is to facilitate collaborative decision making, professional growth, and personal reflection – the LoU survey asks participants to self-identify their own levels of adoption of various educational technologies. Respon-dents selected a “level of use” descriptive of their perceived level of knowledge, utilization, confidence, or competence; ranging from “non-use” through “orientation”, “preparation”, “mechanical use”, “routine”, “refinement”, and “integration”, to “renewal”; consistent with the eight levels of adoption of an innovation defined by the “Level of Use” index (HALL, et
al, 1975; HALL & HORD, 1987; HORD, et al, 1987).
Respondents in this instance identified their level of use of twenty common educatio-nal/instructional technologies: web browsers, word processing software, spreadsheet softwa-re, mind mapping softwasoftwa-re, e-mail/web-mail, presentation software, video playback softwa-re, video production softwasoftwa-re, web site deve-lopment software, image processing software, database software, videoconferencing, lear-ning/content management systems, interactive whiteboards, interactive conferencing/brid-ging software, digital still cameras, digital vi-deo cameras, document scanners, scientific/ graphing calculators, and laboratory probe-ware/interface systems.
III RESULTS
For this study, a class cohort of twenty-six graduate students was surveyed concerning their level of use of various educational tech-nologies twice during this summer-session course and again four months after the con-clusion of the course. Students responded to three identical, twenty-item, level of use surveys via the class online learning
mana-gement system – the “pretest” survey posted in June prior to the students’ arrival on cam-pus, the “posttest” survey posted in August after the conclusion of the on-campus course component, and the “post-posttest” survey posted in December of the same year.
Twenty-five students (96%) responded to the “pretest” survey, twenty-two (84%) respon-ded to the “posttest” level-of-use survey, and seventeen (65%) responded to the post-post-test survey. Twenty-one students (81%) respon-ded to both the pretest and posttest surveys, while fifteen (58%) responded to all three (pre-, post-(pre-, and post-post-) surveys. Comparison of these three data sets reflects changes in self-reported knowledge and utilization of, and confidence and competence with, emergent educational technologies.
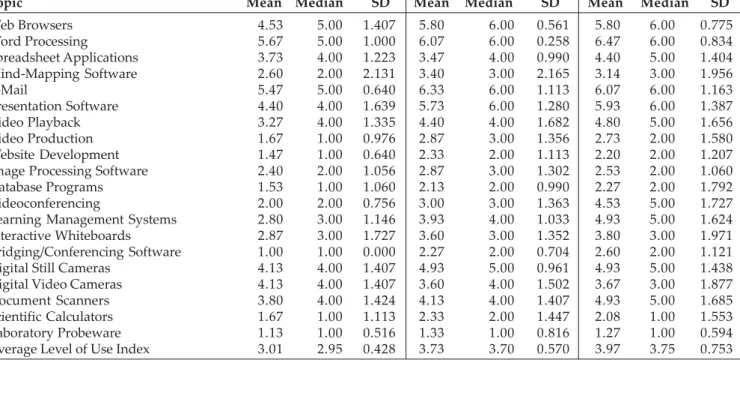
To reflect the possible potential for the use of this instrument as an indicator of change in praxis during and following a professional development program, we chose to restrict our analysis of results to the responses from the fifteen participants who completed all three administrations of the instrument. Due to the relatively small size of this data sample, we have avoided rigorous statistical investigation of the data and focused on inferences we believe can reasonably be drawn from the descriptive analyses, and in the context of professional development and change in professional praxis. Results (Table 1) indicate self-reported in-crease of use for all twenty technology catego-ries, and an increased “average level of use” (average of category means.)
Peripheral technologies, which were commo-nly used by students and instructors during the course but not directly addressed by the instructional activities (such as web browsers, word processing, spreadsheet applications, and e-mail) nevertheless revealed increased repor-ted levels of use over the three administrations of the survey. The results for the use of “presen-tation software” (such as PowerPoint and Key-note) are worth noting. The use of this techno-logy was not directly taught to students, but was consistently modeled by instructors throu-ghout the on-campus course component.
Results (Figure 3) indicate a noticeable change from self-reported relatively low levels of use to considerably higher levels of use. The mean and median values increased from 4.40 to 5.93 and 4.00 to 6.00 respectively between the pretest and post-posttest administrations. And, interestingly, a number of students selec-ted this technology as a topic or medium for their class projects.
Table 1: Mean, Median, and Standard Deviation by Category
Pre-Test Post-Test Post-Post-Test
Topic Mean Median SD Mean Median SD Mean Median SD
Web Browsers 4.53 5.00 1.407 5.80 6.00 0.561 5.80 6.00 0.775 Word Processing 5.67 5.00 1.000 6.07 6.00 0.258 6.47 6.00 0.834 Spreadsheet Applications 3.73 4.00 1.223 3.47 4.00 0.990 4.40 5.00 1.404 Mind-Mapping Software 2.60 2.00 2.131 3.40 3.00 2.165 3.14 3.00 1.956 E-Mail 5.47 5.00 0.640 6.33 6.00 1.113 6.07 6.00 1.163 Presentation Software 4.40 4.00 1.639 5.73 6.00 1.280 5.93 6.00 1.387 Video Playback 3.27 4.00 1.335 4.40 4.00 1.682 4.80 5.00 1.656 Video Production 1.67 1.00 0.976 2.87 3.00 1.356 2.73 2.00 1.580 Website Development 1.47 1.00 0.640 2.33 2.00 1.113 2.20 2.00 1.207
Image Processing Software 2.40 2.00 1.056 2.87 3.00 1.302 2.53 2.00 1.060
Database Programs 1.53 1.00 1.060 2.13 2.00 0.990 2.27 2.00 1.792
Videoconferencing 2.00 2.00 0.756 3.00 3.00 1.363 4.53 5.00 1.727
Learning Management Systems 2.80 3.00 1.146 3.93 4.00 1.033 4.93 5.00 1.624
Interactive Whiteboards 2.87 3.00 1.727 3.60 3.00 1.352 3.80 3.00 1.971
Bridging/Conferencing Software 1.00 1.00 0.000 2.27 2.00 0.704 2.60 2.00 1.121
Digital Still Cameras 4.13 4.00 1.407 4.93 5.00 0.961 4.93 5.00 1.438
Digital Video Cameras 4.13 4.00 1.407 3.60 4.00 1.502 3.67 3.00 1.877
Document Scanners 3.80 4.00 1.424 4.13 4.00 1.407 4.93 5.00 1.685
Scientific Calculators 1.67 1.00 1.113 2.33 2.00 1.447 2.08 1.00 1.553
Laboratory Probeware 1.13 1.00 0.516 1.33 1.00 0.816 1.27 1.00 0.594
Average Level of Use Index 3.01 2.95 0.428 3.73 3.70 0.570 3.97 3.75 0.753
Of greatest interest to us were the results for videoconferencing, learning management system, interactive whiteboard, and conferen-cing/bridging technologies; as these topics were the foci of specific teaching-learning acti-vities in the on-campus course component.
The pretest results regarding, for example, videoconferencing (Figure 4) indicated that thirteen of fifteen respondents either had little
7 6 5 4 3 2 1 0
Level 1 Level 2 Level 3 Level 4 Level 5 Level 6 Level 7 Level 8 Survey
PreTest
Post-Test
Post-PostTest
Figure 3: Reported Levels of Use of Presentation Software
12 10 8 6 4 2 0
Level 1 Level 2 Level 3 Level 4 Level 5 Level 6 Level 7 Survey
PreTest
Post-Test
Post-PostTest
or no knowledge regarding or were merely “considering” the usefulness of educational vi-deoconferencing; while the other two respon-dents reported themselves to be “preparing” and “focusing on learning skills necessary” to use videoconferencing technologies respecti-vely (mean=2.00, median=2.00).
By the conclusion of the course in August there was an obvious, and not unexpected, in-crease in reported level of use (mean=3.00, median=3.00). It is most important to note the significant (p<0.005) increase in reported level of use as these students (practicing educatio-nal professioeducatio-nals) returned to the workplace and had the opportunity to access and apply these technologies within their schools (mean =4.53, median=5.00). Nine respondents repor-ted their level of use as “routine” or higher.
Similar findings regarding reported conti-nuing professional growth and positive chan-ge in praxis were reported for learning mana-gement system, interactive whiteboard, and bridging/conferencing technologies. A com-prehensive learning management system (LMS) was used to deliver, complement, and supple-ment instruction for these graduate students throughout both the off-campus and on-cam-pus components of the course.
These students (all practicing educational professionals) were expected to use this LMS to engage in collaborative discussions, to access assignments and readings, and to post written assignments. One topic specifically covered during the on-campus course component was the application of learning management sys-tems in K-12 classrooms. As with videoconfe-rencing, results indicated a noteworthy change in reported use of this technology over the course of this study (Figure 5).
Initially thirteen of fifteen respondents re-ported themselves to be at level one (“non-use”) or two (“orientation”), with the highest level of use (one respondent) reported merely as “mechanical use” (mean=2.80, median= 3.00). By December (following the conclusion of the course and return to the workplace) ei-ght respondents indicated LMS levels ranging
from “routine,” to “refinement,” to “integra-tion” (mean= 4.93, median=5.00).
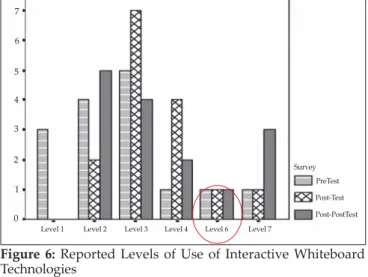
The changes in level of use reported for in-teractive whiteboard technologies (Figure 6) were relevant to the context of this course, as this technology is being introduced into many schools. During the on-campus class we spe-cifically instructed students about the class-room use of this technology and demonstrated its application supporting instruction delive-red via videoconference.
It is worth noting reported levels of use re-garding “orientation” and “preparation” bet-ween the August survey (administered at the
8 7 6 5 4 2 1 0
Level 1 Level 2 Level 3 Level 4 Level 6 Level 7 Survey
PreTest Post-Test
Post-PostTest
3
Figure 5: Reported Levels of Use of Learning Management Systems
12 10 8 6 4 2 0
Level 1 Level 2 Level 3 Level 4 Level 5 Level 7 Survey
PreTest
Post-Test
Post-PostTest Level 6
Figure 6: Reported Levels of Use of Interactive Whiteboard Technologies
end of the class) and the December survey (administered after these practitioners had returned to their school districts).
This result may provoke further questions concerning participants’ perceptions of the “potential” use of a technology (perhaps surfa-ced during the class?) and their “actual” use of the technology once back in the schools. Of note, nevertheless, is the increase in the num-ber of respondents reporting themselves as engaging in collaborative use of these techno-logies at the “integration” level for both inte-ractive whiteboard and LMS technologies.
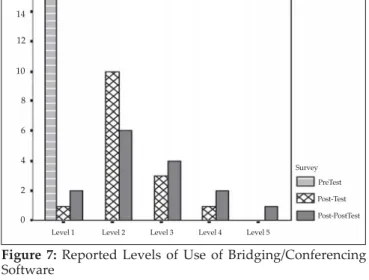
The significant (p<0.001) results for the re-ported use of bridging/conferencing software (Figure 7), perhaps reflect the introduction of a technology with which these professional educators had little or no previous experience. Of note was the number of respondents (four) reporting “preparation” for use, and the three respondents reporting either “mechanical” or “routine” use of this technology on the De-cember post-posttest survey, and the conco-mitant increase in the mean reported level of use from 1.00 to 2.60.
The National Staff Development Council (2003) identifies collaborative practice within learning communities as a vital component of authentic and efficacious professional growth and change. 12 10 8 6 4 2 0
Level 1 Level 2 Level 3 Level 4 Level 5 Survey PreTest Post-Test Post-PostTest 16 14
Figure 7: Reported Levels of Use of Bridging/Conferencing Software
Of particular interest, in terms of the deve-lopment of communities of professional prac-tice is the move from “skill development” and “mechanical” levels of use to “refinement” and “collaborative integration” which is reflected in these results.
IV DISCUSSION AND CONCLUSION
Questions concerning the accuracy of data are always of concern. Clearly the number of participants involved in this administration of the self-reported level of use index survey limits the ability to establish effect-size chan-ges, or to explore questions of reliability. Ne-vertheless, it is worth considering within the context of a community of professional practi-ce, strategies for promoting the validity and reliability of responses in order to corroborate the potential of this type of information-gathe-ring to support collaborative professional de-velopment initiatives.
We posit that it is critical to create a sup-portive, collaborative, and intellectually and emotionally secure professional community of learners before asking participants to use a self-reporting, self reflective tool such as this adap-tation of the LoU index to inform progress of and decisions about their professional growth and development. It is crucial that respondents know (a) that responses are anonymous (on-line survey tools facilitate this, but other “blind” techniques work as well), and (b) that it is “OK” to be at whatever level one is at.
It is crucial to stress with respondents that this tool is used to inform programs and pro-cesses, not to evaluate people. Thus, non-users of particular technologies should be empowe-red to voice disinterest in, or lack of knowledge about a program by indicating a low level of use. Similarly, there should be no perceived “status” attached to users who report them-selves to be at refinement, integration or rene-wal levels of use. This reinforces the impor-tance of writing clear, articulated, appropriate, non-judgmental, and non-evaluative stems and responses. No less importantly, one could and should collect related “innovation
configu-rations” (HALL & HORD, 1987; NEWHOUSE, 2001)
such as teacher artifacts, login summaries, participation counts, attitude surveys, parti-cipant surveys, and classroom observations with which to corroborate and elucidate the LoU results.
It is critical throughout the process to main-tain complete transparency in the collection and dissemination of results. In the ideal ca-se, where a professional development program or innovation adoption is cooperatively and collaboratively initiated, planned, and imple-mented, the participants should want to res-pond as honestly as possible in order to accu-rately assess the program or innovation adop-tion over which they have ownership as mem-bers of a community of professional practice with a shared vision of professional growth and change (DUFOUR & EAKER, 1998).
It is gratifying to note results from the study indicate positive professional growth in res-pondents’ knowledge and utilization of, as well as confidence and competence with, emergent educational technologies. Where addressed by the course content, growth in knowledge of and confidence with emergent technologies, as defined by the criteria, is clearly indicated by the results of this level of use survey.
We are primarily interested in the process of the development of this adaptation of the “Level of Use of an Innovation” as a self-re-porting, self-reflective professional tool; and how the information derived from the results can be used to facilitate planning for and implementation of innovative changes within a professional community of learners. We are currently investigating possible applications of similar adaptations of the LoU index survey
within other communities of professional prac-tice, and ways in which adaptations for specific purposes can be derived from the original work of Hall, et al (1975) and Hord, et al (1987) and generalized to various communities of professional practice.
The specific adaptation of the “Level of Use of an Innovation” survey used in this study, including the focus on adoption of emergent educational technologies, is intended to be further adapted and applied to inform a colla-borative professional development program for university faculty members, with a revised catalogue of technological innovations appro-priate to the emergent technologies relevant to post-secondary instruction. An updated ca-talogue of technologies could include social networking, simulations and video gaming, video streaming, podcasting and vodcasting, and assistive technologies.
Additionally, we are investigating the de-sign of a considerably more generic version of the level of use index survey to address ques-tions regarding the current efficacy and po-tential new directions for professional develop-ment programs involving conservation and environmental educators across Canada. Gus-key (2005) identifies the importance of provi-ding data to “improve the quality of professio-nal learning programs and activities,” and “tracking the…effectiveness” of professional development programs. A critical challenge as we approach these tasks will be articulating concise descriptive statements reflecting the matrix of adoption of innovation (HALL, et al,
1975), while addressing the unique require-ments of each specific professional develop-ment initiative.
ADEY, P. (1995). The effects of a staff development
program: The relationship between the level of use of innovative science curriculum activities and student achievement. ERIC Research Report. ED 383567
BAILEY, D. & PALSHA, S. (1992). Qualities of the
stages of concern questionnaire and implica-tions for educational innovaimplica-tions. Journal of Educational Computing Research, 85(4), 226-232 DUFOUR, R., & EAKER, R. (1998). Professional
lear-ning communities at work: Best practices for enhancing student achievement. Bloomington, IN. National Educational Service
GERSHNER, V., SNIDER, S., & SHARLA, L. (2001).
Integrating the use of internet as an instructio-nal tool: Examining the process of change. Jour-nal of EducatioJour-nal Computing Research, (25(3), 283-300
GRISWOLD, P. (1993). Total quality schools
imple-mentation evaluation: A concerns-based approach. ERIC Research Report. ED 385007
GUSKEY, T. (2005). Taking a second look at
accountability. Journal of Staff Development, 26(1), 10-18
HALL, G. & HORD, S. (1987). Change in schools:
Facilitating the process. Albany, NY. State Uni-versity of New York
HALL, G., LOUCKS, S., RUTHERFORD, W. & NEW -LOVE, B. (1975). Levels of use of the innovation:
A framework for analyzing innovation adop-tion. Journal of Teacher Education, 26(1), 52-56 HORD, S., RUTHERFORD, W., HULING-AUSTIN, L. &
HALL, G. (1987). Taking charge of change.
Ale-xandria, VA. Association for Supervision and Curriculum Development
NATIONAL STAFF DEVELOPMENT COUNCIL. (2003).
Mo-ving NSDC’s staff development standards into prac-tice: Innovation configurations. Oxford, OH: Author NEUMAN, W. (1997). Social research methods:
Qualitative and quantitative approaches (3rd ed.).
Needhan Heights, MA: Allyn and Bacon NEWHOUSE, C. (2001). “Applying the
concerns-based adoption model to research on compu-ters in classrooms. Journal of Research on Com-puting in Education 33(5), 1-21
WENGER, E. (1998). Communities of practice:
Lear-ning, meaLear-ning, and identity. New York NY. Cam-bridge University Press