BJRS
RADIATION SCIENCES
07-03 (2019) 01-12ISSN: 2319-0612 Accepted: 2019-05-14
Influence of detectors efficiency normalization on small
animal PET image quality
Santana, M.G.C.
1,2; Souza, G.C.A.
1,2; Gontijo, R.M.G.
1,2;
Mamede, M.
2, Mendes, B.M.
1, Ferreira, A.V.
11Centro de Desenvolvimento de Tecnologia Nuclear (CDTN / CNEN) 31270-901 Belo Horizonte, MG, Brasil
2Universidade Federal de Minas Gerais (UFMG) Departamento de Anatomia e Imagem 30130-100 Belo Horizonte, MG, Brasil
ABSTRACT
A small animal positron emission tomograph (LabPET GE 4) image acquisition is done by 1536 independents channels. Differences in the rate counting of each channel must be corrected so as not compromise image quality. Equipment user manual recommends that normalization of the detectors efficiency be made as often as possible and always whenever there are hardware or software parameters changes - included, but not limited to channels parameters adjustments, electronic cards replacements, channels activation or inactivation or software update. This work evaluates the normalization effects on the image quality parameters. PET image acquisition and analysis were performed using recommended parameters by the NEMA NU 4-2008 standards. Image was reconstructed in different ways using different normalization files. The tests performed indicated that the image quality parameters do not vary significantly with different normalization data. Therefore, a high frequency
routine of normalizationsis not justified, suggesting a periodical frequency of one month for this procedure.
1. INTRODUCTION
The importance of small animal Positron Emission Tomography (PET) has increased during the last decades as a valuable tool for studying animal models of human diseases and to contribute in the development of new radiopharmaceuticals or in studies of new applications of traditional radiopharmaceuticals [1]. Because of widespread use and commercial availability of small animal PET scanners, the National Electrical Manufactures Association (NEMA) published its NU 4/2008 standards [2], a consistent and standardized methodology for measuring scanner performance parameters for small animal PET imaging.
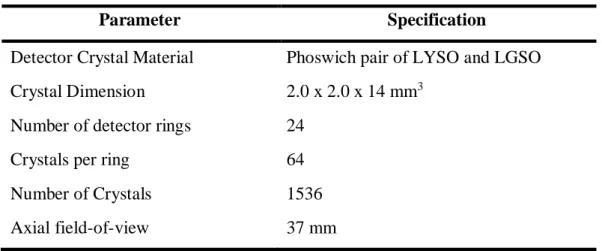
The TriumphTM platform is a small animal PET system dedicated for rodents imaging. The subsystem LabPET 4 consists of a stationary gantry with 1536 detectors. It employs an Avalanche Photo Diode (APD) detector ring incorporating an assembly of Lutetium yttrium oxyorthosilicate – Lu1.9Y0.1SiO5 (LYSO) and Lutetium gadolinium oxyorthosilicate – Lu0.4Gd1.6SiO5 (LGSO) scintillators optically coupled one after the other [3]. LabPET 4 images are acquired using a 250-650 keV energy window and 22 ns coincidence timing window. It provides axial field of view (FOV) of 3.7 cm and can operate in a dynamic or static mode. Coincident data are saved in list mode and can be sorted out as sinograms. Some important features are compiled in Table 1. More details about the LabPET 4 design and architecture are presented elsewhere [4, 5].
Table 1: Summary of the LabPET 4TM technical specifications.
Parameter Specification
Detector Crystal Material Phoswich pair of LYSO and LGSO
Crystal Dimension 2.0 x 2.0 x 14 mm3
Number of detector rings 24
Crystals per ring 64
Number of Crystals 1536
Because LabPET 4 images are acquired through 1536 different channels or, more precisely, 768 channel pairs, each one with its own counting efficiency, counting rate corrections for each channel pair are required to not compromise the uniformity of the raw data. The method used to correct this effect is termed normalization. In this method, all channel pairs are exposed uniformly to 68Ge source and normalization factors are calculated for each channel pair by dividing the average of counts of all channel pair by the individual detector pair count.
LabPET 4 user manual describes the normalization procedure, however it did not establish an ideal frequency to perform this procedure. It recommends that normalization of the detectors efficiency be made “as often as possible” and always whenever there are hardware or software parameters changes - included but not limited to routine adjustments to channels parameters, electronic cards replacements, channels activation or inactivation, software updates [6]. In laboratory practice, the normalization method demands a long counting time (about 6 hours) for statistical accuracy. The objective of this work is to evaluate the effect of normalization procedure frequency, and consequently normalization factors update frequency, on the PET images quality. Additionally, a frequency to perform normalization procedure is proposed to laboratorial practice.
2. MATERIALS AND METHODS
Experimental activities were conducted at the Image Molecular Laboratory (LIM) of the Nuclear Technology Development Center (CDTN/CNEN) in Belo Horizonte, Brazil.
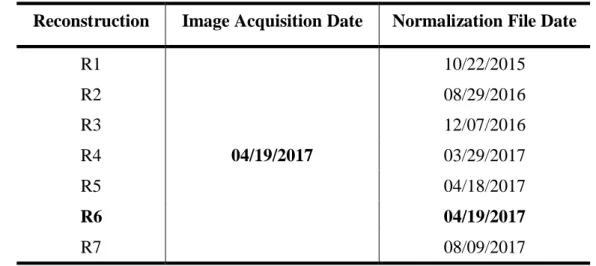
In order to evaluate the effect of normalization procedure frequency on PET images quality, a PET image was acquired and then it was reconstructed using different normalization files acquired between 2015 and 2017. All other parameters of image reconstruction were kept fixed: LabPET 1.12.1 software, MLEM-3D algorithm, 20 iterations, no high resolution mode, no attenuation or scatter corrections, no post-filtering. In the period between 2015 and 2017, besides several routine changes in the channels parameters, there was an interruption in the operation of the small-animal PET scanner for 3 months and a corrective maintenance with replacement of the control board in August 2016. Table 2 summarizes the image reconstructions carried out in this study.
Table 2: Image Reconstructions Summary.
Reconstruction Image Acquisition Date Normalization File Date
R1 04/19/2017 10/22/2015 R2 08/29/2016 R3 12/07/2016 R4 03/29/2017 R5 04/18/2017 R6 04/19/2017 R7 08/09/2017
For the study, a PET image of the image quality (IQ) phantom [2] were acquired. This phantom (Figure 1) is made up of polymethylmethacrylate (PMMA) with internal dimensions of 50 mm length and 30 mm diameter. It possess a main chamber that communicates with five different diameters auxiliary rods, all of which are expected to be filled with radiopharmaceutical water solution. Thus, activity concentration in any rod is the same that the one in main chamber. In addition, the IQ phantom posses two cold chambers - one of them is expected to be filled with air and the other one is expected to be filled with water, both no radioactive. Details of IQ phantom are presented at NEMA 4-2008 publication [2]. PET image acquisition were performed using recommended parameters [2] - radionuclide: 18F, activity: 3.7 MBq, PET scan duration: 20 min.
Figure 1: Image Quality Phantom. Right: Photo gallery of authors; Left: schematic representation
IQ phantom image acquisition and reconstruction were performed with the LabPET 1.12.1 software, provided by the small-animal PET scanner manufacturer. After reconstructions using different normalization files, all obtained IQ phantom images were quantitatively analyzed. Image quality tests recommended by the NEMA 4-2008 publication were performed, namely Uniformity, Spill-Over Ratio (SOR) and Recovery Coefficient (RC) [2]:
(i) The Uniformity test consists of to obtain mean, maximum, minimum and standard deviation of the activity concentration in the main chamber. To perform this test, a central cylindrical volume of interest (VOI) with 22.5 mm diameter and 10mm height shall be analyzed [2].
(ii) The ratios between the mean activity measured in each one of the five auxiliary rod and the mean activity measured in the main chamber provides the Image Recovery Coefficients. To perform this test, the 10mm length central region of each rod shall be average to obtain a single image in which the coordinates of the highest value pixel are determined. Then, for each rod, the mean activity concentration must be determined considering a 10mm axial line profile passing through the highest value pixel [2].
(iii) The ratio between the mean activity measured in a cold chamber (filled with air or water) and the mean activity measured in the main chamber provides the Spill-Over Ratio. To perform this test, a central cylindrical VOI (4 mm diameter, 7.5 mm heigh) shall be analyzed.
More details of the image analysis for image quality tests are provided in NEMA 4-2008 [2]. In this work, quantitative analysis were performed using PMOD® software, v3.7 [7]. Activity concentration in a specific VOI was achieved using PMOD® PBAS tool.
One-way ANOVA, followed by Dunnett’s t-test, was used to investigate statistically significant differences in uniformity, SOR-air, SOR-water and recovery coefficients. R6 reconstruction using the normalization data from the same day of the imaging acquiring was defined as the control group and compared with the other reconstructions. The significance level adopted was (ɑ = 0.01).
3. RESULTS AND DISCUSSION
Graphical results of the R1 and R6 reconstructions are presented in Figure 2 for qualitative comparison. The image reconstructed with the older normalization (R1) shows alternated lines of
low and high count rates. This pattern was not expected since the activity is homogeneously distributed in the phantom. This normalization artifact was not observed in R6 reconstruction (and neither in the other reconstructions - R2, R3, R4, R5 and R7).
Figure 2: R1 (left) and R6 (right) Image Reconstructions (top: colors scale).
In R1 image, the blue arrows indicate the low concentration stripes normalization artifact while magenta arrows indicates hot spots normalization artifacts.
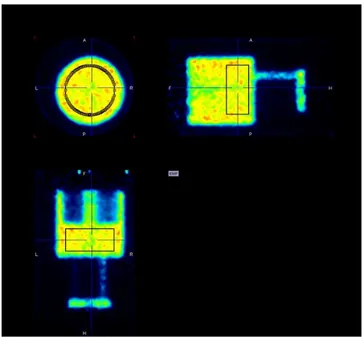
Figure 3 illustrates the method to determine uniformity. In this Figure, it is possible to see the cylindrical VOI (22.5 mm diameter and 10 mm height) positioned in the center of the main chamber to quantitative analysis. Mean, maximum, minimum and standard deviation of the activity concentration in this VOI is obtained using PMOD® PBAS tool.
Figure 3: Uniformity test: cylindrical VOI (22.5 mm diameter and 10 mm height) is positioned in
the center of the main chamber. Mean, maximum, minimum and standard deviation of the activity concentration in this VOI is obtained using PMOD® PBAS tool.
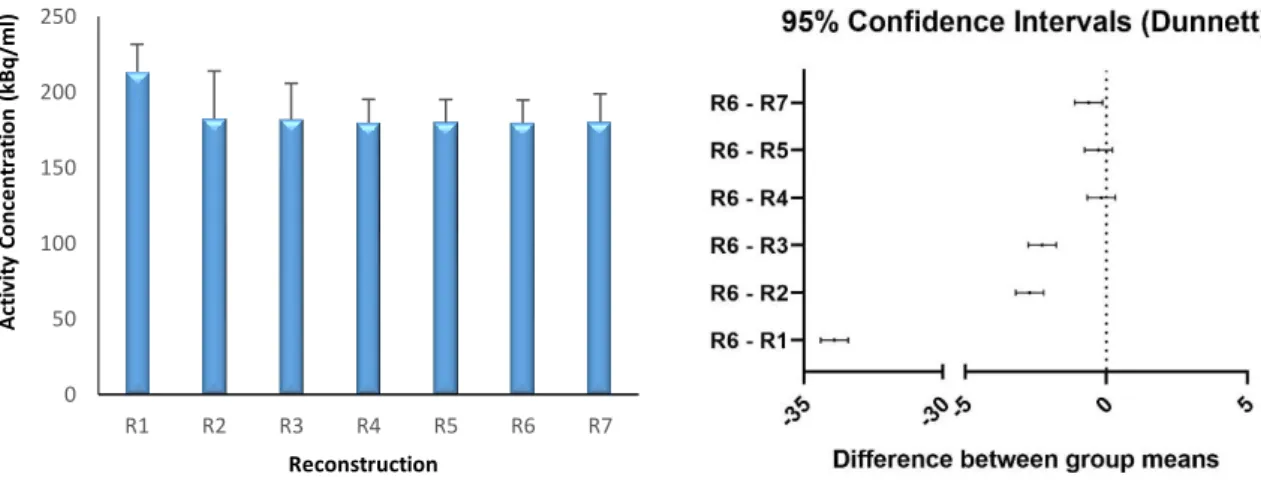
The uniformity test results for the reconstructions R1 to R7 of the IQ phantom are presented in Figure 4. The average activity concentration and its standard deviation are calculated over a relatively large VOI (a cylinder of 22.5 mm diameter and 10 mm height). The number of effective image voxels taken in to account in the calculations are about 33000. PMOD® software provides the mean, maximum, minimum and the standard deviation values. Therefore, the ANOVA and the post hoc test (Dunnett’s) analysis were done from the summary data. Results indicates that uniformity values obtained for the image reconstructions R4 and R5 were not statistically differents from R6 (control group). Differences between R6 uniformity values and the values obtained with R1, R2, R3 and R7 reconstructions were statistically significant. Since number of voxels sampled is very large (>33000), the confidence intervals are too narrow and the false positive (determine that the two values are different when they are not) probability is high. Thus, differences R6 versus R2, R3 and R7 reconstructions should be evaluate with care.
Figure 4: Uniformity test results for the image reconstructed with different normalization data.
Dunnett’s t-test was chose as the ANOVA post hoc test, with R6 as control group.
Spill-over ratios in the water and in the air for the reconstructions R1 to R7 are shown in Figure 5. As expected, the SOR in air chamber is higher than the SOR in water chamber, as the equipment do not perform attenuation/scatter corrections. In tests, the VOI consist of a cylinder of 4 mm diameter and 7.5 mm height positioned inside the water/air cold chamber, which involves about 600 effective image voxels. Thus, the statistical analyses were done from the summary data again.
The statistical analysis for the Spill-Over Ratio in water show the same pattern observed for uniformity (R6 = R4, R5 / R6 ≠ R1, R2, R3, R7). The SOR-air statistical analysis reveals that the values obtained for the image reconstructions R4, R5 and R7 were not statistically different from R6. Differences between R6 SOR-air values and the values obtained with R1, R2 and R3 reconstructions were statistically significant. Once again, the number of voxels sampled is very large (>600) and the false positive probability is high.
0 50 100 150 200 250 R1 R2 R3 R4 R5 R6 R7 Ac ti vi ty C o n ce n tr at io n ( kB q /m l) Reconstruction
Figure 5: Results for Spill-Over Ratio in water and in air tests for the image reconstructed with
different normalization data.
Dunnett’s t-test was chose as the ANOVA post hoc test, with R6 as control group.
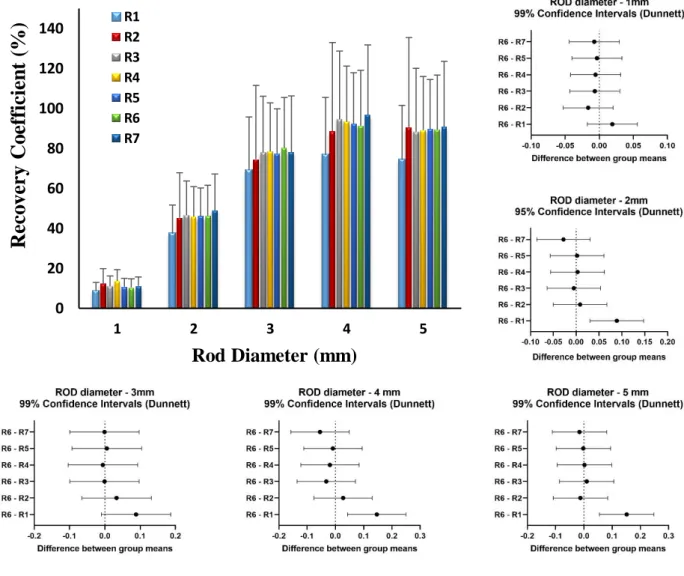
The Recovery Coefficients obtained for the rods of different diameters in the IQ phantom are presented in the Figure 6. Generally, regardless of the normalization data used for image reconstruction, the RC does not vary significantly. Only the R1 reconstruction, with very old normalization data (10/22/2015), presented significant differences from R6 for the 2, 4 and 5 mm rods. RCs obtained with the R1 reconstruction for 1 and 3 mm rods also tended to be smaller than R6, but the differences were not significant.
0 5 10 15 20 25 30 35 R1 R2 R3 R4 R5 R6 R7 SO R ( % ) Image Reconstruction Water Air
Figure 6: Recovery Coefficients test results for the different diameter rods of the phantom image.
The image was reconstructed with different normalization data.
Dunnett’s t-test was chose as the ANOVA post hoc test, with R6 as control group.
The analysis of the uniformity and SOR-water parameters demonstrated that the image acquired in 04/19/2017 could be reconstructed with normalization data from 03/29/2017 to 04/19/2017, i.e., over a period of approximately one month. SOR-air data suggests that this period could be longer, up to four months. On the other hand, analysis of the RC data shows that, with the exception of the R1 reconstruction, the image quality was stable regardless of the normalization chosen, contrary to what the user manual suggests. Even more significant events, such as power shortages, were not
0 20 40 60 80 100 120 140 1 2 3 4 5
Re
co
ve
ry
Co
ef
ficie
n
t
(%)
Rod Diameter (mm) R1 R2 R3 R4 R5 R6 R7reflected in the results presented. The disparity of the R1 test results can be explained by changes in the hardware of the PET scanner for small animals. As already mentioned, in 2016 there was an interruption in the operation of the equipment for 3 months. Corrective maintenance was completed in August 2016 with replacement of the equipment control board. The normalization used for the R1 test precedes this event. The other standardizations are after the replacement of the control board.
4. CONCLUSION
Acquisition of normalization files takes time and the normalization data file tend to be very large, especially when the source activity is low. The tests performed indicated that the image quality parameters do not vary significantly for the IQ phantom image reconstructed with different normalization data. That is, a high frequency normalization has shown little relevance over two years of equipment activity. Exception was observed for R1 data that was acquired before an equipment failure and its corrective maintenance, with replacement of control board.
Therefore, a high frequency routine of normalizations is not justified, suggesting a periodical frequency of one month for this procedure - since equipment is operating in normal conditions. Additionally, normalization must be done always whenever there are hardware or software parameters changes, as recommended by LabPET 4 user manual [6].
ACKNOWLEDGMENT
We thank the CDTN / CNEN, FAPEMIG and PIBIC / CNPq for the funding.
REFERÊNCIAS
[1] YAO R.; LECOMTE R.; CRAWFORD E. Small-Animal PET: What is it, and why do we need it? Journal of Nuclear Medicine Technology. 2011. v.. 40 nº3, p.157-165.
[2] NEMA - National Electrical Manufacturers Association. Performance Measurements of
SmallAnimal Positron Emission Tomographs. Rosslyn VA; 2008 Standards Publication NU
4-2008.
[3] GE Healthcare Technologies. Triumph Service Guide Technical Publication. Revision Draft 6, Copyright. Available at: <http://www.gehealthcare.com>. 2011.
[4] TRETRAULT M. A., et al. System architecture of the LabPET small animal PET scanner.
IEEE Transactions on Nuclear Science, 2008. v.55, p. 2546-2550.
[5] FONTAINE R., et al. The hardware and signal processing architecture of LabPETTM, a small animal APD-based digital PET scanner. IEEE Transactions on Nuclear Science, February 2009. v. 56, p. 3-9.
[6] Gamma Medica-Ideas, User Manual: Positron Emission Tomography (PET) Scanner Software -
Manual for Acquisition and Processing of PET Images from the LABPET System.
Software version: LABPET 1.12.0, (2010).