RADIATION SCIENCES
06-01 (2018) 01-11BJRS
Impact of the counts density of calibration image and the
image reconstruction parameters in
131I SPECT image
quantification
S. M. Carvalho
a; A. P. M. Costa
b; C. D. Ramos
b; S. Q. Brunetto
c; D. A. B. Bonifacio
aaInstituto de Radioproteção e Dosimetria, IRD/CNEN, Rio de Janeiro, RJ, Brasil b Serviço de Medicina Nuclear, SMN/HC-UNICAMP, Campinas, SP, Brasil c Centro de Engenharia Biomédica, CEB/UNICAMP, Campinas, SP, Brasil
ABSTRACT
Iodine-131 (131I) has been used for diagnosis and therapy in Nuclear Medicine Centers in Brazil for more than 50 years.
The present study aims to investigate the impact of the counts density and the reconstruction parameters in the calibration factor determination and in the image quantification, considering the reality of Brazilian dosimetry studies. For this task, images were quantified using calibration images with high and low counts density and reconstructed adopting two different parameters approaches, usually employed in patients images. SPECT quantification results presented in this work follow other previous 131I SPECT studies and suggest that, due to the long time interval between
the first e last images, as required by the Brazilian guideline, the image quantification accuracy can be improved if the counts density of calibration images is considered.
1.
INTRODUCTION
Iodine-131 (131I) has been used for diagnosis and therapy in Nuclear Medicine Centers in Brazil for more than 50 years. 131I emits beta particles with a mean energy of 606.3 keV (89.4%) and gamma radiation with energy of 364.5 keV (81.2%) with a half-life of 8,02 days [1]. The treatment of differentiated thyroid carcinoma (DTC) is usually surgical followed by an ablation therapy with 131I to destroy residual cervical thyroid tissues [2]. Therapy efficiency depends on the activity of administered radioiodine, remaining thyroid masses and 131I biodistribution [2].
In general, the use of the highest dose (optimal therapeutic dose) is recommended to destroy tumors without, however, increasing probability occurrence of side effects (radiological risk), represented by the absorbed doses in healthy radiosensitive organs near the tumor [3]. For the analysis of the treatment efficacy and the detection of metastases, a post-therapy image with the remaining 131I is
performed [3]. The best post-injection time for the imaging has not been defined yet. A previous study [5] carried out with 18 patients demonstrated a greater detection of lesions in tissues with imaging performed 7 days after the administration of ablative doses of 131I than in an image
performed after 2 days, due to the greater image contrast between lesions and background radiation in the body of patients [5]. Hung et at. (2009) pointed out, with a study of 239 patients, images performed with up to one week post-therapy are necessary and important for the detection of metastases in patients with DTC, which are more accurate than images performed later, e.g., 10 days post-therapy [6].
Images acquired post-therapy are very important to obtain the dosimetry parameters based on image quantification. It is the only method that determines residual activity in organs, through region of interest (ROI) or volume of interest (VOI) quantification [2,7]. For dosimetry purposes, at least 3 points of different acquisition times are necessary to account for the retention and elimination stages [8]. The time-integrated activity is calculated from these time-activity curves (TAC). Due to the high count rates until 24h after dose administration, to avoid dead time effects, it is common the earliest imaging to be performed 2 to 4 days post-injection [2].
In January 2014, the Brazilian Ministry of Health published the "Clinical Protocol and therapeutic guidelines in oncology" [9]. This document determines the administered activities according to the disease staging and suggests that the therapy have to be evaluated through an image acquired 7-10
days post-therapy. There is no suggestion about individualized dosimetry studies. However, there are internal dosimetry studies from public institutions in Brazil, using images acquired 1, 5 and 7 days post-therapy [10], and 1, 4 and 10 days post-therapy [3], hence including the image acquisition predicted by the Brazilian guideline. In both works, the authors mentioned the difficulty to acquire all images required on the dosimetry protocol, due to the social and economic situation of the patient [3,10].
The long interval between the first and last images is important to consider the rapid and the slow elimination of the radioactive material from the organs. However, especially in Brazilian dosimetry studies, these several days between the images acquisitions causes a large difference in the values of counts density and signal-to-noise ratio (SNR) of these acquisitions [3-4, 10]. Therefore, patient imaging requires different set of reconstruction parameters for each acquisition [13]. The most widely used iterative reconstruction algorithm in clinical routine is the ordered subset expectation maximization (OSEM) scheme [11]. The iterative reconstruction allows the modeling of various effects, such as photon scatter and attenuation. However, the amount of image noise tends to increase accordingly to the numbers of iterations, particularly in the poor counts density acquisitions [12]. Because of this, images with higher counts density can be reconstructed using more iterations and subsets, resulting in a faster and more accurate final image [12]. Recently, a study for optimization of OSEM reconstruction parameters in myocardial perfusion imaging [13] showed that the arrangement of four iterations with four subsets was the most frequently selected as it produces the best image quality, but images with less attenuation could be improved using 10 iterations and 16 subsets [13].
The MIRD pamphlet No. 24: Guidelines for quantitative 131I SPECT in Dosimetry Applications [2]
emphasizes the importance of using the same acquisition and reconstruction protocols for calibration and patient imaging. In this way, dosimetry studies protocols predict only one calibration image acquisition and posterior image reconstruction according to the parameters used in the patient images [2,3,7].
A previous study with 177Lu [14] performed calibration once a week with the same camera settings as in the patient studies to account for the counts density, but the influence of reconstruction parameters are not studied. The present study aims to investigate the impact of the counts density and the reconstruction parameters in the calibration factor determination, and consequently, in the
image quantification accuracy in dosimetry studies with a long interval between images acquisitions.
2.
MATERIALS AND METHODS
SPECT image calibration
Imaging was performed on Symbia SPECT T2 (Siemens, Germany) available in the nuclear medicine center of the Clinical Hospital at the University of Campinas (HC/Unicamp). The calibration factor, which converts counts into activity values in the VOI was determined using a cylindrical source of 15 mL containing 131I at an activity concentration of 361.13.6 kBq/mL and diluted in distilled water in order to avoid heterogeneity effects. The source was positioned at the center of an cylindrical phantom filled with water [2].
Acquisitions were performed with a high energy all-purpose (HEAP) collimator, 64 × 64 matrix size, 32 frames per head, non-circular orbit and unitary zoom. According to the patient images database of the HC/Unicamp, it was observed that images acquired 8-10 days after therapeutic dose administration, as required by the Brazilian guideline, have approximately 3,000 counts per frame. Based on this analysis, images were acquired with 15,000 counts per frame for High Counts Density (HCD) and 3,000 counts per frame for Low Counts Density (LCD).
The Ordered Subsets Expectation Maximization (OSEM) iterative algorithm, provided by Syngo workstation, was used for image reconstruction. For the calibration images, both HCD and LCD images were reconstructed using 4 subsets and 4 iterations followed by Gaussian filtering with 13.20 mm, and 16 subsets and 10 iterations followed by Gaussian filtering with 4.75 mm. Images were attenuated-corrected by attenuation map from the CT acquisition (SIEMENS, 120 kVp, 80 mAs), performed after SPECT acquisition [12]. Scatter correction was performed applying triple energy window (TEW) technique [15], the primary window was defined at 364 keV ± 10% and scatter windows at 320–326 keV and 401–409 keV [15].
The VOIs were defined using the semi-automatic method available on Syngo Workstation. The method employs a threshold based on the ratio percentage between the background counts and the counts in the cylindrical source. The calibration curve – sensitivity (in counts/s/volume/MBq) versus volume (in cm3) – was used to account for the partial volume effect. Data was obtained
applying different thresholds and were fitted by the equation , where S, given in counts.s-1.MBq-1.cm3, is the system sensitivity calculated as the ratio of the total counts per total image acquisition time and activity concentration Ac (in Mbq/cm3). The volume v ( in cm3) is
obtained for each applied threshold. The fit parameters are S0, S1 and k [16].
Reference phantom image acquisition and quantification
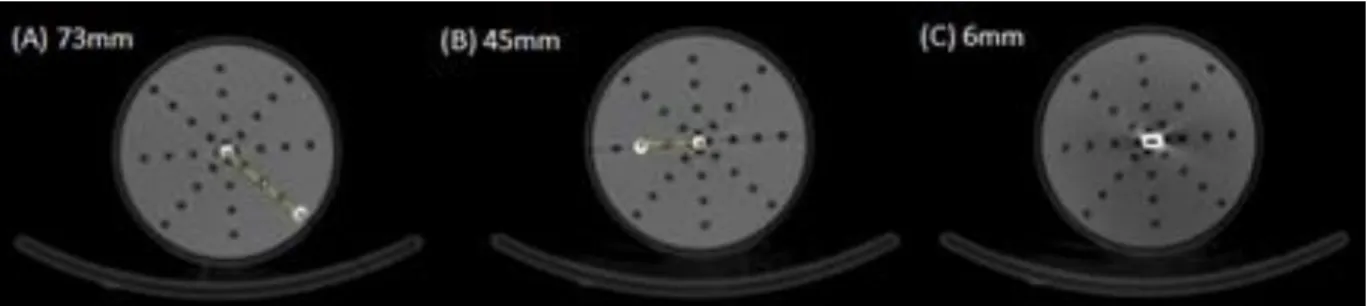
For the accuracy analysis of the image quantification, the cylindrical phantom was filled with water and the 131I reference source (15 mL) was positioned at three different distances to the center. (Figure 1). The HCD and LCD images were acquired using the same settings as used in the calibration images. Image reconstructions used the usual parameters for patients at UNICAMP clinical routine: HCD images were reconstructed using 16 subsets and 10 iterations followed by Gaussian filtering with 4.75 mm, and LCD images with 4 subsets and 4 iterations followed by Gaussian filtering with 13.2 mm. The calibration factors S0 were used for absolute quantification of the total reference activities.
Figure 1: References source positioned at (A) 73 mm, (B) 45 mm and (C) 6 mm from the center of the cylindrical phantom filled with water.
Uncertainty Analysis
Phantom volume uncertainties were considered negligible to compute the uncertainty of the system sensitivity, as the VOI of each acquisition was defined using the semi-automatic method [17]. Therefore, the uncertainty of the absolute activity , described in equation 1 and given by the sum
in quadrature of the standard uncertainties of calibration factor, , image acquisition time, , and counts, :
(Equation 1).
Where is equal to the half of the lowest value, is the square root of the counts in the VOI and is given by the standard deviation of the exponential fit.
3.
RESULTS AND DISCUSSION
Table 1 shows the calibration factors obtained for HCD and LCD images, reconstructed using different parameters. Results present significant differences in the calibration factors according to counts densitiy and the SNR. The deviation for HCD image is 7.2%, considering the use of 16 subsets and 10 iterations as standard, while the difference is only 1% for LCD image with 4 subsets and 4 iterations as standard. Reconstruction using only a few iterations is not recommended since an acceptable convergence for all points in the image is not guaranteed [12]. This justifies the large differences between calibration factors obtained with HCD images varying the reconstruction parameters.
Usually, in a dosimetry protocol, only one calibration image is acquired, which is reconstructed using the same parameter from patient images. Therefore, for the quantification of patients images acquired shortly after therapy and typically reconstructed with 16 subsets and 10 iterations, the relative difference between the calibration factors obtained with HCD and LCD images is 4.8%. While for the parameters used in patient images acquired after a long time post-therapy, i.e., 4 subsets and 4 iterations, the relative difference between the calibration factors obtained with HCD and LCD images is 11.4%. Results suggest that the accuracy of the quantification can be improved considering the SNR in the calibration image, which in SPECT dosimetry studies leads to the need to acquire more than only one calibration image and not only changing the parameters. For Hybrid Planar/SPECT approach [7], the accuracy of SPECT calibration could also be improved if one considers the counts density of the SPECT acquisition.
Table 1: Calibration factors S0 (count.s-1.Mbq-1.cm3) obtained for HCD and LCD images
calibrations reconstructed using different parameters
-Counts Density Reconstruction Parameters 1.MBq-1.cm3) HCD 16 subsets 10 iterations 850.6 ± 1.9 4 subsets 4 iterations 911.7 ± 10.0 LCD 16 subsets 10 iterations 809.7 ± 7.3 4 subsets 4 iterations 818.3 ± 8.8
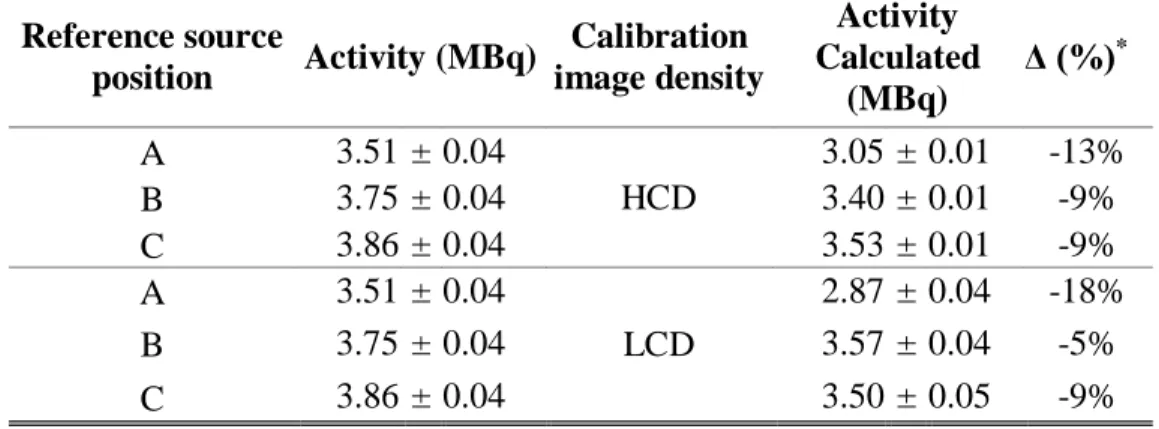
Each calibration factor was used to quantify the reference sources. For the HCD reference source images, the quantification accuracy ranges 9-13% using calibration factor obtained with HCD calibration image (Table 2), while using the calibration factor obtained with LCD calibration images, the maximum deviation increased by 18% (Table 2).
Table 2: Calculated activities (MBq) obtained from HCD reference sources images quantification
Both, calibration and reference images were reconstructed applying 16 subsets and 10 iterations, a 4.75 mm Gaussian filter. Reference source position Activity (MBq) Calibration image density Activity Calculated (MBq) Δ (%)* A 3.51 ± 0.04 HCD 3.05 ± 0.01 -13% B 3.75 ± 0.04 3.40 ± 0.01 -9% C 3.86 ± 0.04 3.53 ± 0.01 -9% A 3.51 ± 0.04 LCD 2.87 ± 0.04 -18% B 3.75 ± 0.04 3.57 ± 0.04 -5% C 3.86 ± 0.04 3.50 ± 0.05 -9%
*Relative error between the calculated and the reference activity.
For the LCD reference source images, the quantification accuracy ranges 2-17% using calibration factor obtained with an HCD calibration image (Table 3), while using the calibration factor obtained with an LCD calibration image, the maximum deviation decreased by 9% (Table 3).
Table 3: Calculated activities (MBq) obtained from LCD reference sources images quantification.
Both, calibration and reference images were reconstructed applying 4 subsets and 4 iterations, a 13.2 mm Gaussian filter. Reference source position Activity (MBq) Calibration image density Activity Calculated (MBq) Δ (%)* A 3.51 ± 0.04 HCD 2.93 ± 0.01 -17%
B 3.76 ± 0.04 3.32 ± 0.01 -12% C 3.87 ± 0.04 3.80 ± 0.01 -2% A 3.51 ± 0.04 LCD 3.26 ± 0.04 -7% B 3.76 ± 0.04 3.70 ± 0.04 -1% C 3.87 ± 0.04 4.24 ± 0.05 9%
*Relative error between the calculated and the reference activity.
Considering all situations, the different deviations between the three quantified sources suggest that the errors strongly depend on the positions of the sources. These results agree with a previous work performed for Shcherbinin et al. (2008), where reconstructed activities of the sources located peripherally (near the spine of the phantom) were 5–9% higher than those located at the center of the phantom [18]. It can be explained by the uncertainties of the CT-based attenuation maps due to the boundary between materials with different attenuation coefficients, such as water and phantom materials [15].
It is important to observe that for all cases the SPECT quantification results in an accuracy in accordance with other previous 131I SPECT studies: 10-15% for small objects with simulations [19], < 17% with phantoms measurements and simulations [20] and < 20% with phantoms measurements [21]. However, considering the best approach, HCD images quantified using calibrations factor obtained with HCD image and LCD images quantified using calibrations factor obtained with LCD image, the SPECT quantification accuracy was improved.
The best post-injection time to acquire images for dosimetry and post-therapy follow up is not so well defined. The end of the elimination phase can be estimated using other approaches [8], decreasing the time for the last image acquisition and the variations of counts density from images acquired. However, other aspects need to be considered, such as the social and economic reality of the patient, which is especially important in Brazil.
4.
CONCLUSION
Optimization of reconstruction parameters is very important to provide images with better quality for diagnostic and therapeutic purposes, not only for a qualitative analysis as previously showed [12], but also for a quantitative analysis as required in dosimetry studies.
This work presented SPECT quantification results with an accuracy in accordance with previous
131I SPECT studies and suggested that, due to the long time interval between the first e last images,
to account for the images as required by the Brazilian guideline, the image quantification accuracy can be improved if the counts density in calibration measurements is considered. Improved SPECT image quantification accuracy in dosimetry protocol results in a better analysis of treatment efficacy and decision-making.
This work has focused on 131I dosimetry studies and we recommend the evaluation of the proposed approach in others therapeutics procedures, since each dosimetry protocol consider the physical and biokinetics characteristics of the radioisotope in study.
5.
ACKNOWLEDGMENT
The authors thank the UNICAMP and CNEN for the support.
REFERENCES
1. OLEKSANDRA, G. IAEA Isotope Browser App Now Available in Multiple Languages,
Vienna, Austria, 2017. Available at: <https://www.iaea.org/newscenter/news/iaea-isotope-browser-app-now-available-in-multiple-languages>, Last accessed: 18 Dec. 2017.
2. DEWARAJA YK, LJUNGBERG M, GREEN AJ, ZANZONICO PB, FREY EC, SNMMI MIRD Committee, et al. MIRD pamphlet No. 24: Guidelines for quantitative 131I SPECT in dosimetry applications. J. Nucl. Med. v. 54, p. 2182–8, 2013.
3. CARVALHO S. Avaliação dos métodos de dosimetria para radioiodoterapia: monitoração de dose externa e quantificação absoluta de imagens cintilográficas. Instituto de Radioproteção e
Dosimetria; 2014.
4. LUSTER M, CLARKE SE, DIETLEIN M, LASSMANN M, LIND P, OYEN WJG, et al. Guidelines for radioiodine therapy of differentiated thyroid cancer. Eur. J. Nucl. Med. Mol.
Imaging. v. 35, p.1941–59, 2008.
5. KHFAN S, WAXMAN A, NAGARAJ N. Optimization of post ablative I-131 scintigraphy: Comparison of 2 day vs. 7 day post therapy study in patients with differentiated thyroid cancer (DTC). J. Nucl. Med. 1994.
6. HUNG B-T, HUANG S-H, HUANG Y-E, WANG P-W. Appropriate time for post-therapeutic I-131 whole body scan. Clin. Nucl. Med. v. 34, p.339–42, 2009
7. DEWARAJA YK, FREY EC, SGOUROS G, BRILL AB, ROBERSON P, ZANZONICO PB, et al. MIRD pamphlet No. 23: quantitative SPECT for patient-specific 3-dimensional dosimetry in internal radionuclide therapy. J. Nucl. Med. v. 53, p.1310–25, 2012.
8. SIEGEL J A, THOMAS SR, STUBBS JB, STABIN MG, HAYS MT, KORAL KF, et al. MIRD pamphlet no. 16: Techniques for quantitative radiopharmaceutical biodistribution data acquisition and analysis for use in human radiation dose estimates. J. Nucl. Med. v. 40, p.37S–61, 1999.
9. SAÚDE M DA. Protocolos clínicos e Diretrizes terapêuticas em oncologia. Brazil; 2014. Available from: http://conitec.gov.br/index.php/diretrizes-diagnosticas-e-terapeuticas-em-oncologia
10. BIANCARDI R. Protocolo para adaptação de técnicas de dosimetria interna para planejamento de doses individualizadas de 131i em pacientes pediátricos. Instituto de Radioproteção e
Dosimetria, 2011.
11. VAN GILS CAJ, BEIJST C, VAN ROOIJ R, DE JONG HWAM. Impact of reconstruction parameters on quantitative I-131 SPECT. Phys. Med. Biol. v. 61, p.5166–82, 2016.
12. GROOTJANS W, MEEUWIS APW, SLUMP CH, DE GEUS-OEI L-F, GOTTHARDT M, VISSER EP. Performance of 3DOSEM and MAP algorithms for reconstructing low count SPECT acquisitions. Z. Med. Phys.v. 26, p.311–22, 2015.
13. BARROS PP, METELLO LF, CAMOZZATO TSC, VIEIRA DMS. Optimization of OSEM parameters in MPI reconstruction Optimization of OSEM parameters in myocardial perfusion imaging reconstruction as a function of body mass index: a clinical approach. Radiol Bras. v. 48, p.;305–13, 2015.
14. SANDSTRÖM M, GARSKE U, GRANBERG D, SUNDIN A, LUNDQVIST H. Individualized dosimetry in patients undergoing therapy with (177)Lu-DOTA-D-Phe (1)-Tyr (3)-octreotate. Eur.
J. Nucl. Med. Mol. Imaging v. 37, p.212–25, 2010.
15. RITT P, VIJA H, HORNEGGER J, KUWERT T. Absolute quantification in SPECT. Eur. J.
16. GUERRIERO F, FERRARI M, BOTTA F. Kidney Dosimetry in 177 Lu and 90 Y Peptide Receptor Radionuclide Therapy: Influence of Image Timing, Time-Activity Integration Method, and Risk Factors. BioMed Res, 2013.
17. D’ARIENZO M, CAZZATO M, COZZELLA M.L, COX M. Gamma camera calibration and validation for quantitative SPECT imaging with 177Lu. Applied Radiation and Isotopes, v 112, p156-164, 2016.
18. SHCHERBININ S, CELLER A, BELHOCINE T, VANDERWERF R, DRIEDGER A. Accuracy of quantitative reconstructions in SPECT/CT imaging. Phys. Med. Biol. v. 53, p.4595– 604, 2008.
19. SONG N, DU Y, HE B, FREY EC. Development and evaluation of a model-based down scatter compensation method for quantitative I-131 SPECT. Med. Phys, v. 38, p.3193–204, 2011.
20. DEWARAJA YK, KORAL KF, FESSLER JA. Regularized reconstruction in quantitative SPECT using CT side information from hybrid imaging. Phys. Med. Biol, v.55, p.2523–39, 2010.
21. TROTTER DEG, JASZCZAK RJ, BOWSHER JE, AKABANI G, GREER KL. High-resolution absolute SPECT quantitation for I-131 distributions used in the treatment of lymphoma: a phantom study. IEEE Trans. Nucl. Sci. p. 707–14, 2001.