BJRS
RADIATION SCIENCES
Filtration influence in a constant potential X-ray
machine peak voltage measurements
L. R. Santos
a, b; V. Vivolo
a; M. V.T. Navarro
c, M. Xavier
a;
M. P. A. Potiens
aaInstituto de Pesquisas Energéticas e Nucleares, CEP 05508-000, São Paulo-SP,Brasil
b Instituto Federal de Educação, Ciência e Tecnologia de São Paulo, CEP 01109-010, SãoPaulo SP Brasil. c Instituto Federal de Educação, Ciência e Tecnologia da Bahia, CEP: 40.110-150, Salvador-BA, Brasil
ABSTRACT
This work shows the peak voltage measurements for several beam filtrations used in diagnostic radiology, using two types of non-invasive detectors; a voltage meter and a high-resolution spectrometer. The technique chosen for the voltage peak measurements with the spectrometer was the endpoint. The results were compared to the measured ones and showed good similarity to the nominal values. However the voltage meter detector used in this work pre-sented errors for heavier filtrations.
Keywords: peak voltage, practical peak voltage, spectrometry, endpoint, non-invasive
1. INTRODUCTION
The voltage measurement of an X-ray tube has undergone the influence of some different def-initions of the quantity to be measured. One of them is the peak kilovoltage; this can be deter-mined by spectrometry for the intersection of the linear high-energy part extrapolation with the energy axis and it represents the maximum voltage applied to the X-ray tube [1]. The other one
is the average peak voltage that is deduced by the average peak values from the voltage wave-form [2]. The practical peak voltage (PPV) is based on the concept that radiation generated by a high voltage of any waveform produces the same contrast as radiation generated by an equiva-lent constant potential. The constant potential producing the same contrast for a specified con-trast configuration and specified X-ray tube properties as the waveform under test is the PPV.3
Considering those definitions associated with the ISO [1] and IEC [3] recommendations, it can be noticed that the first suggests the use of peak voltage (kVp) and the second suggests the PPV as reference to determine the voltage. However, in the calibration laboratory that this study was developed cannot perform cannot perform voltage invasive measurements in a X-ray of potential constant, making it unfeasible to obtain the voltage waveform from the X-ray tube. This work aims to compare the responses of two non-invasive detectors: a commercial meter and a high-resolution semiconductor spectrometer using different filtrations and reproducing some radiation qualities for conventional diagnostic radiology and computerized tomography as recommended by IEC [3].
2. MATERIALS AND METHODS
This work was performed at the calibration laboratory of the Instituto de Pesquisas
Ener-géticas e Nucleares (LCI/IPEN). The laboratory has an X radiation system with a voltage range
from 1 to 160 kV, with a constant potential generator Agfa NDT Pantak/Seifert GmbH&Co. KG., Germany, model ISOVOLT 160 HS, connected to an X-ray tube Comet, model MRX 160/22 with a stationary anode (tungsten target) and a 1 mm beryllium window. The electric current can be chosen from an interval between 0.1 and 45 mA. With this configuration the sys-tem provides a maximum power of 3 kW.
The radiation qualities established at LCI/IPEN are for mammography, conventional diagnos-tic radiology, computerized tomography and radioprotection calibrations. This work used filtra-tions for the conventional diagnostic radiology and computerized tomography due to the Radcal
Accu kV® operational range (filtration of 1 to 23 mm for Aluminium and 0.03 to 0.685 mm Copper).
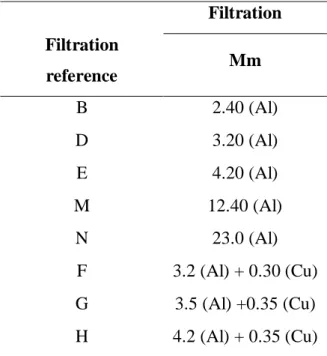
The nominal peak voltages were measured for each selected filtration in the values of 60 kVp, 80 kVp, 100 kVp, 120 kVp and 150 kVp, providing the cover of range used in diagnostic radiol-ogy. The used filtrations are shown on Table 1 (the purity level is 99.99% in all case).
Table 1: Filtrations used for nominal voltage measurements. Filtration Filtration reference Mm B 2.40 (Al) D 3.20 (Al) E 4.20 (Al) M 12.40 (Al) N 23.0 (Al) F 3.2 (Al) + 0.30 (Cu) G 3.5 (Al) +0.35 (Cu) H 4.2 (Al) + 0.35 (Cu)
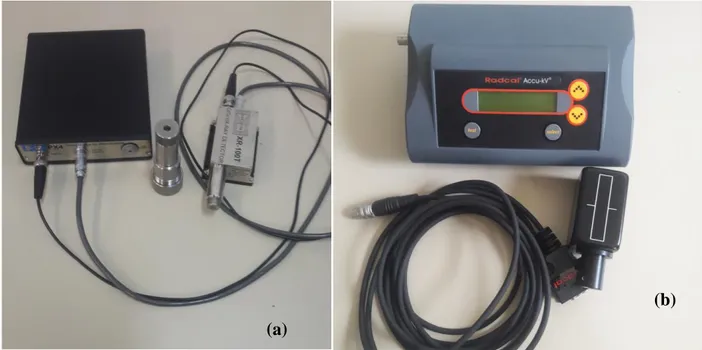
Two non-invasive detectors were used to measure the peak voltage. One is the Radcal Accu kV®, model 4085 and the other an Amptek® CdTe spectrometer, model XR-100T, connected to a multiproces-sor model PX4, also from Amptek®. The focus detector distance was 1 m for both detectors and the tube current ranged between 0.1 mA - 15 mA to achieve the readings without any additional filtration. For the spectrometer, lower currents were used in order to avoid saturation and pulses piling up, to the Accu kV meter it was used higher current to sensitize the detector.
The spectrometer was calibrated using gamma radiation sources of 241Am e 152Eu. The calibration curve was obtained through a linear fitting of χ2
red ≈ 1. The voltage meter was set to measure the
peak voltage, the quantity studied in this work and the filtration correction parameters were kept in the “Auto” mode. The detectors are presented in Figure 1.
Figure 1: Detectors used in this work: (a) XR-100T Amptek®, (b)Radcal Accu KV®
Source: LCI/IPEN collection
Five measurements for each filtration group and tube voltage for the Accu kV were per-formed. The average kVp values were obtained with their respective uncertainties according to JCGM [4]. The measurements performed with the spectrometer had at least 250 thousand counts on its spectrum so that a good statistical significance could be obtained, determining the end-point, according to the methodology established by Potiens and Caldas [5].
3. RESULTS AND DISCUSSIONS
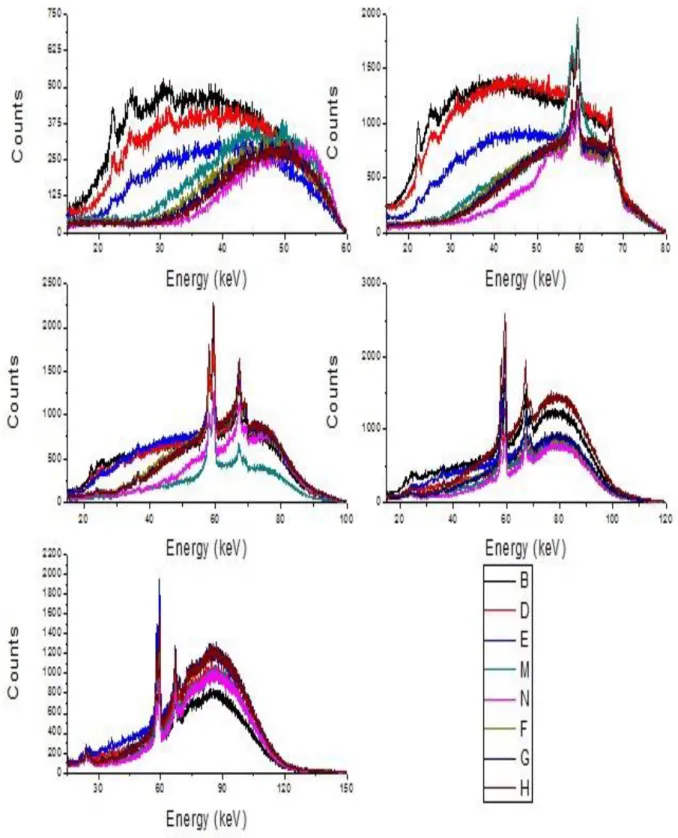
Considering that the spectrometry provides a reliable result, based on the previous calibration, the gross spectrum of each filtration set with the tube voltage was firstly obtained. These spectra are presented in Figure 2.
The spectrometry values obtained through the endpoint analysis and the ones provided by the Radcal, Accu kV® are presented on Tables 2 and 3 with their uncertainties.
(a)
Table 2: Peak voltage obtained for the spectrometry (endpoint) with the expanded
uncer-tainty for k=2, equal to ± 0.08 %.
Setting Peak voltage Filtration reference 60 kVp 80 kVp 100 kVp 120 kVp 150 kVp B 59.95 80.15 99.93 119.87 149.95 D 59.95 80.24 100.06 119.96 149.95 E 60.03 80.11 99.89 120.01 150.04 M 60.12 80.02 99.93 120.01 149.87 N 59.99 80.07 100.06 120.05 150.08 F 59.94 79.94 99.97 120.05 149.95 G 59.99 80.11 99.93 120.09 150.04 H 60.12 80.02 100.02 120.96 149.95
The uncertainty values obtained for the spectrometry had a higher influence on the linear ad-justments parameters, which made them have the same value for all peak voltages obtained.
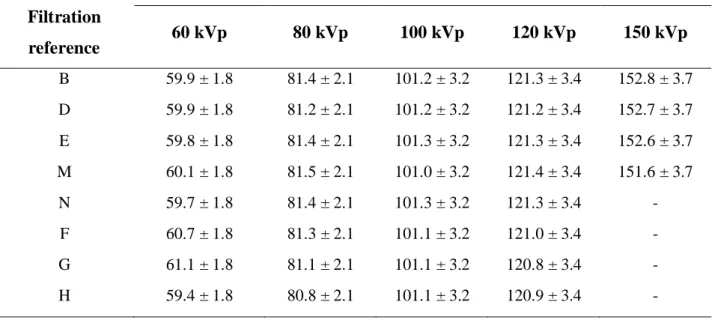
Table 3: Peak voltage values obtained with Radcal Accu kV®, with the expanded
uncer-tainty, for k=2.
Setting Peak voltage Filtration reference 60 kVp 80 kVp 100 kVp 120 kVp 150 kVp B 59.9 ± 1.8 81.4 ± 2.1 101.2 ± 3.2 121.3 ± 3.4 152.8 ± 3.7 D 59.9 ± 1.8 81.2 ± 2.1 101.2 ± 3.2 121.2 ± 3.4 152.7 ± 3.7 E 59.8 ± 1.8 81.4 ± 2.1 101.3 ± 3.2 121.3 ± 3.4 152.6 ± 3.7 M 60.1 ± 1.8 81.5 ± 2.1 101.0 ± 3.2 121.4 ± 3.4 151.6 ± 3.7 N 59.7 ± 1.8 81.4 ± 2.1 101.3 ± 3.2 121.3 ± 3.4 - F 60.7 ± 1.8 81.3 ± 2.1 101.1 ± 3.2 121.0 ± 3.4 - G 61.1 ± 1.8 81.1 ± 2.1 101.1 ± 3.2 120.8 ± 3.4 - H 59.4 ± 1.8 80.8 ± 2.1 101.1 ± 3.2 120.9 ± 3.4 -
The Radcal Accu kV® did not present the peak voltage response for heavier filtrations to volt-age of 150 kV, although there is no restriction for this operational range in the equipment’s man-ual. Several attempts were made to obtain the peak kilovoltage values for these measurement configurations, but were not successful.
The results present differences between 0.1 and 1.88 % with nominal values for both detectors but the Accu kV presented a non-expected limitation for the “N” filtration that has 23 mmAl, in the correction range for the equipment filtration. Even so, the equivalent Al filtration for F, G and H is smaller than the maximum specified for the Accu kV in Auto mode.
The endpoint method demonstrated to be very efficient for the high-resolution detector and it provided small uncertainties. The fact that the detector is calibrated with gamma radiation sources makes it interesting for quality control and acceptance tests of the X-ray equipment be-cause the energies of the gamma decay are very well known.
Comparing the results with the nominal values it can be noticed that the range values provided by the Accu kV meter extrapolate 1.5% variation, the recommended by the IEC [3] due to the expanded uncertainties. The relative error for the spectrometry did not exceed 1%.
However, it is important to note that the tests were carried out on a constant potential equip-ment with several filtrations, reaching very hard beams, a situation totally atypical for radiodiag-nostic services.
Spectrometry is a very precise and reliable tool, but if adopted as a referral, it will require the service provider to purchase radioactive sources, making the use unfeasible for the reality of some Brazilian regions. However, for a calibration laboratory the use of spectrometry to measure the peak voltage provides traceability and decreases the laboratory uncertainty. It can also enable the calibration of detectors for this quantity.
4. CONCLUSION
For a calibration laboratory, the use of the spectrometry endpoint is recommended because it shows low relative errors and uncertainties. This situation cannot be considered unfeasible for
commercial kV detectors even with a strong filtration dependence. It should be inadvisable for some tomography beams that user Copper as a filter. The values obtained for both detectors are reproducible and had good accuracy.
This work suggests the investigation of what type of correction is used for kVp filtrations by the kilovoltage meters provided for clinical use and that can allow the use of more filtered beams.
5. Acknowledgments
The authors acknowledge Conselho Nacional de Desenvolvimento Científico e Tecnológico (CNPq), Coordenação de Aperfeiçoamento de Pessoal de Nível Superior (CAPES), Ministério da Ciência e Tecnologia (MCT, Projeto: Instituto Nacional de Ciência e Tecnologia (INCT) Metrologia das Radiações na Medicina), Brasil., ao Instituto Federal de Educação, Ciência e Tecnologia de São Paulo (IFSP) and Instituto Federal de Educação, Ciência e Tecnologia da Bahia (IFBA), for the partial financial and structural support of this work.
REFERENCES
1 - ISO – International Organization for Standardization. X and gamma reference radiations
for calibrating dosemeters and doserate meters and for determining their response as a function of photon energy – Part 1: radiation characteristics and production methods: ISO 4037-1, Geneve: ISO, 1996.
2 - HOURDAKIS, C.J. Determination of the diagnostic X-ray tube practical peak voltage (PPV) from average or average peak voltage measurement. Phys. Med. Biol. v. 56, p. 2199–2217, 2011.
3 - IEC - International Electrotechnical Commission. Medical diagnostic X-ray equipment—
Radiation conditions for use in the determination of characteristics: IEC 61267, Geneve:
IEC, 2005.
4 - JCGM – JOINT COMMITTEE FOR GUIDES IN METROLOGY. Evaluation of
measure-ment data – Guide to the expression of uncertainty in measuremeasure-ment. Sévres, 2008: JCGM,
2008
5 - POTIENS, M. P. A.; CALDAS, L. V. E. . Calibration of kVp meters used in quality control tests in diagnostic radiology by spectrometry. Radiation Protection Dosimetry, Inglaterra, v. 98, n.3, p. 343-346, 2002.