INTRODUCTION
It is known that the elegant blue-green color of the celadon glaze results mainly from the deoxidizing thermal treatment of its iron oxides at high-temperature of about 1200 to 1250 °C.Larid (1918) [1] and Hunghan (1950) [2] reported for the Chinese celadons that the blue-green color of the celadon glazes is induced by chemical reaction from Fe2O3 to FeO in the celadon glazes under the deoxidizing thermal treatment. The celadon glaze changes gradually its color from yellow-brown to black color, as increasing the iron oxides under the deoxidizing thermal treatment [3]. Recently, we had been studying the glaze-color of the
HIZEN celadons, called “Seiji”, which were produced at Arita (north part in Kyushu island) in 1630’s to 1790’s (Edo period, Japan) [4-9], by means of the X-ray absorption spectra (XAS) near the Fe-K edge by using synchrotron radiation and the Mössbauer spectrum, in addition to the X-ray diffraction [10, 11].The results suggested that the glaze-colors of the HIZEN celadons depend on the material properties of the used raw ceramics and the other transition-metal ions Cr, Cu, Zn of very small amounts, in addition to Fe2O3 of small amounts. And also, it was found that the celadon glaze includes microscopically the ine iron oxides of Fe2O3, but not FeO, under the deoxidizing thermal treatment of high-temperature, even if the celadon glaze is
Correlation between the green-like coloration and the structural and
electronic properties of celadon glazes (I)
(Correlação entre a coloração esverdeada e as propriedades estruturais e
eletrônicas de esmaltes celadon (I))
M. Hidaka1, K. Takeuchi2, R. P. Wijesundera1,5, L. S. R. Kumara1, M. Watanabe3,
Jae-Young Choi4, Nark Eon Sung4
1Department of Physics, Graduate School of Science, Kyushu University, Fukuoka 812-8581, Japan 2Ceramic Research Center of Nagasaki, Nagasaki, 859-3726, Japan
3Center of Advanced Instrumental Analysis, Kyushu University, Fukuoka 819-0395, Japan 4Beamline Department, Pohang Accelerator Laboratory, Pohang University of Science and Technology,
San31, Hyoja-doing, Pohang, 790-784, Korea
5Department of Physics, University of Kelaniya, Kelaniya, Sri Lanka
hidaka@phys.kyushu-u.ac.jp
Abstract
Celadon glazes have been investigated by means of ordinary X-ray luorescence analysis, and X-ray diffraction and X-ray absorption spectra using synchrotron radiation. The tentative glazes are prepared by mixing raw celadon materials of Masuda feldspar, limestone, quartz, and extra-added Fe2O3 of about 1wt% at thermal treatment till about 1300 °C. It is found that the glaze-colors strongly depend on the Fe2O3 amount and the high-temperature treatment under oxidizing and deoxidizing in the used kiln. Especially, the characteristic color of blue-green, white-green-brown, and white-blue-green result from complex hybridized 3d5L and 3d6L bands. The 3d6L hybridization is induced by an electronic exchange interaction between an empty 3d6 orbital of Fe ions and an occupied 2p orbital of surrounding O ions in the (SiO2–Al2O3–CaO) basic complex ceramics of glass-state under the deoxidizing thermal treatment.
Keywords: glass ceramics, color, traditional ceramics, X-ray methods.
Resumo
Esmaltes celadon foram investigados por meio de análise de luorescência de raios X, e difração de raios X e espectros de absorção de raios X usando radiação síncrotron. Os esmaltes foram preparados por mistura de matérias-primas de celadon de feldspato
Masuda, calcita, quartzo e 1 peso% a mais de Fe2O3 com tratamento térmico até 1300 °C. Foi veriicado que as cores dos esmaltes
dependem fortemente do teor de Fe2O3 e do tratamento térmico a alta temperatura sob atmosfera oxidante e desoxidante. As cores
características verde azulada, marron esverdeada esbranquecida resultam das bandas de hibridização complexa 3d5L and 3d6L.
A hibridização 3d6L é induzida por interação de troca eletrônica entre o orbital vazio 3d6 e íons Fe e um orbital 2p ocupado com
íons oxigênio vizinhos nas cerâmicas complexas básicas (SiO2–Al2O3–CaO) no estado vítreo sob tratamento térmico desoxidante.
macroscopically in glass-state of short-range order. Thus, we are interested in the correlation between the glaze-color and the structural and electronic band properties for the celadon glaze. In order to reduce the intrinsic parameters related to the glaze-color, we tentatively made some celadon-glazes under the oxidizing and deoxidizing thermal treatment. In the present paper, we report the structural and electronic properties of the tentative celadon glazes, by means of the X-ray diffraction and the X-ray absorption spectra using synchrotron radiation, in addition to the ordinary X-ray luorescence analysis.
MATERIALS AND METHODS
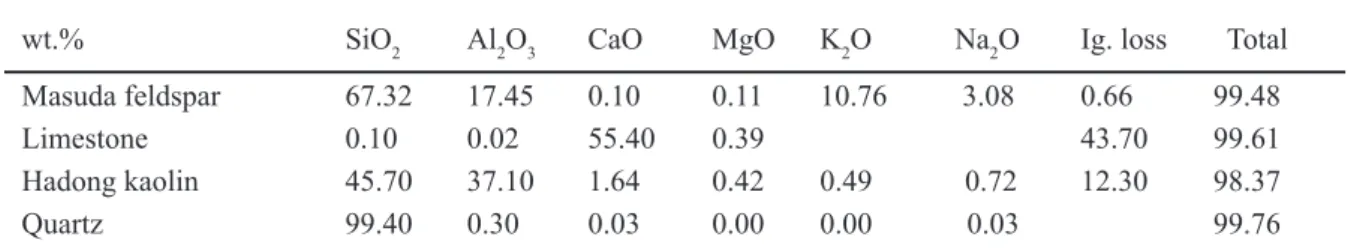
Four kind of tentative celadon glazes (A, B, C, D) were made by mixing raw celadon-materials of Masuda feldspar (46 wt.%), limestone (14 wt.%), Hadong kaolin (10 wt.%), and quartz (30 wt.%) to get an ideal oxide composition of celadon glaze. The oxide composition of each raw celadon material was analyzed by an ordinary X-ray luorescence analyzer (Philips MagiX Pro/PW2440/00) in Table I, in which the notation “Ig. Loss” means an incandescent reducing weight. The calculated ratio of basic composed oxides gives 57.2, 27.2, 9.0, 4.4, and 2.1 wt.% to SiO2, Al2O3, CaO, K2O, and Na2O, respectively. The extra-added Fe2O3 (1 wt.%) were added to only two specimens of A and C, but not to B and D. The tentative celadon glazes were heated up to about 1300 ºC. However, the specimens of A and B were oxidized till about 900 ºC and deoxidized with CO from 900 to 1300 ºC, while the ones of C and D were continuously oxidized till 1300 ºC.
In order to study the oxide components of the tentative celadon glazes, we used an energy dispersive-type X-ray luorescence analyzer (Simazu-EDX 800) having lower current, of which power was Rh-15 kV, 230 to 500 μA in the Na−Sc region and Rh-50 kV, 25 to 70 μA in the Ti−U region. The exposed area of the specimens was 10 mm in diameter. We used a high resolution 4-circle X-ray diffractometer using synchrotron radiation at the Pohang Light Source (2.5 GeV) of the Pohang Accelerator Laboratory (Korea). The raw celadon ceramics, called Yuuyaku, and the tentative celadon glazes were set on the specimen stage of the 4-circle X-ray diffractometer and were irradiated with the incident monochromatic X-ray beams of about 0.1 mm in diameter,
and its X-ray photon energy was about 8.046 keV (1.541 Ǻ). The distance between the X-ray detector and the specimen-surface was about 2 m. The used X-ray diffraction method was a 2θ scan with each stepping angle of D2θ = 0.03 degrees
in the region of 2θ = 10.00 to 70.00 degrees, where the specimen was always ixed at an incident angle θs of about 5 degrees to the incident X-ray beams during measurements to exposure a wider area of the specimen surface.
We also carried out measurements of a X-ray absorption spectrum (XAS) in the wider energy region from about 5900 to 9070 eV by using monochromatic incident X-ray beams of synchrotron radiations, in order to detect the transition metal ions of (Cr, Mn, Co, Ni, Cu) in the glassy celadon glazes. We measured the XAS of the tentative celadon glazes by using synchrotron radiation at the Pohang Light Source. A double crystal monochrometor of Si (111) gave a relative energy resolution ΔE to be less than about 0.2 eV at the respective monochromatic incident X-ray beams. The incident X-ray photons (Io) were detected with an ionic chamber set before the specimens of the broken pieces in Fig.1, while the X-ray luorescence photons (I) emitted from the front surface of the specimens were simultaneously detected with an X-ray luorescence detector. The lat-like surface was always set with about 45° to the incident X-ray beam, of which the size was about 1 to 3 mm in horizontal and 1mm in vertical on the specimen surface to the electron orbital of the accelerator.
RESULTS
The tentative celadon glazes (Seiji A, B, C, D) are shown in Fig. 1.
wt.% SiO2 Al2O3 CaO MgO K2O Na2O Ig. loss Total
Masuda feldspar 67.32 17.45 0.10 0.11 10.76 3.08 0.66 99.48
Limestone 0.10 0.02 55.40 0.39 43.70 99.61
Hadong kaolin 45.70 37.10 1.64 0.42 0.49 0.72 12.30 98.37
Quartz 99.40 0.30 0.03 0.00 0.00 0.03 99.76
Table I - Oxide composition of the mixing raw celadon-materials to prepare the tentative celadon glazes of A, B, C and D.
[Tabela I - Composição de óxidos da mistura de materiais de celadon para preparar os esmaltes de celadon A, B, C e D.]
Figure 1: The tentative celadon glazes taken at the high-temperature treatment till about 1300 ºC under the CO-deoxidizing (Seiji A, B) and the oxidation (Seiji C, D).
The extra-added Fe2O3 (1 wt.%) was added to A and C, but not to B and D. We conirmed that the CO-deoxidizing thermal treatment of A and B from 900 to 1300 ºC induced the elegant glaze color of blue-green and white-blue-green, respectively. However, B does not include the extra-added Fe2O3. On the other hand, C and D prepared under the oxidizing thermal treatment show the brown and white-brown color, respectively. The facts imply that the natural Fe2O3 of very small amount was included in the used raw ceramic materials. In Table II, the main oxide composition of the present celadon glazes (Seiji A, B, C, D) are measured by means of the ordinary X-ray luorescence analysis. Thus, we conirmed the natural Fe2O3 included in the used raw ceramic materials. And also, the thermal treatment at high
temperature of about 1300 ºC changed the relative wt% of the oxide composition in the celadon glazes by melting, decomposition, and/or the structural phase transition of the raw celadon materials.
In order to study the thermal effect of the celadon glazes, we carried out the X-ray diffraction of the raw celadon glazes including the extra-added Fe2O3 (1 wt.%) at the respective heat-temperature by using synchrotron radiation. Figs. 2 a, b, c and d show the diffraction patterns taken at room temperature (RT), 600, 900, and 1000 ºC, respectively. However, all of the patterns were measured at RT, after quickly cooling from high-temperature to RT. It is found that, at about 1000 ºC, the raw celadon glaze shows almost the complex relections due to the structures of feldspar and quartz, in addition to the very
Figure 2: X-ray diffraction patterns of the raw celadon glaze, depending on temperature of thermal treatment; (a) room temperature, (b) 600 ºC, (c) 900 ºC, and (d) 1000 ºC.
[Figura 2: Difratogramas de raios X de esmaltes de celadon em função da temperatura de tratamento térmico; (a) temperatura ambiente, (b) 600 ºC, (c) 900 ºC, e (d) 1000 ºC. ]
Table II - Oxide composition in the tentative celadon glazes, Seiji A, B, C and D.
[Tabela II - Composição de óxidos nos esmaltes celadon Seiji A, B, C and D.]
0.04
0.04
0.04
0.04 0.03
0.03
0.03
0.03 0.02
0.02
0.02
0.02 0.01
0.01
0.01
0.01 0.00
0.00
0.00
0.00 10
10
2q (degree)
2q (degree)
2q (degree)
2q (degree)
Id
/IO
Id
/IO
Id
/IO
Id
/IO
10
10 20
20
20
20 15
15
15
15 25
25
25
25 30
30
30
30 Glaze color (wt%) SiO2 Al2O3 CaO K2O Na2O Fe2O3
A blue-green 71.0 14.4 7.90 3.87 1.55 1.20
B white-blue-green 72.4 14.4 7.85 3.47 1.70 0.19
C brown 71.6 13.6 8.41 3.47 1.58 1.37
weak relections of the extra Fe2O3 structure (Fig. 2d, and is perfectly melted at about 1150 ºC. Thus, it is deduced that the raw celadon glaze is in glass-state above 1150 ºC.
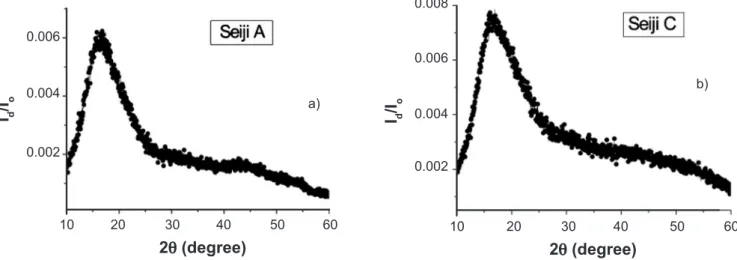
In Fig. 3 the hallo-like diffraction patterns suggest that the celadon glazes of Seiji A and C have an ideal short-range order
for the compositing ceramic materials to be microscopically in oxide-state and/or ion-one, as like those of Seiji B and D. Thus, Table II represents the oxide composition, if the celadon glazes have macroscopically a long-range order for the oxides, SiO2, Al2O3, CaO, K2O, Fe2O3 etc. Because the ordinal X-ray
Figure 3: X-ray diffraction patterns of the celadon glazes, Seiji A and C, taken by the thermal treatment till about 1300 ºC.
[Figura 3: Difratogramas de raios X dos esmaltes celadon, Seiji A e C, obtidos após tratamento térmico até 1300 ºC.]
Figure 4: X-ray absorption spectra near the K-edge of Fe ions in the celadon glazes, Seiji A, B, C, and D.
[Figura 4: Espectros de absorção de raios X próximo da banda K de íons Fe nos esmaltes celadon, Seiji A, B, C, e D.]
0.006
0.004
0.002
10 20 30 40 50 60
2q (degree)
I d
/I o a)
0.006 0.008
0.004
0.002
10 20 30 40 50 60
2q (degree)
I d
/I o
b)
4 0.08
0.06
0.06 0.04
0.04 0.02
0.00
0.02
7050 7050
7050 7050
E (eV) E (eV)
E (eV) E (eV)
7100 7100
7100 7100
7150 7150
7150 7150
7200 7200
7200 7200 3
3 2
2 1
1 0
0
I/IO
I/IO
I/IO
luorescence analyzer measures only the intensity of the X-ray luorescence emitted from the compositing ions in the celadon glaze and approximately estimates the oxide composition. However, the estimation slightly has an ambiguity to the glass-state of short-range order.
Fig. 4 shows the X-ray absorption spectrum (XAS) near the K-edge of Fe ions, called XANES of Fe-K edge, in the celadon glazes, Seiji A, B, C, and D. The ordinate is an intensity ratio between the incident X–ray photons (Io) and the X–ray luorescence photons (I) emitted from the front surface of the specimen to the respective photon energy E (eV). Since Seiji A and C include the extra-added Fe2O3 of about 1 wt.%, the XAS indicates the large absorption amplitude in contrast to Seiji B and D. We will describe the detail of the present Fe-K XAS in our second paper [12]. Usually, the raw celadon materials also include transition-metal ions of Mn, Cr, Cu of very small amount in the glaze. The contained other transition-metal ions also affect sensitively the color and brightness of the celadon glaze, as like Fe [10, 11]. However, it is not easy to detect the X-ray luorescence of very weak emitted from the other transition-metal ions by using the ordinary X-ray luorescence analyzer, as Tables I and II.
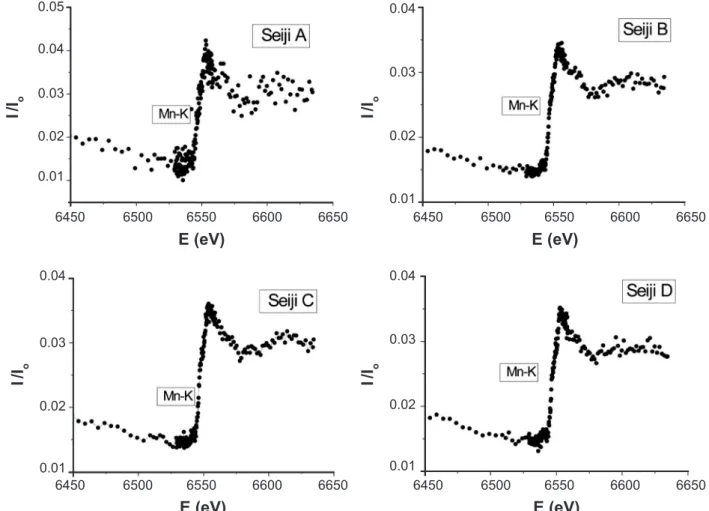
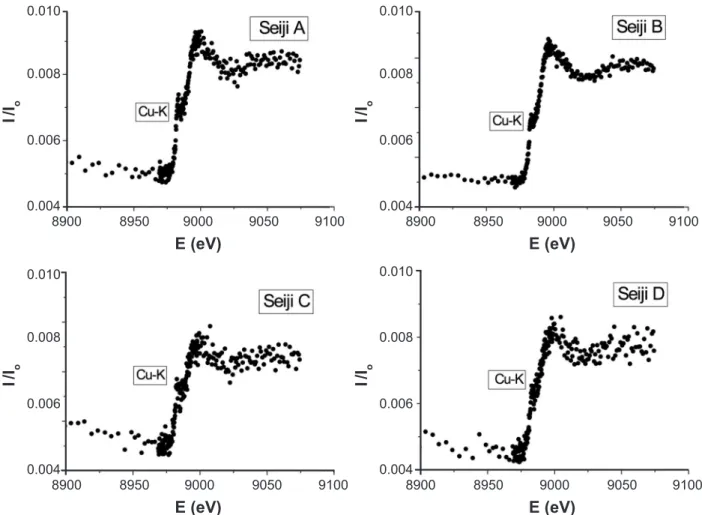
Figs. 5 and 6 show the XANES of Mn-K and Cu-K edges for the present celadon glazes, respectively. Although the X-ray luorescence of Mn and Cu ions could not be measured in Table II, we conirmed that there are Mn and Cu ions in the present celadon glazes. The law absorption amplitudes suggest that the containing amount is very small. We also observed the XANES of Cr-K edge of very law amplitude around 6.00 eV. However, we did not observe the XANES of Co-K and Ni-K edges, which may appear around 7.71 and 8.33 eV, respectively. Table III shows the relative amplitudes of the observed XANES near the K-edges, which were taken by the count ratio between the pre-edge background and the maximum peak of XANES, called a main XANES. The results suggest that the color and brightness of the present celadon glazes does not depend on the contained other transition-metal ions of Mn, Cr, Cu ions of very small amount, and strongly depends on Fe ions of small amount and the high-temperature thermal treatment of the oxidizing and the CO-deoxidizing from 900 to 1300 ºC.
The pre-edge XANES gives information for the unoccupied electronic bands in a top region of the valence band just below an electronic Fermi level (EF), while the main XANES gives empty electronic bands in a bottom
Figure 5: X-ray absorption spectra near the K-edge of Mn ions in the celadon glazes, Seiji A, B, C, and D.
[Figura 5: Espectros de absorção de raios X próximo da banda K de íons Mn nos esmaltes celadon, Seiji A, B, C, e D.]
0.05 0.04
0.04 0.04
0.03
0.02
0.02 0.02
0.04
0.03
0.03 0.03
0.02
0.01
0.01 0.01
0.01
6450
6450
6450
6450 6550
6550
6550
6550
E (eV)
E (eV)
E (eV)
E (eV)
I
/Io
I
/Io
I
/Io
I
/I o
6500
6500
6500
6500 6600
6600
6600
6600 6650
6650
6650
region of the conduction band just above EF. Both XANES spectra sensitively depend on the crystallographic structure and the electronic band-state near EF of condensed materials. For comparison, we measured the XAS around Fe K-edge of the red-colored overglaze of the Kakiemon-style porcelain, which was produced at Arita in 1710’s−1740’s, and the marketed powders of FeO. The red-colored overglaze includes much amount of α-Fe2O3 (19.1 wt.%) and shows the X-ray diffraction patterns belonged to the α-Fe2O3 structure, but not glass-like one. This means that the α-Fe2O3 particles in the red-colored overglaze are in the long-range order. Fig.
Celadon glaze Fe-K Mn-K Cu-K Cr-K
Seiji A 2.77 0.026 0.0040 0.0001
Seiji B 0.066 0.019 0.0030 0.0002
Seiji C 2.76 0.021 0.0021 0.0001
Seiji D 0.047 0.020 0.0019 0.0001
Table III - Relative amplitudes of the XANES for the transition-metal ions, included in the tentative celadon glazes.
[Tabela III - Amplitudes relativas de XANES para os íons de metal de transição, inclusos nos esmaltes celadon.]
Figure 6: X-ray absorption spectra near the K-edge of Cu ions in the celadon glazes, Seiji A, B, C, and D.
[Figura 6: Espectros de absorção de raios X próximo da banda K de íons Cu nos esmaltes celadon, Seiji A, B, C, e D.]
0.010 0.010
0.010 0.010
0.008 0.008
0.008 0.008
0.006 0.006
0.006 0.006
0.004 0.004
0.004 0.004
8900 8900
8900 8900
9000 9000
9000 9000
E (eV) E (eV)
E (eV) E (eV)
I
/Io
I
/Io
I
/Io
I
/Io
8950 8950
8950 8950
9050 9050
9050 9050
9100 9100
9100 9100
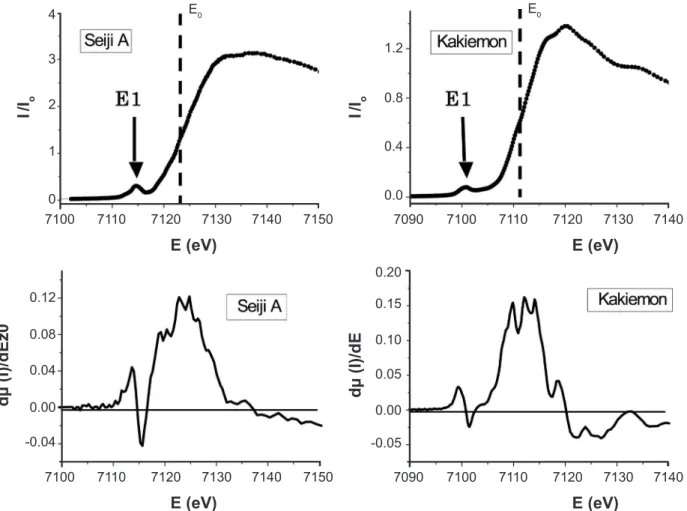
7 shows the XANES and its differential curve between Seiji A and the Kakiemon-style red-colored overglaze. In Fig. 7, Eo means a X-ray absorption threshold and is slightly sifted from 7111eV (a free Fe ion) to about 7122.5 and 7111.3 eV for Seiji A and the red-colored overglaze, respectively. Eo depends on the crystallographic structure and the instrumental condition of the used monochrometer of Si (111). It is considered that EF is approximately closed to Eo. The notation “E1” represents the pre-edge XANES peak, at which the differential curve dµ/dE (μ = I/Io ) shows a zero value. The pre-edge peak was observed at about 7114.6 eV for Seiji A and 7100.5 eV for the red-colored overglaze. The large broad peak of the differential curve near Eo indicates the transitional area of XANES from the valence band to the conduction band.
Glaze (eV) Eo E1 E2 EL ∆Eo1 ∆Eo2 ∆EoL
Seiji A 7122.5 7114.6 7120 7.9 2.5
Seiji C 7124.4 7114.5 9.9
Seiji (h) 7108.2 7100.0 7104.6 8.2 3.6
Seiji (m) 7112.2 7103.6 7108 8.6 4.2
Kakiemon 7111.3 7100.5 10.8
FeO 7118.3 7114.5 3.8
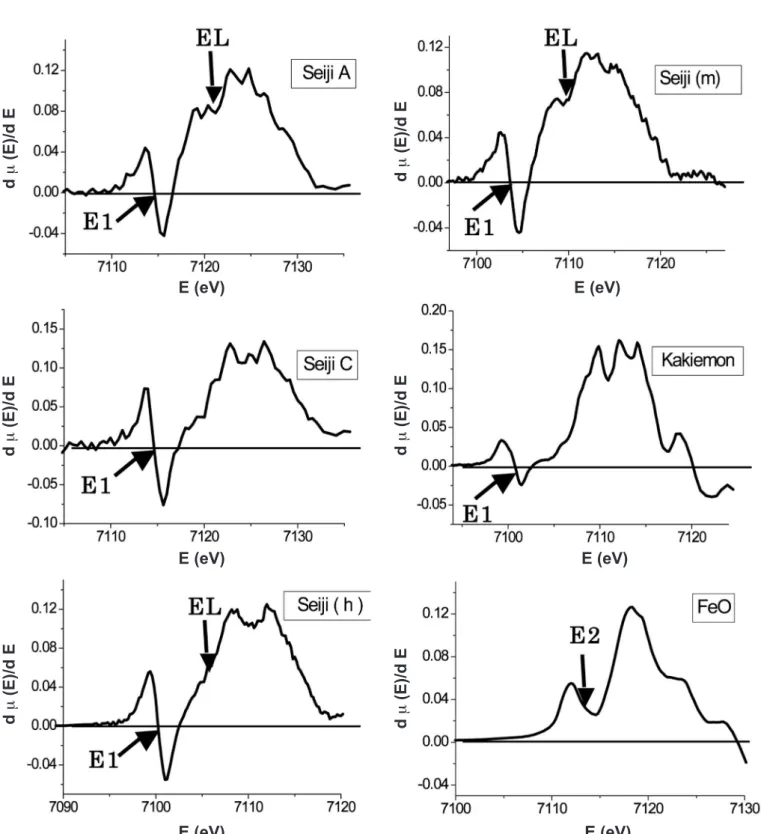
in the FeO differential curve represents the pre-edge XANES peak appearing at about 7114.5 eV, where its Eo was about 7118.3 eV. We conirm from the maximum peak-energy of the pre-edge XANES that the α-Fe2O3 structure and the FeO one have different electronic band states near EF, that is Eo, each other, as described later. In Fig. 8, we found that there is a characteristic small and broad peak on the differential curve of the celadon glazes of Seiji A, (h), and (m), in contrast to those of Seiji C, the Kakiemon red-colored overglaze and
the FeO powders. The weak peaks are noted by EL. In order to study the correlation among the observed Eo, E1, E2, and EL, we obtained the following relative energy difference; ∆Eo1 = Eo–E1, ∆Eo2 = Eo–E2 and ∆EoL = Eo–EL. Table IV represents the respective peak-energy and their relative energy differences, for the celadon glazes, the Kakiemon-style red-colored overglaze and the FeO powders. It is found that the Fe ions in the deoxidizing celadon glazes of Seiji A, (h), and (m) show the slightly different XANES to those of Figure 7: X-ray absorption spectra and differential curves near the Fe K-edge for Seiji A and the red-colored overglaze of Kakiemon–style porcelain.
[Figura 7: Espectros de absorção de raios X e curvas diferenciais próximo da banda K para amostras Seiji A e esmalte de cor vermelha de porcelana estilo Kakiemon.]
4
0.12
0.20
0.10
0.00 0.15
0.05
-0.05 3
0.08
1.2
2
0.04
0.8
1
0.00
0.4
0
-0.04
0.0 7100
7100
7100
7100 7120
7120
7120
7120 7150
7150
7090
7090 7110
7110
7110
7110 7140
7140
7140
7140 7130
7130
7130
7130
E (eV)
E (eV)
E (eV)
E (eV)
I
/I o
dµ
(I
)/d
Ez0
I
/I o
dµ
(I
)/d
E
Table IV - Energy of Eo, E1, E2, EL and the relative energy differences of ∆Eo1, ∆Eo2, ∆EoL for Seiji A, C, (h), (m), the Kakiemon-style red-colored overglaze and the FeO powders.
[Tabela IV - Energia de Eo, E1, E2, EL e diferenças relativas de energia de ∆Eo1, ∆Eo2, ∆EoL for Seiji
A, C, (h), (m), dos esmaltes de cor vermelha do estilo Kakiemon e de pós de FeO.]
Figure 8: Differential curves of the Fe-K XANES for Seiji A and C, Seiji (h), Seiji (m), the Kakiemon-style red-colored overglaze and the FeO powders.
[Figura 8: Curvas diferenciais XANES Fe-K para amostras Seiji A and C, Seiji (h), Seiji (m), esmalte de cor vermelha estilo Kakiemon e pós de FeO.]
E (eV)
E (eV)
E (eV)
E (eV)
E (eV)
E (eV)
d
m
(E)/
d
E
d
m
(E)/
d
E
d
m
(E)/
d
E
d
m
(E)/
d
E
d
m
(E)/
d
E
d
m
(E)/
d
E
Seiji C and the red-colored overglaze.
DISCUSSION
In order to study the correlation between the glaze-color and the structural and electronic band properties for
tentative celadon glazes, Seiji A, B, C, and D, by changing the containing amount of the extra-added Fe2O3 and the high-temperature treatment under the oxidizing and the CO-deoxidizing in the used kiln. The Seiji A, B, C and D glazes showed the characteristic color of blue-green, white-blue-green, brown and white-brown, respectively. It is found that the raw celadon materials of Masuda feldspar, limestone, Hadong kaolin and quartz kept mainly the feldspar structure and the quartz one at about 1000 ºC and were perfectly melted at about 1150 ºC, at which all of Seiji A to D were in glass-state. Although the present celadon glazes contain Mn, Cu, and Cr ions of very small, the amounts are very similar each other in Table III.This suggests that the color and brightness of Seiji A to D strongly depends on the containing amount of Fe2O3 in the celadon glazesand the high-temperature treatment of the oxidizing and the CO-deoxidizing. However, there is an ambiguity whether the present celadon glazes contain Fe2O3 or not. Because the ordinary X-ray luorescence analyzer detects only the X-ray luorescence emitted from Fe ions in the celadon glaze, as that of XAS. Thus, we cannot closely estimate that the iron oxide of Fe2O3 or FeO induces the characteristic glaze-color of the present celadon glazes.
The ambiguity may be considerably cleared by the pre-edge XANES peaks. The XANES appearing near the Fe K-edge is induced by an electron transition between 1s-band and other empty bands of Fe ions in the celadon glaze. However, it is known that the electronic transition between a 1s-orbital and a 3d-orbital is forbidden under a physical quantum condition. Fe3+ ion usually has ive electrons in the most outer 3d-orbital, that is 3d5, although the maximum electron-occupancy of the 3d orbital is 10. If there is an electronic exchange interaction, that is an electronic hybridization, between Fe ion and its neighboring oxygen ions, the electrons will be hopped between the empty 3d orbital of Fe ion and the full-occupied 2p orbital of O2- oxygen ion sited around the Fe ion [13]. This makes new hybridized bands of 3dnLm near E
F in the solid state, such as Fe2O3 or FeO, where L means the O-2p bands. Thus, the 3dnLm bands have a p-like character induced by the hybridization between the Fe-3d bands and the O-2p bands. This gives a possibility of the electron transition between the 1s and 3dnLm bands.
The pre-edge XANES peaks, noted by E1, in Figs. 6 and 7 result from the transition between the 1s band and the hybridized 3dnLm bands of Fe ions. In Table IV the relative energy differences ∆Eo1 of Seiji A, C, (h), and (m) are approximately similar with that of the Kakiemon-style red-colored overglaze. This suggests that these pre-edge XANES peaks result from the electronic transition between the 1s band and the hybridized 3d5L band of Fe3+. On the other hand, the pre-edge XANES peak of FeO results from the transition between the 1s band and the hybridized 3d6L band of Fe2+. Thus, we suspect that the Fe ions in the celadon glazes of Seiji A, (h) and (m) are not Fe2+. This is not consistent with the color-emission mechanism of
the celadon glaze reported by Larid [1] and Hunghan [2]. They reported that the celadon glaze was colored by the chemical reaction from Fe2O3 to FeO under the deoxidizing thermal treatment at higher temperature in a kiln. However, there is a slight difference of ∆Eo1 between two groups of (Seiji A, (h), (m)) and (Seiji C and the Kakiemon-style red-colored overglaze) in Table IV.
The XANES of Seiji A, (h), (m) show the characteristic weak peak on the differential curve of XANES, noted by EL. We suspect from the pre-edge XNES peaks that the EL weak peak indicates the hybridized 3d6L band, and that Fe ions in Seiji A, (h) and (m) have both hybridized bands of 3d5L and 3d6L. This implies that the conduction bands of celadon glazes are slightly modiied by the deoxidizing thermal treatment at high-temperature. Thus, it is considered that the elegant and characteristic glaze-color of blue-green and white-blue-green for Seiji A and B results from the appearance of the hybridized 3d6L band related to the light absorption. This also suggests that Seiji A and B, in addition to Seiji (h) and (m), include Fe ions having the complex hybridized 3d5L and 3d6L bands in the celadon glazes. We deduced that the complex electronic hybridization of Fe ions results from the electronic exchange interaction of the surrounding O ions in the (SiO2–Al2O3–CaO) basic complex ceramics of short-range order, that is glass-state, under the deoxidizing thermal treatment.
More recently, we have been also studying the deoxidizing effect to CuO of small amount in the porcelain ceramics by the X-ray diffraction and the X-ray absorption spectra near the K-edge of the transition-metal ions. It is known that the glaze color is changed from blue-green to brightly deep-red color under the deoxidizing of CuO at about 600-800 ºC. We found that the color change is also induced by the complex hybridized 3d8L and 3d9L bands of Cu ions in the CuO glaze of deep red-color. Therefore, we considered that the glaze color of transition metal oxide can be sensitively controlled by the order of the orbital hybridization between the transition metal ion and its surrounding O ions in the (SiO2–Al2O3–CaO) basic ceramics.
CONCLUSIONS
REFERENCES
[1] J. S. Larid, The composition of Chinese celadon pottery, J. Am. Ceram. Soc. 1 (1918) 675.
[2] R. R. Hunghan, Early Chinese ceramics glazes,Ceram. Age 56 (1950) 40.
[3] V. P. Shvaiko, A black glaze for porcelain, Steklo i Keramika 18 (1961) 33.
[4] A. Imai, Celadon − Chinese wares, Heibonsha 4 (2002). [5] W. Qing-zheng, F. Dong-quing, Z. Li-li, The Discovery
of Ru Kiln−A Famous Song-ware Kiln of China, The Woods
Publ. Co. (1991).
[6] K. Ohashi, HIZEN celadons−Japanese Seiji, The Kyushu Ceramic Museum (1989).
[7] K. Takeuchi, T. Kobayashi, S. Morokuma, H. Tsuzuki,
Development of old-fashined porcelain with traditional raw material II – Characteristic feature on the body and glaze of
Hasami celadon, Ann. Rep. Ceram. Res. Center of Nagasaki
48 (2001).
[8] Y. Nakano, MITUMATA Seiji Kiln, Hasami-cho Boad of Education 10 (1998).
[9] K. Ohashi, Arita and Imari porcelains, Tankosha (2002). [10] M. Hidaka, K. Ohashi, R. P. Wijesundera, L. S. R. Kumara, M. Watanabe, K. Koga, J. Y. Choi, N. E. Sung, Y. J. Park, Correlation between glaze-colors and structural properties of the HIZEN celadons produced in the Edo
period of Japan by means of X-ray diffraction (І), Cerâmica
57 (2011) 106.
[11] M. Hidaka, K. Ohashi, R. P. Wijesundera, L. S. R Kumara, S. Sugihara, N. Momoshima, S. Kubuki, N. E. Sung, Local structures and electronic band states of α− Fe2O3 polycrystalline particles in the glazes of the HIZEN celadons produced in the Edo period of Japan by means of X-ray absorption spectra (II), Cerâmica 57 (2011) 155. [12] M. Hidaka, K. Takeuchi, R. P. Wijesundera, L. S. R. Kumara, S. Sugihara, N. Momoshima, S. Kubuki, N. E. Sung, Structural and electronic properties of iron oxides in
the celadon glazes (II), Cerâmica (2012) accepted.
[13] J. Zaanen, G. A. Sawatzky, J. W. Allen, Band Gaps and
Electronic Structure of Transition-Metal Compounds, Phys.
Rev. Lett. 55 (1985) 418.