Relationship between photochemical
efficiency (JIP-Test Parameters) and portable
chlorophyll meter readings in papaya plants
Fernanda Assumpção Castro
1, Eliemar Campostrini
1*, Alena Torres Netto
2,
Leandro Hespanhol Viana
11 Universidade Estadual do Norte Fluminense Darcy Ribeiro (UENF) / Centro de Ciências e Tecnologias
Agropecuárias / Setor de Fisiologia Vegetal, Av Alberto Lamego, 2000, CEP: 28013620, Campos – Rio de Janeiro – Brazil,
2 Universidade Estadual do Norte Fluminense Darcy Ribeiro (UENF) / Centro de Biociências e Biotecnologias
Agropecuárias/ Laboratório de Biologia Celular e Tecidual, Av. Alberto Lamego, 2000, Campos dos Goytacazes, RJ, Brazil, 28013-620
* Corresponding author: fax (55 22) 27397191 e tel: (55 22) 27397105, e-mail: [email protected]
Received: 17 May 2011; Accepted: 27 January 2012
AbsTrACT
The Portable Chlorophyll Meter (PCM) is used to estimate the total chlorophyll and leaf nitrogen content of various species. Since there is a relationship between the chlorophyll concentration and the photochemical efficiency, a relationship can also be established between the PCM readings and some fluorescence variables to provide information on photosystem II (PSII) structure and activity. Papaya (Carica papaya L.) plants [‘Sunrise Solo’ (leaves with intense green coloring) and ‘Golden’ cultivars (leaves with yellow-green coloring) were grown in a yellow-greenhouse with 30% interception of photosynthetically active photon flux density. The plants were cultivated in 15L plastics pots. Ninety to 100 days after planting the older leaves turned yellow and the chlorophyll fluorescence variables and PCM readings were measured. At low PCM values (less than 30 to ‘Sunrise Solo’ and less than 20 to ‘Golden’) the PSII structure and activity were damaged, which is likely related to a reduction in the numbers of active reaction centers (RC/CS0).
At higher PCM values the chlorophyll a fluorescence variables (ABS/RC, DI0/RC, TR0/CS0 e ET0/CS0) that are related to PSII structure
and activity PSII were not responsive. These results indicated that the effects of chlorophyll content measured by PCM on the photochemical phase of photosynthesis evaluated by chlorophyll fluorescence occur after the degradation of chlorophyll molecules is initiated. In papaya the Portable Chlorophyll Meter (SPAD-502) was shown to be suitable for diagnosis of PSII energy distribution under N stress and senescence.
Keywords: Carica papaya, L., fluorescence, JIP-Test, Chlorophyll
iNTroDUCTioN
Obtaining new nondestructive technologies to study plant ecophysiology may lead to greater understanding of all the physiological processes. Further, when it becomes possible to carry out experiments and field studies with these technologies, users may be able to solve crop-related problems quickly, with less expense and without destroying the sampled material. Examples of these technologies are the PEA model of non modulated fluorimeter (Plant Efficiency Analyser, Hansatech Instruments Ltd., King’s Lynn, Norfolk, UK) and the Portable Chlorophyll Meter (PCM) (SPAD -502; Soil Plant Analysis Development, Minolta Camera Co. Ltd.). These technologies has fast, nondestructive measuring techniques and can be used under field conditions and permit an excellent assessment of the plant physiological process (Strasser et al., 1999; Kapoti et al., 2003).
Several papers have been published on the theoretical base and ecophysiological applications related to fluorescence (Krause and Weis, 1991; Mohammed et al., 1995, Schreiber et al., 1998, Baker, 2008). According to Krause and Weis (1991), measuring fluorescence can be considered as a complementary measurement of photosynthesis. Fluorescence emission shows the level of excitation energy in the pigment/protein complexes, the energy that controls photosynthesis (Scholes and Horton, 1993). In addition, fluorescence can be a very powerful tool to study photosynthetic performance, especially when coupled with other noninvasive measurements such as absorption spectroscopy, gas analyses, and infrared thermometry (Baker, 2008). Detailed information can be obtained through fluorescence on the structure, energy distribution and function of the photosynthesis operation, especially for PSII (Strasser et al., 2000). But fluorescence data can be better interpreted using the assessor test, the JIP-Test (Strasser and Strasser, 1995). By using the non-modulated fluorimeter Strasser and Strasser (1995), an optimized interpretations of fast fluorescence kinetics (F0=50ms; Fj=2ms and Fi=30ms) that lie between the two
extremes of the fluorescence intensity (F0=50µs and Fm
= 300ms) can be obtained. The JIP-Test is based on the theory of energy flow in biomembranes, which uses ratios to obtain variables that explain the energy flow through PS II (Strasser and Strasser, 1995). By measuring variables
associated with structural and functional aspects of PSII, the JIP-Test can be used to indicate the vitality of the plant material analyzed (Strasser et al., 2000).
Since fluorescence can indicate the status and changes in the PSII structure and activity (Strasser et al., 2000) physically located in the thylakoids, the degradation of these membranes can be expected to modify fluorescence emission. Changes in photosynthetic metabolism, which can be induced by many biotic and abiotic factors, will modify fluorescence emission kinetic characteristics of plants (Baker and Rosenqvist, 2004). The biotic and abiotic factors can promote senescence due this process cause loss of chlorophylls pigments (Hendry and Price, 1993, Brown et al., 1991). Senescence represents the final stage of leaf development, and is characterized by the transition from nutrient assimilation to nutrient remobilization (Feller and Fischer, 1994; Masclaux et al., 2000). In mesophyll cells, during the senescence chloroplasts are dismantled in an early phase of senescence, while mitochondria remain functional (Hortensteiner and Feller, 2002). Up to 75% of the nitrogen present in mesophyll cells is located in the chloroplasts (Peoples and Dalling, 1988), and most of nitrogen content of chloroplast is integrated in the thylakoid-bound apoproteins of chlorophyll. Then, the morphological analysis of senescing chloroplasts reveals dramatic changes of the thylakoid membrane system (Hortensteiner and Feller, 2002).
of the leaf sampled is located between source and the detector. When using PCM to estimate leaf chlorophyll content, calibration curves must be made for the species/ cultivar or variety studied that correlate PCM values with the true concentration of these pigments, determined by biochemical analyses (Wellburn, 1994).
In rice, Kumagai et al. (2009) correlated PCM readings with some photosynthetic parameters, suggesting that the PCM readings are an indirect indication of the photosynthetic capacity in the flag leaves. In Amaranthus vlitus, there was a linear correlation between PCM readings and some physiological parameters of the leaves, such as photosynthesis, transpiration, and stomatal conductance. (Kapotis et al., 2003).
When papaya undergoes some type of stress, whether water shortage or especially nitrogen deficiency, yellowing starts on the leaves at the base of the trunk and spreads to the tip of the stalk. A simple methodology is needed to determine the level of damage to photosynthesis due to the range of abiotic stresses that cause the senescence in papaya plants. The objective of this study was to determine if there was a relationship between PCM values and PSII performance obtained with the PEA non-modulated fluorimeter using the Biolyzer software (with the JIP-Test) on two Carica papaya L. genotypes (‘Sunrise Solo’ and ‘Golden’) that have contrasting chlorophyll content.
MATEriALs AND METHoDs
The experiment was conducted in a greenhouse with 30% interception of the photosynthetically active photon flux density (PAR) at the Plant Physiology Sector, LMVG, at the Northern Rio de Janeiro State University, Campos dos Goytacazes, RJ (21045’ S; 41017’ W) from June to
November. Two Carica papaya L. genotypes were used: ‘Sunrise Solo’ has intense green covering and ‘Golden’ has yellow-green coloring. From 15th June until 1st August, six plastic 15 L pots, containing soil with the addition of cow manure in the ratio of 3:1, were sown daily with four seeds in each pot, alternating the genotype sown, to obtain twenty eight plants per genotype at ninety days after each sowing (DAS)(3rd -4th green leaves; and 6th -7th green leaves) and twenty six plants per genotype at hundred DAS of each plant (3rd -4th green leaves; and
6th -7th senescent leaves). After hundred DAS, there was intense chlorosis in older leaves (6th-7th leaves, PCM reading <30), due to N deficiency which reduced total chlorophyll concentration. The N deficiency caused senescence of leaves.
The plants were thinned when they were 6 mm tall, irrigated daily and weeds were controlled manually. Throughout the experiment, variables such as temperature, relative humidity and PAR were measured (WatchDog 450, Spectrum Technologies, Illinois, USA), at hourly intervals. The mean temperature was 20.8 ± 3.4oC, and the mean of
the relative humidity was 82 ± 13%. The maximum PAR was 1000 µmoles m-2 s-1. The chlorophyll fluorescence
was measured at 730 h., at ninety and hundred DAS using the PEA non-modulated fluorimeter (Hansatech Instruments, England). The distal extremity of the central vein of the leaf blade of the 3rd or 4th leaf (mature leaves)
and the 6th or 7th leaf (old leaves) counted from the top
were measured. Prior to measurement, 3 leafclips were attached to maintain the leaf area in the dark for thirty minutes so that the reaction centers acquired the open condition (oxidized Qa) (Bòlhar-Nordenkampf et al., 1989). After dark adjustment, illumination was supplied by a set of 6 LEDs at 650nm with homogeneous 3000 µmoles m-2
s-1 illumination on an area of 4 mm diameter per leafclip,
using 5 fluorescence levels [F1 (t=50ms), F2 (t=100ms), F3 (t=300ms), F4 (t=2ms), F5 (t=30ms)] given by the PEA fluorimeter (Strasser et al. 2000). The following variables were measured and calculated using the Biolyzer software (R.J. Strasser, University of Geneva, Laboratory of Bioenergetics, Switzerland) of the JIP-Test (indicators of the performance of the photochemical process of photosynthesis): 1) ABS/RC ratio (the total number of photons absorbed by chl-molecules of all reaction centers (RCs) divided by the total number of active RCs. It is influenced by the ratio of active/inactive RCs); 2) TR0/RC
(the maximal rate by which an exciton is trapped by the RC resulting in the reduction of Qa); 3) DI0/RC (The ratio of
the total dissipation of untrapped excitation energy from all RCs with respect to the number of active RCs. Dissipation occurs as heat, fluorescence and energy transfer to other systems. It is influenced by the ratio of active/inactive RCs), 4) TR0/CS0 (the maximal trapping rate of an exciton that
reduced Qa via electron transport over a cross-section of active and inactive RCs) and 6) RC/CS0 (concentration of
the active reaction centres) (Force et al., 2003).
After measuring chlorophyll fluorescence, ten PCM readings were taken in the region where the PEA leafclips had been placed, totaling thirty readings per leaf. A mean PCM leaf value was calculated (N=30).
After removing the leaf disc on the same side where the chlorophyll fluorescence was measured, approximately 40 readings was taken using the PCM meter (SPAD-502, Minolta Camera Company, Japan) on the remaining part of the leaf blade. Afterwards, this part of the leaf was placed in the paper bags, taken to forced ventilation chamber at 25°C for 72 hours, weighed, squashed in a porcelain mortar (due to small amount of the material) and stored in the hermetically sealed flasks. Sulfuric digestion was performed on the ground material stored in sealed flasks and then the organic N concentration was determined on the leaf dry matter using the method by Nessler (Jackson, 1965).
rEsULTs AND DisCUssioN
The structure and function of PSII can be quantified through the JIP test using the polyphasic fluorescence
transients (Strasser et al., 1999, Strasser et al., 2000). We established the relationship between PCM values and PSII photochemical using the JIP test derived from the polyphasic rise of transient fluorescence. The calculated functional parameters are the specific (per reaction center, RC) and phenomenological (per cross section of the sample, CS) energy fluxes for absorption (ABS), trapping (TR), and electron transport (ET) (Lu et al., 2001).
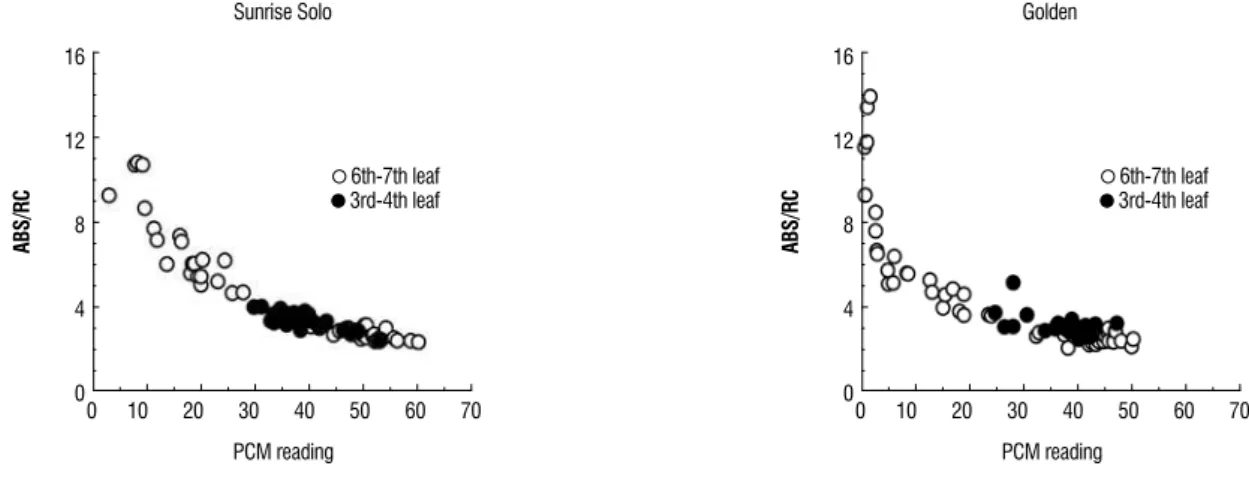
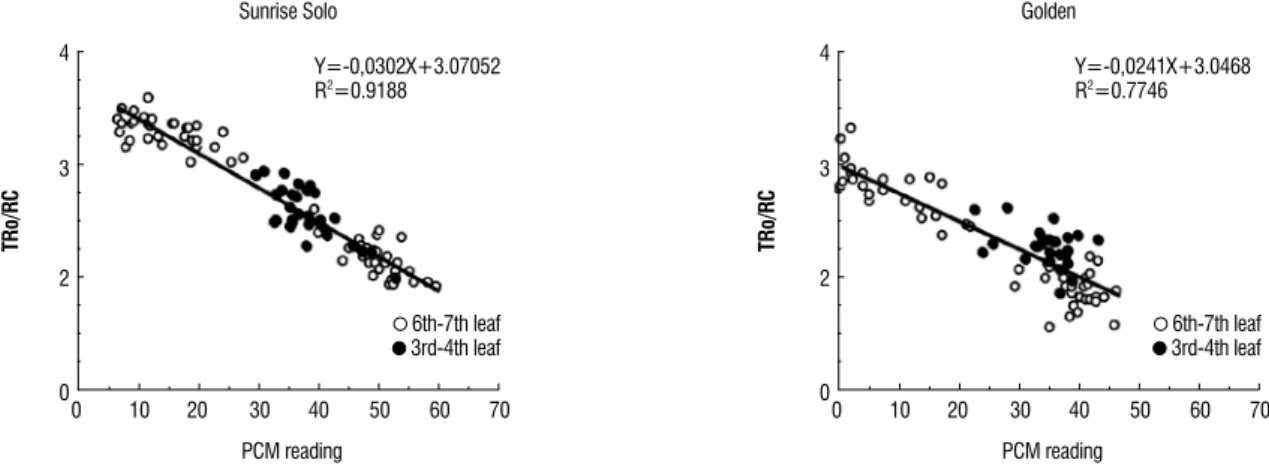
The relationship between PCM and ABS/RC (Figure 1) and TR0/RC (Figure 2) refer to the energy absorbed by the
chlorophyll molecules in the PSII antenna system (ABS), to the reduction in capacity of the Qa by the absorbed energy (TR), in relation to the quantity of active reaction centers (RC), respectively (Strasser et al., 2000). According to these authors, these variables can show the PSII structure and activity, and the reduction in the PCM readings caused increases in the ABS/RC ratio (Figure 1) and TR0/RC (Figure 2). The response
was the same for both the genotypes studied.
Increases in ABS/RC and TR0/RC were caused by
a reduction in the quantity of active reaction centers of the senescent old leaves (Figure 3). According to Strasser et al. (2000), the RC/CS0 ratio (Figure 4) measures the quantity of
active reaction centers (functional reaction centers). Thus, in both papaya genotypes the senescent leaves (PCM reading <30) showed intense reduction of active reaction centers.
Sunrise Solo
16
12
8
4
0
0 10 20 30 40 50 60 70
PCM reading
6th-7th leaf 3rd-4th leaf
Abs/rC
Golden
16
12
8
4
0
0 10 20 30 40 50 60 70
PCM reading
6th-7th leaf 3rd-4th leaf
Abs/rC
Sunrise Solo
4
3
2
0
0 10 20 30 40 50 60 70
PCM reading
6th-7th leaf 3rd-4th leaf y=-0,0302X+3.07052 R2=0.9188
Tr
o/rC
Golden
4
3
2
0
0 10 20 30 40 50 60 70
PCM reading
6th-7th leaf 3rd-4th leaf y=-0,0241X+3.0468 R2=0.7746
Tr
o/rC
Figure 2. Relationship between the TR0/RC (quantity of energy captured (reduced Qa) per unit of active reaction center and the PCM reading), on Sunrise Solo and
Golden papaya plants cultivated in a greenhouse. The open circles with reduced PCM readings (<30) refer the senescent 6th – 7th leaves.
Sunrise Solo
400
300
200
100
0
0 10 20 30 40 50 60 70
PCM reading
6th-7th leaf 3rd-4th leaf y=3.839X+135.45 R2=0.7934
rC/C
so
400
300
200
100
0
0 10 20 30 40 50 60 70
PCM reading
6th-7th leaf 3rd-4th leaf y=6.2266X+51.642 R2=0.9329
rC/C
so
Golden
Figure 3. Relationship between the RC/CS0 ratio (density of active reaction center related to reduction in Qa) and the PCM reading, in Sunrise Solo and Golden papaya
plants cultivated in a greenhouse. The open circles with reduced PCM readings (<30) refer the senescent 6th – 7th leaves.
Sunrise Solo Golden
60
50
40
30
20
10
0
0 10 20 30 40 50 60 70
PCM reading
3rd-4th leaf 6th-7th leaf
organic nitrogen content (g kg
-1)
y=14,82367+0,14792X+0,00683X2
R2=0,67655
n=70
60
50
40
30
20
10
0
0 10 20 30 40 50 60 70
PCM reading
3rd-4th leaf 6th-7th leaf
organic nitrogen content (g kg
-1)
y=18,21279+0,19679X+0,00815X2
R2=0,78392
n=70
‘Sunrise Solo’ had a statistically reduced decrease (slope =3.83) in the active reaction centers for this variable compared to ‘Golden’ (slope =6.23), indicating that ‘Golden’ had more destruction of the centers with the decrease in the PCM value (Figure 3). Based on these results (Figures 1, 2, 3) the damage to the PSII structure and activity may be associated with the large quantity of it inactive reaction centers of the senescent older leaves (6th-7th leaves, PCM reading <25) in the Golden genotype. Actually, the Golden genotype have reduced chlorophyll concentration (Torres-Netto et al., 2009), then the senescence is more fast in this genotype.
Torres Netto et al. (2001) showed that the total nitrogen content fell sharply when the PCM values were lower than 40 in papaya. In the present study, plants hundred DAS had N deficiency and reduced chlorophyll concentration in older leaves (7th leaf) (Figure 4). An increase in ABS/RC in N deficient leaves indicates an increase in the antenna size since ABS/RC can be a measure of the relative antenna size (Strasser and Strasser., 1995, Krüger et al., 1997). As pointed out by Lu et al. (2001), the expression ABS/RC (also TRo/ RC) refers only to the active PSII reaction centers, thus an inactivation of some PSII reaction centers can lead to an
increase in ABS/RC. In rice, Lu et al. (2001) showed that RC/ CS [quantity of active reaction centers (functional reaction centers)] decreased in the N deficiency plants.
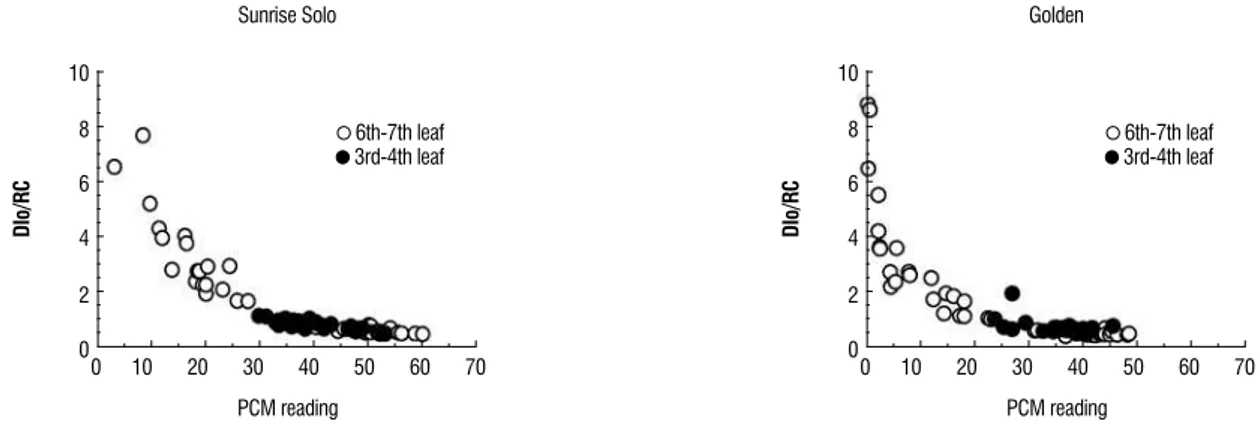
Because N is a mobile element, N deficiency is indicated by chlorosis in the older leaves near the base of the plant. Under severe nitrogen deficiency, these leaves become completely yellow and have very low PCM readings. younger leaves may not show these symptoms initially, because nitrogen can be mobilized from older leaves (Taiz and Zeiger, 2010). In this experiment, the lower PCM values (Sunrise Solo <30; Golden <25) were obtained using senescent older leaves (7th leaf) in plants cultivated after hundred DAS (Figure 4). In maize, N deficiency increased ABS/RC and TRo/RC, however, when the emission of dissipated energy was measured compared to the active reaction centers (DI0/RC) (Figure 5), the low PCM
values indicated increases in the quantity of dissipated energy (energy not used in photochemistry). This energy is dissipated mainly in the form of heat (Strasser et al,. 2000). Therefore, dissipation can be thought as the absorption of photons in excess which cannot be trapped by the RC. ‘Sunrise Solo’ showed same sensitive that ‘Golden’ to increases in dissipated energy.
Sunrise Solo
8 10
6
4
2
0
0 10 20 30 40 50 60 70
PCM reading
6th-7th leaf 3rd-4th leaf
Dio/rC
Golden
8 10
6
4
2
0
0 10 20 30 40 50 60 70
PCM reading
6th-7th leaf 3rd-4th leaf
Dio/rC
Figure 5 - Relationship between the DI0/RC ratio (energy dissipated per active reaction center) and the PCM reading, in Sunrise Solo and Golden papaya plants
cultivated in a greenhouse. The open circles with reduced PCM readings (<30) refer the senescent 6th – 7th leaves.
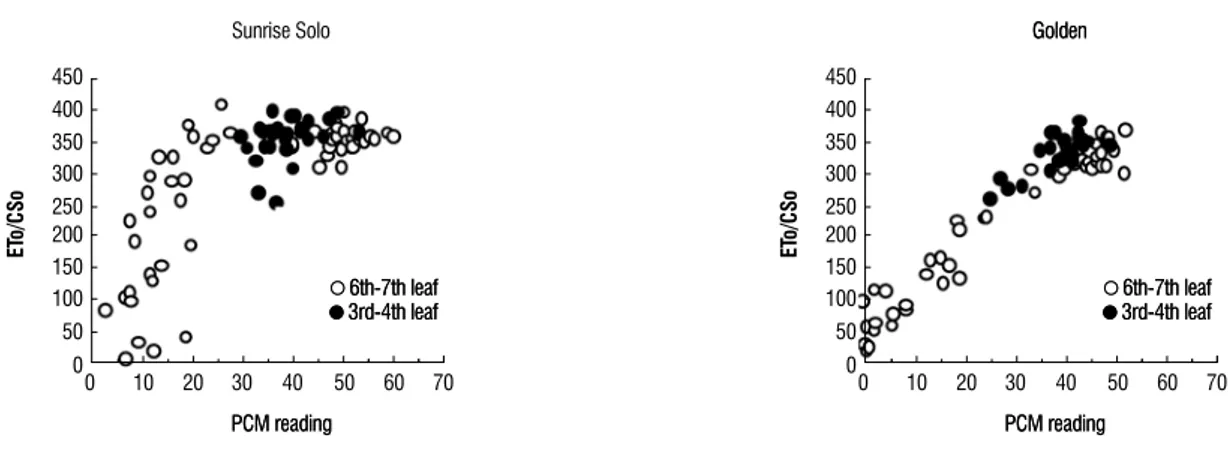
The relationship between TR0/CS0 (Figure 6) and ET0/CS0
(Figure 7) and PCM is also an indication of the PSII structure and activity, and these relationships represent the maximum rate at which an excitation is captured by the reaction center, resulting in a reduction in Qa, measured per cross section unit of the sample, and the re-oxidization of reduced Qa via electron transport per cross section unit of the sample, respectively
(Force et al., 2003). In addition, photosynthetic activity can be expressed by electron transport per leaf cross section (ETo/CS) (Strasser et al., 1999). There was damage to the Qa reduction capacity (TR0/CS0) at PCM values below 20.0 in
‘Sunrise Solo’ (Figure 6A) and below 30.0 in ‘Golden’ (Figure 6B). However, for the Qa reoxidation capacity (ET0/CS0),
7A) and 35 for ‘Golden’ (Figure 7B). When the ET and TR values are expressed per unit cross section, the effect of the reduction in the PCM readings is very evident on the electron transport and capacity of the photosystem to reduce Qa (Figures 6 and 7). In addition, the ‘Golden’ genotype was more sensitive than ‘Sunrise Solo’ when PCM readings decrease. In rice, N deficiency decreased TRo/CS and ETo/CS (Lu et al., 2001). Because the photochemical processes depend on a set of complex protein molecules that are located in and around a highly organized membrane, there is a dependence on the membrane structure. A high degree of organization
of the pigment–protein complexes is required for efficient utilization of the solar energy by photosynthetic organisms. Since reduced N and chlorophyll concentration is often associated with structural membrane damage, it is expected that low PCM values will affect the photochemical efficiency evaluation. Actually, most important in terms of nitrogen content are the thylakoid-bound apoproteins of chlorophyll, mainly light-harvesting chlorophyll binding proteins (LHCP II). Hence, in addition to Rubisco, degradation of LHCP II is a major contributor to the overall loss of protein during foliar senescence (Matile, 1992).
Sunrise Solo 1000
800
600
400
200
0
0 10 20 30 40 50 60 70
PCM reading
6th-7th leaf 3rd-4th leaf
Tr
o/C
so
Golden 1000
800
600
400
200
0
0 10 20 30 40 50 60 70
PCM reading
6th-7th leaf 3rd-4th leaf
Tr
o/C
so
Figure 6. The relation between the TR0/CS0 ratio quantity of captured energy (reduced Qa) per section of the sample] (6A, 6B) and the PCM reading, in Sunrise Solo
and Golden papaya plants, cultivated in a greenhouse. The open circles with reduced PCM readings (<30) refer the senescent 6th – 7th leaves.
Sunrise Solo
400
0
0 10 20 30 40 50 60 70
PCM reading
6th-7th leaf 3rd-4th leaf
ET
o/C
so
350 300 250 200 150 100 50
Golden
450
PCM reading
6th-7th leaf 3rd-4th leaf
Golden
400
0
0 10 20 30 40 50 60 70
PCM reading
6th-7th leaf 3rd-4th leaf
ET
o/C
so
350 300 250 200 150 100 50 450
PCM reading
6th-7th leaf 3rd-4th leaf
Figure 7. The relation between the ET0/CS0 ratio (electron transport rate per section of the sample) (7A and 7B) and the PCM reading, in Sunrise Solo and Golden
papaya plants, cultivated in a greenhouse. The open circles with reduced PCM readings (<30) refer the senescent 6th – 7th leaves.
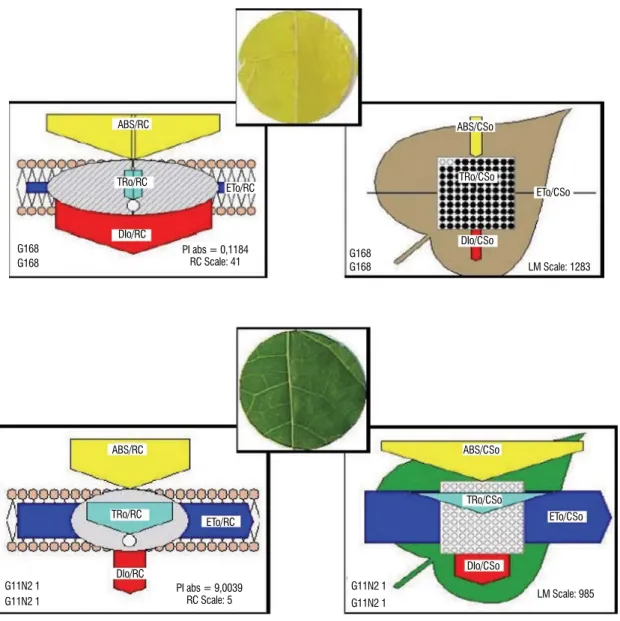
The structure and function of PSII can be visualized by means of the energy pipeline models of the photosynthetic
expressed by the width of the corresponding arrows, and the solid and open circles show inactive and active RCs, respectively. Two types of models are proposed. One is the membrane model, which refers to the reaction center in the membrane and thus deals with the specific energy fluxes (per active RC). Another is the leaf model, which refers to the cross section of leaf and thus deals with the phenomenological fluxes (per CS). The membrane model demonstrates the antenna size, which corresponds to the value of ABS/RC. In the leaf model, the active PSII reaction centers per cross section (RC/ CS) are indicated by open circles and the inactive ones by closed circles. In Figure 8A and 8C, when the PCM reading was equal to 6.0 for ‘Sunrise Solo’ and 1.0 for ’Golden’, an
increase was observed in the absorption per active reaction center (ABS/RC) that was due to the deactivation of some active reaction centers (number of the solid circles). In the leaf model, deactivation of the active reaction centers was indicated by solid circles compared to the open circles (active centers).
The decrease in the PCM value (e.g., 6.0 and 1.0) resulted in a decrease in electron transport, due to the deactivation of the active reaction centers and increased energy dissipation, compared to leaves with greater PCM readings [45 (Sunrise Solo genotype) and 39 (Golden genotype)] (Figures 8B and 8D). Figures 8B an 8D, i.e. 45 and 39 PCM readings, showed that the active reaction centers were not deactivated (only open circles).
ABS/RC ABS/CSo
TRo/CSo
DIo/CSo
ETo/RC ETo/CSo
141 141
141 141
TRo/RC
DIo/RC
PI abs = 0,0249
RC Scale: 23 LM Scale: 2727
ABS/CSo
TRo/CSo
DIo/CSo
ETo/CSo
SFN3 1 SFN3 1
SFN3 1 SFN3 1
DIo/RC
PI abs = 9,2112
RC Scale: 3 LM Scale: 971
ABS/RC
TRo/RC
ABS/CSo
TRo/CSo
DIo/CSo
ETo/CSo
G168
G168 G168G168
DIo/RC
PI abs = 0,1184
RC Scale: 41 LM Scale: 1283
ABS/RC
TRo/RC ETo/RC
ABS/CSo
TRo/CSo
DIo/CSo
ETo/CSo
G11N2 1 G11N2 1
G11N2 1 G11N2 1
DIo/RC
PI abs = 9,0039
RC Scale: 5 LM Scale: 985
ABS/RC
TRo/RC
ETo/RC
Figure 8. Energy pipeline models of the specific (membrane model, per RC) and phenomenological (leaf model, per CS) fluxes of leaf from a papaya plant of the Sunrise Solo genotype with PCM values of 6.0 (A) and 45 (B), and the Golden genotype with PCM values of 1.0 (C) and 39 (D). The solid and open circles show inactive and active RCs, respectively. The value of each of the parameters can be seen in the relative changes in the width of each arrow.
CoNCLUsioN
At PCM values greater than 30, the assessment of PSII structure and function were not responsive, indicating that there was no degradation of chlorophyll and a luxury production of these molecules for PCM values greater than 30. For PCM values less than 30, the PSII structure length and function was associated with a decrease in the number of active reaction centers. Therefore, in plants 90 and 100 days after sowing, the use of the Biolyzer program (by the JIP-Test)
and the Portable Chlorophyll Meter (PCM) were shown to be suitable to assess the photochemical efficiency of the papaya plants of the groups ‘Solo’.
regarding use of the Biolyzer software. The authors thank CNPq for the fellowships awarded to E. Campostrini. We are also thankful to Dr. David Michael Glenn, USDA-ARS-Appalachian Fruit Research Station, Kearneysville, WV 25430 for helpful discussions and grammar correction.
rEFErENCEs
Baker NR (2008) Chlorophyll fluorescence: a probe of photosynthesis in vivo. Annual Review Plant Biology 59: 89-113.
Baker NR and Rosenqvist E (2004) Applications of chlorophyll fluorescence can improve crop production strategies: an examination of future possibilities. J. Exp. Bot. 55: 1607-1621.
Bolhàr- Nordenkampf H.R, Long SP, Baker NR, Öquist G, Schreiber U AND Lechner EG (1989) Chlorophyll fluorescence as a probe of the photosynthetic competence of leaves in the field: a review of current instrumentation. Functional Ecology 3: 497 – 514.
Brown SB, Houghton JD, Hendry GAF (1991) Chlorophyll breakdown. In: Scheer H (ed), Chlorophylls, pp. 465- 489. Boca Raton: CRC Press. Evans J.R. (1989) Photosynthesis and nitrogen relationship in leaves of C3
plants. Oecologia, 78: 9-19.
Feller U, Fischer A. (1994). Nitrogen metabolism in senescing leaves. Critical Reviews in Plant Sciences 13: 241–273
Force L, Critchley C AND Van Rensen JJS (2003) New fluorescence parameters for monitoring photosynthesis in plants 1- The effect of illumination on the fluorescence parameters of the JIP-test. Photosynthesis Research 78:17-33. Hendry GAF AND Price H (1993) Stress indicators: chlorophylls and carotenoids. Methods in comparative plant ecology. London: Chapman and Hall
Hortesteiner, S., Feller, U. (2002) Nitrogen metabolism and remobilization during senescence. Journal of Experimental Botany, 53: 927-937
Jackson, M.L. (1965) Soil Chemical Analysis. New Jersey: Prentice Hall. 498p.
Kapotis G, Zervoudakis G, Salahas G. (2003) Comparison of chlorophyll meter readings with leaf chlorophyll concentration in Amaranthus vlitus: correlation with physiological processes. Russian J. Plant Physiol. 50: 395-397 Krause GH AND Weis E (1991) Chlorophyll fluorescence and photosynthesis: the basics. Annual Review of Plant Physiology and Biology 42: 313-349. Krüger GHJ, Tsimilli-Michae M, Strasser RJ. (1997) Light stress provokes plastic and elastic modifications in structure and function of photosystem II in camellia leaves. Physiologia Plantarum 101: 265–277.
Kumagai E, Araki T, Kubota F (2009) Correlation of chlorophyll meter readings with gas exchange and chlorophyll fluorescence in flag leaves of rice (Oryza
sativa L.) plants. Plant Production Science 12: 50-53.
Lu C, Zhang J, Zhang Q, LI L AND Kuang T (2001) Modification of photosystem II photochemistry in nitrogen deficient maize and wheat plants. Journal Plant Physiology 158: 1423-1430.
Masclaux C, Valadier M-H, Brugiere N, Morot-Gaudry J-F, Hirel B. (2000). Characterization of the sink/source transition in tobacco (Nicotiana tabacum
L.) shoots in relation to nitrogen management and leaf senescence. Planta 211: 510–518
Matile P, Schellenberg M, Peisker C. 1992. Production and release of a chlorophyllcatabolite in isolated senescent chloroplasts. Planta 187, 230– 235.
Mohammed GH, Binder WD AND Gillies SL (1995) Chlorophyll fluorescence: a review of its practical forestry applications and instrumentation. Scandinavian Journal Forest Research 10: 383 – 410.
Scholes JD AND Horton P (1993) Photosynthesis and chlorophyll fluorescence: simultaneous measurements. In: Hendry GAF AND Grime JP (eds), Methods in comparative plant ecology: a laboratory manual., p. 130 – 135. London: Chapman and Hall.
Schreiber US, Bilger W, Hormann H AND Neubauer C (1998) Chlorophyll fluorescence as a diagnostic tool: basics and some aspects of practical relevance. In: Raghavendra AS (ed), Photosynthesis: a comprehensive treatise, p.320-336. Cambridge University.
Strasser RJ, Tsimilli- Michael M AND Srivastava A (2000) The fluorescence transient as a tool to characterize and screen photosynthetic samples. In: yunus M, Pather U, Mohanly P (eds.), Probing Photosynthesis: Mechanisms, Regulation and Adaptation, p.445-483.Taylor and Francis, London. Strasser RJ, Srivastava A, Tsimilli-Michael M (1999) Screening the vitality and photosynthetic activity of plants by fluorescence transient. In: Behl RK, Punia MS, Lather BPS (eds), Crop improvement for food security, pp. 79-126. SSARM, Hisar.
Strasser BJ AND Strasser RJ (1995) Measuring fast fluorescence transients to address environmental questions: the JIP- Test. In: Mathis P (ed.), Photosynthesis: from light to biosphere, p.977 – 980. The Netherlands: Kluwer academic publishers.
Taiz L AND Zeiger E (2010) Plant Physiology. Sinauer Associates, Inc., Publishers, Sunderland, Massachusetts. 782p.
Torres Netto A, Campostrini E, Oliveira JG, yamanishi OK (2002) Portable chlorophyll meter for the quantification of photosynthetic pigments, nitrogen and possible use for assessment of the photochemical process in Carica
papaya L. Braz. J. Plant Physiol. 14: 203-210