1 0 2 1 0 2 1 0 2 1 0 2 1 0 2
International Laser Center.
International Laser Center, Ilkovicova 3, 812 19 Bratislava, Slovak Republic. Mailing address: Ljuba Bacharova International Laser Center Ilkovicova 3 -812 19 Bratislava - Slovak Republic - E-mail: [email protected]
Received to publication on 15/4/02 Accepted in 15/1/03
Arq Bras Cardiol, volume 81 (nº 1), 102-10, 2003
Ljuba Bacharova
Bratislava, Slovak Republic
Evidence-Based Medicine.
A Lesson for Electrocardiography?
placed by new imaging methods in many applications. And in some applications, ECG is even considered obsolete, eg, in the diagnostics of left ventricular hypertrophy (LVH).
The rational way to increase the interest of cardiolo-gists, to attract young scientists, and to increase the value of ECG, is to analyze and consequently to reduce its limita-tions. This means, first, to reevaluate the “old truths” and “myths,” second, to focus attention on the unique informa-tion provided by electrocardiography, and third, to recogni-ze the added value of ECG in the contextof other diagnostic methods, such as echocardiography, scintigraphy, NMR, and many others. I do not consider the frequently presen-ted statement that ECG is easily available and inexpensive to be a sound argument.
The need to constantly reevaluate accumulated know-ledge and evidence is not limited to electrocardiography. It is a necessity for most fields of medical and professional practice. In the last 2 decades, this need has been formula-ted as evidence-based medicine (EBM) demanding the criti-cal appraisal of evidence. Sackett et al 2 defined
evidence-based medicine as the conscientious, explicit, and judicious use of current best evidence in making decisions about the care of individual patients. The practice of EBM means inte-grating individual clinical expertise with the best available external clinical evidence from systematic research. The evi-dence-based approach includes 4 stages:the formulation of answerable questions; the search for the best evidence; critical appraisal of the evidence; the decision to apply the conclusions to patients’ health care.
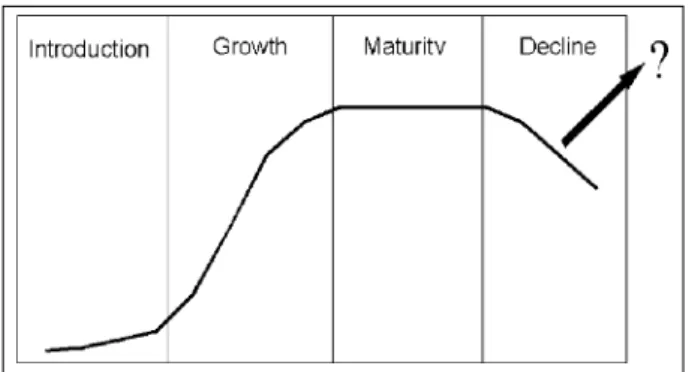
EBM provides general principles and a standardized way to reevaluate knowledge. The aim of this article is to apply the principles of evidence-based medicine to electro-cardiography and to begin discussions about evidence-based electrocardiography. An evidence-evidence-based medicine approach is applied to the ECG diagnostics of left ventricular hypertrophy based on voltage criteria not currently consi-dered a “hot topic” and one in which a decline in interest is evident. We will assess whether an EBM approach is help-ful in our efforts to reevaluate the “old truths,” to define the unique information provided by electrocardiography and Electrocardiography is an old diagnostic method,
introduced at the end of the 19th century. Now, at the begin-ning of the 21st century, one of the main concerns of elec-trocardiologists is a decreased interest in electrocardiogra-phy in general, particularly among young scientists 1.
Naturally, electrocardiography has strengths and weaknesses related to its age. On the one hand, it is a well-established, accepted, and respected clinical and experi-mental method, based on a substantial body of knowledge and experience, accumulated during the century of its exis-tence. On the other hand, limitations also exist related to this age: fixed out-of-date ideas and beliefs, modifications cau-sed by rewriting and recitations, and a gap between fixed ideas about ECG and up-to-date nonelectrocardiologic knowledge.
re-1 0 3 1 0 3 1 0 3 1 0 3 1 0 3
the role and its added value per se of ECG, and its value in the contextof other diagnostic methods.
Left ventricular hypertrophy and the ECG
diagnostics of LVH
The basic general definition of hypertrophy is an “ in-crease in the size of an organ or tissue without an inin-crease in the number of its component units. Hypertrophy of the heart may result in a several-fold increase of in size and functional activity without a change in the number of mus-cle fibres. Often the term is loosely used to mean an increa-se in size without regard to the unit of structure” 3. We can
define LVH as an increase in LV size and functional activity. This increase in size of individual myocytes and of the left ventricle as a whole is conditioned and associated with structural and functional changes, such as gene expression, protein synthesis, intracellular morphology, gap junction distribution, energy supply, oxygen consumption, structu-ral rearrangement of myocardial tissue, contractility, apop-tosis, etc. It needs to be stressed that LVH is not a static phenomenon, but it develops and progresses over time, in extreme cases, leading to heart failure. Three distinct stages of experimental LVH with characteristic biochemical, subcel-lular, celsubcel-lular, tissue, and functional changes have been des-cribed 4,5: The first stage represents the period of adaptation
and the rebuilding of myocardium to achieve adequate performance, the second stage is defined as compensated hypertrophy, and during the third stage a gradual develop-ment of heart failure and degradation of the myocardium occur. The complex rebuilding of structure is sometimes referred to as anatomical remodeling and in relation to elec-trogenesis as electrophysiological remodeling.
Therefore, in the case of LVH, we have to consider: increase in size, anatomical and electrophysiological remo-deling; progress and changes over time.
However, probably due to limited clinical diagnostic possibilities, the definition of LVH is restricted to the increa-se in size or mass. For example: “The most valid definition of hypertrophy is ‘a demonstrable increase in isolated LV muscle mass” 6.
The electrocardiographic diagnosis of LVH is primarily based on so-called voltage criteria: the increased amplitude of the QRS complex in selected leads. The increased voltage of the QRS complex is considered a specific diagnostic fin-ding for LVH 7-10.
The current underlying hypothesis expresses the per-sistent belief that an increased myocardial mass should produce a stronger cardiac electric field and should be reflected in the increased voltage of the QRS complex. For example: “The excitation of the larger and thicker muscle mass results in larger and longer living activation boun-daries, which in turn, result in the more than usual pre-ponderance of the leftward and posteriorly oriented elec-trical forces”11. Or: “The greater LV mass causes an
in-crease in QRS amplitude....” The electrocardiographic diagnosis of LVH is based mainly on the increase in QRS voltage generated by the increase in LV mass” 12.
The generally accepted formula for the magnitude of the extracellularly recorded potential E is based on the so-lid-angle theory 13:
where Ω is the solid angle, relating the boundary geo-metry to the electrode site. ∆Vm is the transmembrane potential difference, K is a constant related to the conducti-vity and anisotropy of the myocardium. Theoretically, the potential at the recording site is determined by the conduc-tivity of the medium, the charge density per unit area of the polarized surface, and the solid angle subtended at the recording site by this surface 14.
However, using voltage criteria, electrocardiography detects only a small percentage of the cases of LVH docu-mented by the echocardiogram or by autopsy 10,15. The low
performance of voltage criteria is a source of strong criti-cism of ECG in LVH diagnostics and has been leading gra-dually to decreased interest in electrocardiography among cardiologists.
The lesson to be learned from evidence-based
medicine
1) The formulation of answerable questions - Curren-tly, the continuous effort of electrocardiologists is directed towards the best estimate of left ventricular size or left ventricular mass (LVM), to the detection of increased LVM or size. In other words, it means that we ask the following questions: “How big is the left ventricle?” or “Is the left ven-tricle bigger than a healthy one?”
However, electrocardiography does not primarily provide the information on the size or mass. The information provided by electrocardiography is on the electric field generated by the heart and recorded on the body surface.
1 0 4 1 0 4 1 0 4 1 0 4 1 0 4
The magnitude of recorded potentials can, but does not necessarily, reflect the size of the source (fig. 2). In other words, sources of different size can exhibit the same volta-ge, if they differ in their electrical properties. It follows, that we are asking a question, which is not answerable.
The questions, which could be answerable by electro-cardiography, are: “How strong is the LV as a source of car-diac electric field?” Or more focused: “How strong is the LV as a source of cardiac electric field in relation to its size?”
2) The search for the best evidence - The range of pu-blications on ECG diagnostics of LVH is extensive. The increased QRS voltage was reported as early as 1906 by Einthoven 16, as characteristic of LVH. From this time, a
va-riety of electrocardiographic criteria for detection of LVH have emerged over the years and a number of recommended criteria have been published. The development of ECG vol-tage criteria has followed the development of ECG methods, from the standard 12-lead ECG where frontal plane and hori-zontal plane individual leads, combined criteria, or the total sum of the QRS have been used, through orthogonal elec-trocardiography and vectorcardiography, to the evaluation of body surface potential mapping.
A natural tendency is to read more recent publications that provide the latest evidence and opinion. Many histori-cal publications are not readily available. However, the re-cency of publications could lead to unexpected surprises, as can be demonstrated by quotations about the Brody effect.
The original text 17: The relatively large conductivity
of the intracavitary blood mass tends to short-circuit the tangential components, but augments the radial compo-nents of myocardial doublets, reflected in the decrease of tangentially oriented dipole moment and in the increase of radially oriented dipole moment.
A slight shift in terms - from dipole moment to electro-cardiographic surface potential:
“Brody, using a mathematical model, suggested that intracardiac blood, a highly conductive mass, augments the electrocardiographic surface potential if the progress of myocardial excitation is radial to the blood mass. 18
A shift in meaning - a conductivity-volume shift: intra-cavitary conductivity resulting from increased blood volume.
“Bayley and Berry (1963) have suggested that in-creased intracavitary conductivity resulting from increa-sed blood volume will augment the QRS voltage by local effects on the dipoles in the cardiac muscle” 19.
One interpretation of the Brody effect: An increase
in QRS amplitude with decreasing volume:
“This finding would support the Brody effect, namely, an increase in QRS amplitude with a fall in end diastolic volume” 20.
And an opposite interpretation: An increase in QRS
amplitude with increasing volume and a reduction in QRS amplitude with a decrease in volume:
“Therefore, according to the Brody effect, an increase in left ventricular volume should be accompanied by an increase in surface QRS amplitude, and a decrease in volume, by a reduction in amplitude” 21; or “According to
Bonoris, R wave increase during exercise should be ascri-bed to an increase in chamber size in patients with coro-nary artery disease, whereas no change occurs in normal subjects: this is so called [the] ‘Brody effect’ ”22; or “Brody
has reasoned that a dilated ventricle will more effectively augment radially directed dipoles because of the increase in intracavitary blood mass and thereby increase the vol-tage inscribed at the body surface” 23.
Using suitable selected quotations, one can explain both an increase and a decrease in QRS amplitude due to both changes in conductivity or in increased or reduced volume, respectively, simply by the application of the Brody effect.
In spite of the variety of voltage criteria, one theme is common – the search for the increased QRS amplitude, exceeding the upper normal limits. Only values exceeding the upper normal limits are considered evidence. It is reflec-ted also in the terminology used; these results are called “true-positive”. The values within normal limits - lower than expected - are earmarked as “false-negative” and are neglec-ted in clinical diagnostic or prognostic decision making. However, these so-called false- negative findings are the dominant findings in the ECG diagnostics of LVH. In other words, enough evidence exists that the voltage in LVH is in the majority of cases lower than that expected according to the classical hypothesis.
3) Critical appraisal of the evidence - In this part, the focus will be on the critical appraisal of the current classical hypothesis, the application of the solid angle theory, the design of studies and of argumentation and derived conclu-sions in these studies.
Critical appraisal of the tested hypothesis
As already mentioned above, according to the classi-cal hypothesis we expect that the increased mass of the left ventricle in LVH generates a stronger cardioelectric field. This assumption is rather straightforward: the bigger the mass, the more severe the hypertrophy, the higher the am-plitude of QRS should be.
1 0 5 1 0 5 1 0 5 1 0 5 1 0 5
This hypothesis was derived from the following clini-cal and experimental evidence: the increased QRS amplitu-de exceeding upper normal limits is seen in a proportion of patients with LVH and is highly specific for LVH;close cor-relations between QRS amplitude and hemodynamic data of patients with left ventricular overload have been reported. Moreover, the increased voltage of the QRS complex was revealed as an independent significant risk factor for car-diovascular mortality 24. These findings stress the
prognos-tic value of increased voltage and provide additional argu-ments in favor of the importance of increased QRS amplitude. However, enough evidence exists biasing the validity of this hypothesis. Of particular relevance here is the high proportion of false-negatives, resulting in a low sensitivity of voltage criteria in LVH detection 25. Reported sensitivities
are mostly below 50%, ranging to 20%, or even lower 26-28. It
means, on the other hand, that the percentage of false-nega-tive results is over 50%, up to 80% and even more. Next, the modest correlation between QRS voltage and left ventricu-lar mass results in an unsatisfactory estimation of LVM. In spite of the fact that the proportion of patients with increa-sed QRS amplitude is relatively small, these findings are ge-neralized and it is expected thatall patients should have in-creased voltage. If not, it is concluded, that ECG is of limited value or even obsolete.
Mashima 29 called hypertrophy causing the
enlarge-ment of the QRS amplitude as “ideal” hypertrophy. Ideal hypertrophy refers to a condition where the ventricular muscle increases its volume without any alteration in the activation sequence, and the strength of the double layer and the velocity of the activation wave are the same as nor-mal. In other words, the electrical properties of hypertro-phied myocardium are the same as those of healthy tissue. It follows that the current hypothesis has 2 implica-tions and therefore is valid only if the following 2 condiimplica-tions are true: no difference exists between the electrical proper-ties of hypertrophied and healthy myocardium; the electri-cal properties of hypertrophied myocardium do not change during the evolution and progress of LVH.
Experimental and clinical cardiology provide enough evidence that these 2 conditions are not true. First, the pa-thologically changed myocardium in LVH differs from the healthy one at molecular, subcellular, cellular, and tissue levels. Structurally altered myocardium inevitably changes the conductivity properties of the tissue. Roberts et al 30
showed that the wave of activation is not uniform in its rate of spread or its density. Recently, these changes have been extensively studied especially in relation to arrhythmogene-sis. Disease- (and arrhythmia-) induced changes in cardiac electrical properties are referred to as electrophysiological remodeling 31,32. So, an interesting dissociation in clinical
thinking can be observed. In relation to arrhythmogenesis, both interrelated anatomical and electrogenic changes in LVH are taken into account, and the changes in electroge-nesis are considered a substrate for re-entry circuits, whe-reas in the case of voltage criteria, we still think only in terms of anatomical changes.
Second, anatomical and related electrophysiological remodeling depends on the evolution and progress of LVH. As mentioned before, 3 distinct stages of experimental LVH have been described, with characteristic biochemical, sub-cellular, sub-cellular, tissue, and functional changes 4,5: The first
stage represents the period of adaptation and the rebuilding of myocardium to achieve adequate performance, the second stage is defined as compensated hypertrophy, and during the third stage a gradual development of heart failure and degradation of myocardium occur. However, we are estimating only the linear correlation between left ventricu-lar mass and QRS amplitude.
In summary, evidence indicates that the hypertrophied myocardium is pathologically changed and that these chan-ges develop/change over the time.
Mashima 29 pointed out that discrepancies in actual
cases indicate deviations from the ideal state. Till now, discre-pancies have been attributed mainly to extracardiac factors that influence physiological variability, such as age, gender, race, anthropometric variables, intracavitary blood volume, conductivity properties of intrathoracic organs, location of the heart within the thorax, and other such things 33.
Howe-ver, even the most sophisticated ECG criteria, which combi-ne all known factors influencing interindividual variability, have nearly the same discriminative power 15. Or, the
devia-tions are attributed to the coincidence of pronounced car-diac pathology: ischemia, edema, and heart failure. But, the false-negative results are also seen in initial and mild hyper-trophy 34,35.
In summary, the gaps in our knowledge are related mostly to these deviations: what is the pathophysiological background for the deviations from “ideal” hypertrophy, ie, between the increased mass and QRS voltage lower than expected? How do these deviations change over time with the progress of LVH? How do they change with therapy? What is their diagnostic and prognostic meaning?
Critical appraisal of the application of the
solid angle theory
The solid angle theory defines in biophysical terms the magnitude of a potential detected at an extracellular site.
Part of the formula represents the spatial determinant of
1 0 6 1 0 6 1 0 6 1 0 6 1 0 6
And consequently, the gaps in knowledge arising in relation to the appraisal of the application of the solid angle theory are related to the nonspatial determinants: are the individual nonspatial determinants unchanged during the progress of LVH? Are they changed, but balanced with others, so that they look unchanged as a whole or at the ma-cro level? Are they unchanged with therapy?
Critical appraisal of the design of the studies
In the design of the studies, several sources of poten-tial biases can be identified related to: the selection of the gold standard; the criteria used for inclusion of the patients into control/normal and LVH groups, respectively; the ab-sence of the control of patients for therapy; the abab-sence of the control of patients for known extracardiac factors influ-encing the QRS amplitude; time difference between recor-ded ECG and the gold standard method of measurement.
The gold standard method should allow distinction between subjects with or without a certain pathology, in our case subjects with or without left ventricular hypertrophy. Currently, echocardiography is considered the optimal gold standard (“the nonelectrocardiographic independent me-thod”), mainly for its good estimation of LV dimensions and mass, documented by a close correlation with autopsy fin-dings 36,37. The fundamental gold standard is considered the
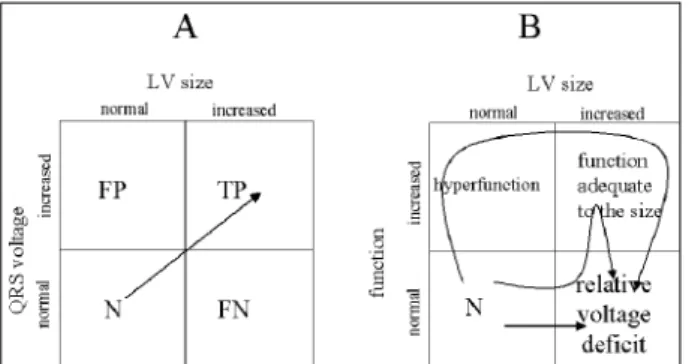
autopsy, where dimensions and mass can be directly mea-sured. The primary information of both methods is the infor-mation on size and mass, respectively, and so LVH diagnos-tics are often simplified at the detection of the increased mass/size. However, using only size as a measure of LVH could be misleading and a source of potential biases. Firs-tly, the increased mass/size is really a dominant characteris-tic, but only ONE of the characteristics of LVH, not the ONLY characteristic. Secondly, taking into account only the mass/size, pathological reasons for increased mass/size other than LVH and associated diseases can be overlooked. And on the other hand, the initial stages of LVH, when the mass does not exceed the arbitrary upper normal limit, can go unrecognized and therefore may be misclassified. And finally, ECG does not provide information on size or mass. It provides information on one of the functional characteris-tics of the heart – electrogenesis. Therefore, it would be more appropriate to use terms like normal function or ade-quate function in relation to the size, hypo- or hyperfunc-tion in relahyperfunc-tion to the size of LV (fig. 3). The endless calcula-tions of specificity and sensitivity, or derived receiver ope-rating characteristics curves, can only repeatedly confirm the well-known fact that the size of an organ and its func-tion are not necessarily proporfunc-tional.
The simplifications in considering LVH as only an increase in mass/size are reflected in some studies in the criteria used for inclusion of the patients into control/normal and LVH groups. For example, a variety of cardiovascular pathologies included both control and LVH groups38. An
unknown proportion of patients with mild hypertension is included in the normal control group, and the LVH group
contains an unknown proportion of “normotensive patien-ts” 39 are they healthy subjects or hypertensive patients on
therapy?
In most of the studies, the groups are not controlled for therapy. This study includes an unstated assumption that therapy has no influence on the recorded QRS voltage. Similarly, the groups are not controlled for known extra-cardiac factors influencing the physiological variability of QRS amplitude, such as age, sex, anthropometric characte-ristics, or race. Extracardiac factors were documented to in-fluence the QRS amplitude 40-43. But curiously, in the
inter-pretation they are mostly used to explain the lower amplitu-de, the false-negative results in LVH patients. However, they should influence both normal and LVH population in the same directions, if the studies are properly randomized. The time difference between recorded ECG and the gold standard method of measurement can be considerable, especially in studies using the autopsy as a reference me-thod. The reported intervals from the interpreted electrocar-diogram until death go up to 11 weeks 44, or are not precisely
defined 15,45. This study design means that no changes in
QRS amplitude are assumed over the time interval between the recordings of the 2 methods.
Sources of flaws in argumentation and
derived conclusions
The argumentation used in the ECG diagnostics of LVH is rather monotonous. It assumes that the “electrical dominance” of the left ventricle is enhanced in LVH. So it searches for the evidence–for increased QRS amplitude and only these results are considered TRUE. This effort is
1 0 7 1 0 7 1 0 7 1 0 7 1 0 7
theoretically supported by the partial application of the solid angle theory, where only spatial determinants are men-tioned. Findings with QRS amplitude within normal limits are false-negative. If the proportion of these false-negative results is “acceptable” or the tested criteria “significantly improve” their sensitivity, which could be really of low clini-cal relevance, the tested ECG criteria are recommended as suitable for ECG diagnostics of LVH. If the proportion of the false-negative results is not acceptable, and the proportion of the false-negative results was documented as high, up to 90%, it is concluded that ECG is of limited value for LVH diagnostics or even an obsolete method.
A few weak points can be identified in this sequence of reasoning. One of the possible flaws, the generalization, has already been mentioned. If the increased QRS amplitude is found in a proportion of patients, it does not necessarily mean that it is true for all patients. The majority of ECG findings in LVH are within normal limits, which implies regularity.
The application of the spatial angle theory is not com-plete, only partial, because only spatial determinants are mentioned. Nonspatial determinants are not considered, even when the changes in conductivity are explicitly discus-sed in relation to the prolongation of QRS duration in the same article, which can be seen in reports on the voltage-duration product 38. The negligence of nonspatial factors is
based on the findings of studies where no changes in the transmembrane action potentials in myocytes of chronically hypertrophied hearts were reported 46-48. Consequently, it has
been concluded that the geometry of the ventricle plays an important role in determining the increased voltage 23.
However, enough experimental and clinical evidence are available indicating that nonspatial determinants can chan-ge during the progression of LVH. The electrical properties of myocardium are extensively studied in relation to arrhythmogenesis. A great amount of accumulated know-ledge about the changes in active and passive electrical properties of myocardium in LVH, such as heterogenous changes in action potential duration and amplitude, loss or thickening of gap junctions, expression and distribution of connexin 43, intercellular coupling, changes in conduction
velocity, interactions between ionic currents and cardiac microstructure 49-57, which are sometimes referred to as
elec-trophysiological remodeling.
Experimental and clinical evidence exists that the uns-tated assumptions mentioned previously are not necessari-ly true. The electrical properties of myocardium, which can influence QRS amplitude, can change during the progres-sion of LVH, with therapy and over time and can counterba-lance the influence of the increased spatial angle.
And finally, the conclusion that ECG is of limited value or even obsolete for LVH detection is not true. Based on the fact that ECG does not estimate mass, we come to the wrong conclusion that ECG is not suitable for LVH diagnostics. What could be more precisely concluded is the statement that ECG is not suitable for the estimation of size of the left ventricle. However, we know that the primary information given by electrocardiography is not the information about
size, but about electrical properties of the myocardium. So, we are back at the point of asking unanswerable question, and we are going around in circles.
Alternative conclusions
Based on the recognition of the unstated assump-tions, their re-evaluation, and on the effort to avoid possible flaws, we have developed alternative conclusions:
Because the increased amplitude of the QRS complex is recorded only in a smaller proportion of patients with anatomical LVH, the dominant proportion of patients with anatomical LVH deviates from this expected increase in QRS amplitude. In other words, their QRS amplitude is lower than that expected. These findings are not “false”, they are “true”, because they are the results of an objective diagnos-tic method, and in our previous works we called these devia-tions the “relative voltage deficit” 58,59. Taking into account
the difference between the expected voltage related to in-creased LVM and the actual recorded voltage, it would be appropriate to call this difference a “relative voltage deficit”. This term indicates that the recorded QRS voltage in a parti-cular patient with echocardiographically assessed LVH is lower than expected. And, contrary to the term “false-nega-tive”, which implicitly neglects the results of ECG evalua-tions by earmarking them as “false” it imposes the need for further diagnostic clarification.
This relative voltage deficit is conditioned by changes in nonspatial determinants, by changed active and passive electrical properties of the hypertrophied myocardium as compared to healthy tissue.
These changes are not linear during the progression of LVH. They are not proportional to the increase of LVM. In other words, the QRS amplitude does not follow the severity of LVH and the increase of LVM proportionally.
The relative voltage deficit can be enhanced by other associated cardiac pathologies and can be modified by therapy.
The recognition and quantification of the relative vol-tage deficit as a deviation from normal could have diagnostic and prognostic value and importance.
To quantify the relative voltage deficit, we used a new parameter: a ratio of QRS voltage to left ventricular size 60.
This ratio was called the specific potential of myocardium (SP). Using left ventricular size as a denominator, the volta-ge is indexed to a unit of myocardium and the influence of left ventricular size on the voltage magnitude is taken into account. In this manner, the relative voltages related to equal units of myocardium can be compared. The SP value can be understood as a potential contribution of one unit of myocardial tissue of the left ventricle to the total cardioelec-tric field. In terms of solid-angle theory, it can be considered a summary parameter of nonspatial determinants.
In our previous works, we found decreased values of SP in hypertensive patients as compared with those in heal-thy subjects 61. Decreased SP values were observed in
maxi-1 0 8 1 0 8 1 0 8 1 0 8 1 0 8
mum decrease was recorded during the first and the third stages of experimental LVH. The SP values did not reach the control values even in the second stage when the maximum increase in QRS amplitudes was observed. Similarly, decrea-sed SP values were found in spontaneously hypertensive rats in the period of the initial increase in blood pressure when compared with age- and sex-matched healthy Wistar-Kyoto rats 63.
The decision to apply the conclusions to
patients’ health care
ECG is an easily available and affordable method and provides a lot of information on the status of the heart. Howe-ver, the impact of increased QRS amplitude on clinical deci-sion making with respect to diagnostic classification, selec-tion of therapy and prognosis is surprisingly rather limited.
As already mentioned, only increased QRS amplitude in defined leads is considered a “positive” finding, ie, evi-dence of LVH, and only these findings are used for clinical decision making. The results within normal limits are consi-dered “negative” and are not taken into account. When confronted with the gold standard, for example with echo-cardiography, both positive and negative ECG results are, in cases of discrepancies between these 2 methods, conside-red “false”, in other words “wrong”.
Electrocardiographically detected LVH has been shown to be a strong independent predictor of cardiac mor-bidity and mortality both in patients with essential hyper-tension and in the general population, as well as in normo-tensive adults 24,64,65.
In hypertensive patients, the ECG signs of LVH are considered an indicator of target organ damage and are used for further diagnostic decision making. The WHO clas-sification 66 of the severity of hypertension uses the
presen-ce or absenpresen-ce of electrocardiographic LVH as a criterion for differentiating between stages 1 and 2 of established hy-pertension, even in cases where no signs of LVH are present on the echocardiogram. Similarly, it is included in the risk stra-tification of hypertensive patients recommended by JNC VI 67.
The practical consequence for an individual patient is the recommendation to begin the pharmacotherapy without waiting for the effect of nonpharmacological intervention. However, the finding of an increased QRS voltage has no impact on the selection of therapy.
In spite of the evidence, the importance of the ECG signs in patients with mild to moderate essential hyperten-sion is marginalized because of the low incidence and low sensitivity of ECG findings 34,35,68,69. In the general
popula-tion, ECG signs of LVH are rarely seen in calculations of risk scores in health promotion programs.
The so-called false-negative results, ie, those with increased LVM and ECG amplitude within normal limits, are not considered for further diagnostic or prognostic deci-sion making and have no impact on the choice of therapy. However, these false-negative findings prevail. Hearts with hypertrophied left ventricles but without the expected
pro-portional increase in QRS amplitude are frequent findings in clinical practice, and the high number of false-negative results indicates the need for assessing the diagnostic and prognostic significance of this phenomenon.
In summary, the following gaps in knowledge can be identified with respect to the application of the increased QRS amplitude for diagnostic decision making as regards the individual patient: what are the diagnostic meaning and the consequence of further diagnostic procedures in cases of an isolated increase in QRS amplitude in an eventually healthy population, or in combination with cardiac patholo-gies other than hypertension? What is the consequence of an isolated increase in QRS amplitude for the selection of therapy and monitoring its effect on hypertension and other cardiac pathologies? What are the diagnostic mea-ning and the consequences of further diagnostic procedu-res for finding the discrepancy–increased LVM and low voltage of the relative voltage deficit? What is the conse-quence of finding the relative voltage deficit for the selec-tion of therapy and monitoring the effect of therapy? Is the prognostic and diagnostic meaning of the voltage deficit different from the so-called true-positive results, where ECG and echocardiographic findings are in agreement?
Conclusion
The current ECG diagnostics of LVH based on voltage criteria aim to estimate LVM. Its underlying hypothesis in-cludes unstated assumptions about the nonspatial deter-minants of QRS voltage: First, the electrical properties of hy-pertrophied myocardium do not differ from that in healthy ones, and second, they do not change during the develop-ment and progression of LVH. Because these 2 conditions are not true, the performance of the voltage criteria is limited. The re-evaluation of the hypothesis is based on a con-tingency approach, and considers also findings of relatively lower (‘normal’) QRS voltage in hypertrophied left ventri-cles: so-called false-negative results, as a result of the rela-tive voltage deficit due to complex changes in the electrical properties of hypertrophied myocardium. Hypertrophied left ventricles with relative voltage deficits, and changes in the relative voltage deficit over time or with treatment, seem to have diagnostic and prognostic importance.
false-1 0 9 1 0 9 1 0 9 1 0 9 1 0 9
References
1. Mirvis DM. What’s wrong with electrocardiography? J Electrocardiol 1998; 31: 313-316.
2. Sackett DL, Rosenberg WMC, Gray JAM, Haynes RB, Richardson WS. Eviden-ce based medicine: what is and what it isn’t. Br Med J 1996; 312: 71 –2. 3. Warren S. Neoplasm. In: Anderson WAD (ed.). Pathology. St. Louis: The CV
Mosby Co., 1953: 423-48.
4. Meerson FZ. The myocardium in hyperfunction, hypertrophy and heart failure. Circ Res 1969; 25(Suppl. 2): 1-163.
5. Fizel A, Fizelova A, Turcany M. The relations between ultrastructural and meta-bolic changes of the myocardium of the hypertrophied and failing heart (Vztah medzi ultrasturkturalnymi a metabolickymi zmemani myokardu hypertrofova-neho a zlyhavajuceho srdca). Folia Fac Med Univ Comeniane Bratisl 1984; 22: 9-119.
6. Davies MJ. Gross morphology of cardiac hypertrophy. In: Sheridan DJ (ed.). Left Ventricular Hypertrophy. London: Churchill Livingstone, 1998: 17-22. 7. Sokolow M, Lyon TP. The ventricular complex in left ventricular hypertrophy as
obtained by unipolar precordial and limb leads. Am Heart J 1949; 37: 161-86. 8. Wolff L. Fundamentals and Clinical Applications. 3rd ed. Philadelphia: WB
Saunders, 1962.
9. Romhilt DW, Estes EH Jr. A point score system for the ECG diagnosis of left ven-tricular hypertrophy. Am Heart J 1968; 75: 752-8.
10. Casale PN, Devereux RB, Kligfield P, et al. Electrocardiographic detection of left ventricular hypertrophy: development and prospective validation of improved criteria. J Am Coll Cardiol 1985; 6: 572-80.
11. Arnsdorf MF. Electrophysiology of the heart. Electrocardiography: Fundamen-tal Theory. Part 1. American Physiological Society, 1978: 1108.
12. Liu JE, Devereux RB. Clinical assessment of cardiac hypertrophy. In: Sheridan DJ, (ed). Left Ventricular Hypertrophy. London: Churchill Livingstone, 1998: 11-6. 13. Bayley RH. Biophysical Principles of Electrocardiography. New York: Paul B.
Hoeber, 1958.
14. Scher AM. Trends in electrocardiographic recording. In: Schlant RC, Hurst JW (eds). Advances in Electrocardiography. New York: Grune & Stratton, 1972: 1-8. 15. Reichek N, Devereux RB. Left ventricular hypertrophy: relationship of anatomic, echocardiographic and electrocardiographic findings. Circulation 1981; 63: 1391-8.
16. Einthoven W. Telecardiogramme. Arch Int Physiol 1906-1907; 4: 132-63. 17. Brody DA. The theoretical analysis of intracavitary blood mass influence on the
heart-lead relationship. Circ Res 1956; 4: 731-8.
18. Feldman T, Borow KM, Neumann A, Lang RM, Childers RW. Relation of electro-cardiographic R-wave amplitude to changes in left ventricular chamber size and position in normal subjects. Am J Cardiol 1985; 55: 1168-74.
19. Talbot S, Kilpatrick D, Jonathan A, Raphael MJ. QRS voltage of the electrocardio-gram and Frank vectorcardioelectrocardio-gram in relation to ventricular volume. Br Heart J 1977; 39: 1109-13.
20. Fuenmayor AJ, Vasquez CJ, Fuenmayor AM, Winterdaal DM, Rodriguez D. Hemodialysis changes the QRS amplitude in the electrocardiogram Int J Cardiol 1993; 41: 141-5.
21. Vancheri F, Barberi O. Relationship of QRS amplitude to left ventricular dimen-sions after acute blood volume reduction in normal subjects. Eur Heart J 1989; 10: 341-5.
22. Vitolo E, Madoi S, Palvarine M, et al. Relationship between changes in R wave
voltage and cardiac volumes. A vectorcardiographic study during hemodialy-sis. J Electrocardiol 1987; 20: 138-46.
23. Antman EM, Green LH, Grossman W. Physiologic determinants of the electro-cardiographic diagnosis of left ventricular hypertrophy. Circulation 1979; 69: 386-96.
24. Kannel WB, Gordon T, Castelli WP, Margolis JR. Electrocardiographic left ven-tricular hypertrophy and risk of coronary heart disease: The Framingham Study. Ann Intern Med 1970; 72: 813-22.
25. Okin PM, Roman MJ, Devereux RB, Kligfield P. Electrocardiographic identifi-cation of increased left ventricular mass by simple voltage-duration products. J Am Coll Cardiol 1995; 25: 417-23.
26. Romhilt DW, Bove KE, Norris RJ, et al. A critical appraisal of the electrocardio-graphic criteria for the diagnosis of left ventricular hypertrophy. Circulation 1969; 40: 185-95.
27. Kimura M, Matsushita S, Nakahara K, Miyakawa A, Kuramoto K. Evaluation of electrocardiographic criteria for left ventricular hypertrophy based on anatomi-cal comparison. J Electrocardiol 1987; 20: 369-74.
28. Timmis GC, Bakalyar DM, Gordon S. Accuracy of computerized electrocardiogra-phic identification of left ventricular hypertrophy as determined by echocardio-graphic measurements of left ventricular mass: Evaluation of a widely used com-puter program. J Am Coll Cardiol 1986; 8: 301-9.
29. Mashima S. Theoretical considerations on the electrocardiogram of ventricular hypertrophy. J Electrocardiol 1976; 9: 133-8.
30. Roberts DE, Hersh LT, Scher AM. Influence of cardiac fiber orientation on wave-front voltage, conduction velocity, and tissue resistivity in the dog. Circ Res 1979; 44: 701- 12.
31. Saffitz JE, Schuessler RB, Yamada KA. Mechanisms of remodelling of gap junc-tion distribujunc-tions and the development of anatomic substrates of arrhythmias. Cardiovasc Res 1999; 42: 309-17.
32. Natte S, Roden DM, Escande D. A spotlight on electrophysiological remodelling and the molecular biology of ion channels. Cardiovasc Res 1999; 42: 267-9. 33. Fisch CH. Electrocardiography and vectorcardiography. In: Braunwald E (ed).
Heart Disease. 4th ed. Philadelphia: WB Saunders, 1992: 116-61.
34. Savage DD, Drayer JIM, Henry WL, et al. Echocardiographic assessment of cardiac anatomy and function in hypertensive subjects. Circulation 1979; 59: 623-32. 35. Devereux RB, Casale PN, Wallerson DC, et al. Cost-effectiveness of
echocardiogra-phy and electrocardiograechocardiogra-phy for detection of left ventricular hypertroechocardiogra-phy in pa-tients with systemic hypertension. Hypertension 1987; 9(2):II69-76. 36. Devereux RB, Reichek N. Echocardiographic determination of left ventricular
mass in man: anatomic validation of the method. Circulation 1977; 55: 613-8. 37. Devereux RB, Alonso DR, Lutas EM, et al. Echocardiographic assessment of left
ventricular hypertrophy: comparison to necropsy findings. Am J Cardiol 1986; 57: 450-8.
38. Molloy TJ, Okin PM, Deverex RB, Kligfield P. Electrocardiographic detection of left ventricular hypertrophy by the simple QRS voltage-duration product. J Am Coll Cardiol 1992; 20: 1180-6.
39. Okin PM, Roman MJ, Devereux RB, Kligfield P. Electrocardiographic identifi-cation of increased left ventricular mass by simple voltage-duration products. J Am Coll Cardiol 1995; 25: 417-23.
40. Simonson E. Differentiation Between Normal and Abnormal in Electrocardiolo-gy. St. Louis: CV Mosby, 1961.
negative results, are neglected in diagnostics; the applica-tion of the theoretical background, the spatial angle theory, is only partial; gaps exist in our knowledge with respect to the clinical meaning and importance of findings, when the size and the electrical properties are not in accordance, to the still so-called false-negative and false-positive findin-gs. Furthermore, we do not know whether they differ in their clinical importance from those designated as true-positive; gaps exist in our knowledge with respect to the changes in the relationship between size and electrogenesis during the progression of LVH and with therapy.
The EBM approach has contributed to developing an alternative view of the possibilities of electrocardiography
in LVH diagnostics, and this is the main lesson we can learn from EBM. It has been shown that the EBM approach is a powerful tool for re-evaluation of old hypotheses in the context of the contemporary knowledge, a tool for genera-ting new ideas and directions for research. Perhaps, in the case of ECG, and not only for LVH, it may contribute to the identification of the role of ECG and to the added value of ECG in clinical diagnostics.
Acknowledgements
1 1 0 1 1 0 1 1 0 1 1 0 1 1 0
41. Pipberger HV, Goldman MJ, Littmann, et al. Correlation of the orthogonal elec-trocardiogram and vectorcardiogram with constitutional variables in 518 nor-mal men. Circulation 1967; 35: 536-51.
42. Ishikawa K. Correlation coefficients for electrocardiographic and constitutional variables. Am Heart J 1976; 92: 152-61.
43. Rautaharju PM, LaCroix AZ, Savage DD, et al. Electrocardiographic estimate of left ventricular mass versus radiographic cardiac size and the risk of cardiovas-cular disease mortality in the epidemiological follow-up study of the first Natio-nal Health and Nutrition Examination Survey. Am J Cardiol 1988; 62: 59-66. 44. Odom II H, Davis JL, Dinh HA, et al. QRS voltage measurements in autopsied
men free of cardiopulmonary disease: A basis for evaluating total QRS voltage as an index of left ventricular hypertrophy. Am J Cardiol 1986; 58: 801-4. 45. Murphy ML, Thenabadu N, Blue LR, et al. Descriptive characteristics of the
elec-trocardiogram from autopsied men free of cardiopulmonary disease – a basis for evaluating criteria for ventricular hypertrophy. Am J Cardiol 1983; 52: 1275-80. 46. Uhley HN. Study of the transmembrane action potential, electrogram, electrocar-diogram and vectorcarelectrocar-diogram of rats with left ventricular hypertrophy. Am J Cardiol 1961; 7: 211-7.
47. Kaufmann RL, Homburger H, Wirth H. Disorder in excitation-contraction cou-pling of cardiac muscle from cats with experimentally produced right ventricular hypertrophy. Circ Res 1971; 28: 346-57.
48. Basset AL, Gelband H. Chronic partial occlusion of the pulmonary artery in cats. Change in ventricular action potential configuration during early hypertro-phy Circ Res 1973; 32: 15-26.
49. Fry CH, Carey P, Mundy AR, Sheridan DJ. Altered conduction in left ventricular hypertrophy. In: Sheridan J. (ed.). Left Ventricular Hypertrophy. London: Chur-chill Livingstone, 1998: 113-20.
50. Toyoshima H, Park Y-D, Ishikawa , et al. Effect of ventricular hypertrophy on conduction velocity of activation front in the ventricular myocardium. Am J Car-diol 1982; 49: 1938-45.
51. Winterton SJ, Turner MA, O’Gorman DJ, Flores NA, Sheridan DJ. Hypertrophy causes delayed conduction in human and guinea pig myocardium: accentuation during ischaemic perfusion. Cardiovasc Res 1994; 23: 47-54.
52. Cooklin M, Wallis WRJ, Sheridan DJ, Fry CH. Changes in cell-to-cell electrical coupling associated with left ventricular hypertrophy. Circ Res 1997; 80: 765-71. 53. McIntyre H, Fry CH. Abnormal action potential propagation in isolated human hypertrophied left ventricular myocardium. J Cardiovasc Electrophysiol 1997; 8: 887-94.
54. Carey PA, Cooklin M, Sheridan DJ, Fry CH. Estimation of gap-junction resistance in hypertrophied and hypoxic guinea pig myocardium. J Physiol 1997; 504: 96-7. 55. Peters NS, Green CR, Poole-Wilson PA, Severs NJ. Reduced content of conne-xin43 gap junctions in ventricular myocardium from hypertrophied and ischae-mic human hearts. Circulation 1993; 88: 864-75.
56. Goldfine SM, Walcott B, Brink PR, Magid NM, Borer JS. Myocardial
conne-xin43 expression in left ventricular hypertrophy resulting from aortic regurgita-tion. Cardiovasc Pathol 1999; 8: 1-6.
57. Yamamoto S, James TN, Sawada K-I, Okabe M, Kawamura K. Generation of new intercellular junctions between cardiocytes. A possible mechanism compensa-ting for mechanical overload in the hypertrophied human adult myocardium. Circ Res 1996; 78: 362-70.
58. Bacharova L. Effect of left ventricular hypertrophy on the cardiac electrical field: The concept of the specific potential of myocardium. Exp Clin Cardiol 1998; 3: 128-33. 59. Bacharova L, Kyselovic J. Electrocardiographic diagnosis of left ventricular hypertrophy: Is the method obsolete or should the hypothesis be reconsidered? Med Hypotheses 57; 2001: 487-90.
60. Bacharova L. Reasoning for introducing a new parameter for assessment of myo-cardial status – the specific potential of myocardium. In: Cohen ME, Hudson DL, (eds.). Comparative Approaches to Medical Reasoning. Singapore: World Scientific Publ Co., 1995: 217-41.
61. Bacharova L, Melotova J, Sedlakova K. The ‘specific potential’ as a parameter of myocardial changes in left ventricular hypertrophy. In: Abel H. (ed.). Electrocar-diology ’88. Amsterdam: Excerpta Medica; 1989: 195-8.
62. Bacharova L, Bernadic M, Fizelova A. Electrocardiographic manifestation of experimental left ventricular hypertrophy. In: Jagielski J, Gornicki M. (eds.). Electrocardiology 91. Singapore: World Scientific, 1992: 29-32.
63. Bacharova L, Kyselovic J, Klimas J, Radman A. The decrease of specific potential of myocardium in early stage of experimental hypertension. In: Roshchevsky MP (ed.). Electrocardiology ’99. Syktyvkar: Institute of Physiology of the Komi Science Centre, 2000: 30-7.
64. Rautaharju PM, LaCroix A, Savage D, et al. Electrocardiographic estimate of left ventricular mass versus radiographic cardiac size and the risk of cardiovascular disease mortality in the epidemiologic follow-up study of the First National Health and Nutrition Examination Study. Am J Cardiol 1988; 62: 59-66. 65. Brown DW, Giles WH, Croft JB. Left ventricular hypertrophy as a predictor of
coronary heart disease mortality and the effect of hypertension. Am Heart J 2000; 14: 848-56.
66. World Health Organization Expert Committee: Arterial hypertension. Geneva: World Health Organization; 1978; 8-10.
67. The Sixth Report of the Joint National Committee on Prevention, Detection, Eva-luation, and Treatment of High Blood Pressure. Arch Intern Med 1997; 157: 2413-52.
68. Levy D, Labib SB, Anderson KM, Christiansen JC, Kannel WB, Castelli WP. Determinants of sensitivity and specificity of electrocardiographic criteria for left ventricular hypertrophy. Circulation 1990; 81: 815-20.