466
DOI:
10.1590/0004-282X20150021
IMAGES IN NEUROLOGY
Association of optic atrophy and type 1
diabetes: clinical hallmarks for the diagnosis
of Wolfram syndrome
Associação de atrofia óptica e diabetes tipo 1: marcadores clínicos para o diagnóstico da
síndrome de Wolfram
José Luiz Pedroso
1, Leandro Tavares Lucato
2,3, Fernando Kok
4, Juliana Sallum
5, Orlando G. P. Barsottini
1,
Acary Souza Bulle Oliveira
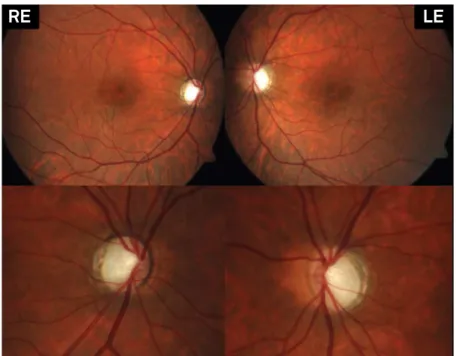
1A 25-year-old woman presented with a 3-year history
of progressive visual loss. She had type 1 diabetes mellitus
(DM1) since 18-year-old. Fundoscopy showed atrophic
op-tic discs (Figure 1). MRI disclosed bilateral opop-tic nerve
atro-phy (Figure 2). Optic coherence temograatro-phy demonstrated
disease progression (Figure 3). Exome sequencing disclosed
two deleterious mutations in
WFS
gene [the novel variant
c.1228_1231delCTCT (p.Leu410Leufs*31) and the already
reported mutation
1c.472 G>A (p.Glu158Lys)], conirming
Wolfram syndrome (WFS). Full consent was obtained from
the patient for the case publication
WFS is a rare autosomal recessive disease characterized
by DM1, optic atrophy, deafness, and diabetes insipidus
2,3.
he coexistence of DM1 and optic atrophy suggest WFS but
molecular conirmation is mandatory
4. Besides optic atrophy,
MRI indings in WFS may include hyperintense signal in pons
and in optic tracts, brainstem atrophy and absence of
neuro-hypophyseal “bright signal”
5.
1Universidade Federal de São Paulo, Departamento de Neurologia, Sao Paulo SP, Brazil;
2Universidade de São Paulo, Faculdade de Medicina, Hospital das Clínicas, Departamento de Neuroradiologia, Sao Paulo SP, Brazil; 3Centro de Diagnósticos Brasil, Sao Paulo SP, Brazil;
4Mendelics Análises Genômicas, Sao Paulo SP, Brazil;
5Universidade Federal de São Paulo, Departamento de Oftalmologia, Sao Paulo SP, Brazil.
Correspondence: José Luiz Pedro; Avenida Onze de Junho, 582 / ap. 131; 04041-002 São Paulo SP, Brasil; E-mail: [email protected]
Conflict of interests: There is no conflict of interest to declare.
Received 20 November 2014; Received in final form 02 January 2015; Accepted 22 January 2015.
Figure 1. Fundus image discloses marked bilateral atrophic optic discs with temporal pallor.
467
José Luiz Pedroso et al. Optic atrophy and DM1: Wolfram syndrome
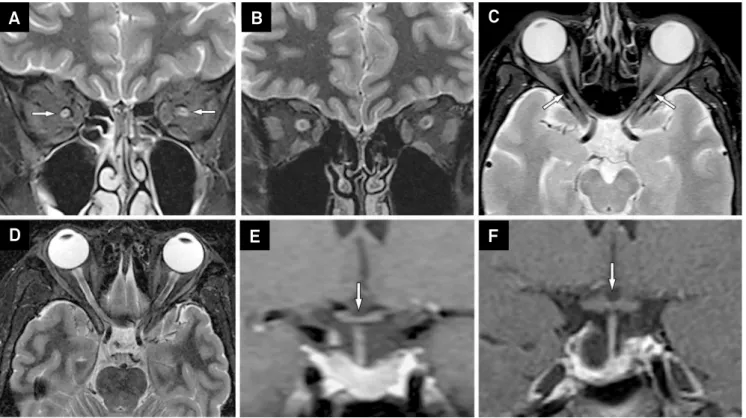
Figure 2. MRI of Wolfram patient (A, C, E) compared with an age-matched healthy subject (B, D, F). Coronal T2-weighted image
using fat saturation (A) demonstrates striking hypoplasia of both optic nerves in the orbits (arrows); note the normal appearance
in the healthy subject (B). The same sequence in the axial plane shows the same finding in the patient (C - arrows), compared to
the normal aspect (D). Optic chiasm is also hypoplastic in Wolfram patient, demonstrated in a coronal post-contrast T1-weighted
image (E - arrow), while a normal optic chiasm is appreciated in the healthy subject (F - arrow).
A
C
E
B
D
F
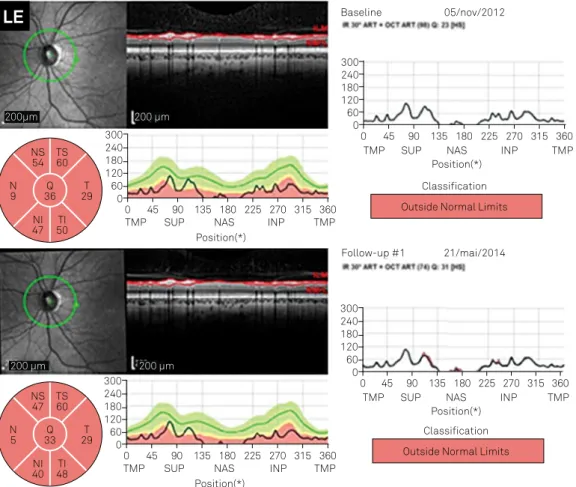
Figure 3. Optic coherence tomography measure around the disc showing thin retina, mainly thin nerve fiber layer performed at two
dates (Nov 05th 2012 and May 21st 2014). Comparing both exams one can see progressive decrease on the retina thickness (Continua).
0
TMP NAS Position(*) Baseline 05/nov/2012
Classification
INP TMP
SUP 300
240 180 120 60 0
45 90 135 180 225 270 315 360
0
TMP NAS
Position(*)
INP TMP
SUP 300
240 180 120 60 0
45 90 135 180 225 270 315 360
Outside Normal Limits TO
64
T
34 42Q 20N NS 56
TI 70 41NI
200 µm 200µm
0
TMP NAS
Position(*) Follow-up #1 21/mai/2014
Classification
INP TMP
SUP 300
240 180 120 60 0
45 90 135 180 225 270 315 360
0
TMP NAS
Position(*)
INP TMP
SUP 300
240 180 120 60 0
45 90 135 180 225 270 315 360
Outside Normal Limits TS
60
T
33 40Q 20N NS 56
TI 64 36NI
200 µm 200 µm
468
Arq Neuropsiquiatr 2015;73(5):466-468Figure 3. (Continuação) Optic coherence tomography measure around the disc showing thin retina, mainly thin nerve iber layer performed
at two dates (Nov 05th 2012 and May 21st 2014). Comparing both exams one can see progressive decrease on the retina thickness.
0
TMP NAS
Position(*)
Baseline 05/nov/2012
Classification
INP TMP
SUP 300
240 180 120 60 0
45 90 135 180 225 270 315 360
0
TMP NAS
Position(*)
INP TMP
SUP 300
240 180 120 60 0
45 90 135 180 225 270 315 360 Outside Normal Limits NS
54
N
9 36Q 29T
TS 60
NI 47 50TI
200 µm 200µm
0
TMP NAS
Position(*) Follow-up #1 21/mai/2014
Classification
INP TMP
SUP 300
240 180 120 60 0
45 90 135 180 225 270 315 360
0
TMP NAS
Position(*)
INP TMP
SUP 300
240 180 120 60 0
45 90 135 180 225 270 315 360 Outside Normal Limits NS
47
N
5 33Q 29T
TS 60
NI 40 48TI
200 µm 200 µm
LE
References
1. Gasparin MR, Crispim F, Paula SL, Freire MBS, Dalbosco IS, Manna TD et al. Identiication of novel mutations of the WFS1 gene in Brazilian patients with Wolfram syndrome. Eur J Endocrinol. 2009;160(2):309-16. http://dx.doi.org/ 10.1530/EJE-08-0698
2. Marshall BA, Permutt MA, Paciorkowski AR, Hoekel J, Karzon R, Wasson J et al. Phenotypic characteristics of early Wolfram syndrome. Orphanet J Rare Dis. 2013;8:64. http://dx.doi.org/10.1186/1750-1172-8-64
3. Zmysłowska A, Borowiec M, Fendler W, Jarosz-Chobot P, Myśliwiec M, Szadkowska A et al. The prevalence of Wolfram syndrome
in a paediatric population with diabetes. Endokrynol Pol. 2014;65(4):295-7. http://dx.doi.org/10.5603/EP.2014.0040
4. Zmyslowska A, Borowiec M, Fichna P, et al. Delayed recognition of Wolfram syndrome frequently misdiagnosed as type 1 diabetes with early chronic complications. Exp Clin Endocrinol Diabetes. 2014;122(1):35-8. http://dx.doi.org/10.1055/s-0033-1357160