DOI: 10.1590/0004-282X20150035
ARTICLE
Coherence of brain electrical activity: a quality
of life indicator in Alzheimer’s disease?
Coerência da atividade elétrica cerebral: indicador da qualidade de vida na doença de
Alzheimer?
Lineu Corrêa Fonseca1, Gloria M. A. S. Tedrus1, Ana Laura R. A. Rezende2, Heitor F. Giordano2
Alzheimer’s disease (AD), a chronic and progressive dis-ease, is the most common neurodegenerative illness in old-er people, and its prevalence is increasing because of highold-er life expectancy. AD causes cognitive and behavioral decline, compromising the ability of an individual to carry out activi-ties of daily living and to work, and thereby has major psycho-social and quality of life (QOL) repercussions.
he clinical manifestations of Parkinson’s disease (PD) are
essentially motor, but cognitive and behavioral disturbances also occur, characterizing dementia in approximately 30% of the cases1,2.
Today the most common and well-known deinition of QOL is that of the World Health Organization (WHO), which deines
it as an individual’s perception of his position in life in the con-text of the culture and value systems in which he lives and in relation to his goals, expectations, standards, and concerns3.
In people with dementia, QOL is not an isolated concept among many measurements but the main objective of profes-sional care4.
Logsdon et al.5 used the Quality of Life-Alzheimer’s
dis-ease (QOL-AD) psychometric analysis in a large sample of AD patients and their caregivers and found that is possible for pa-tients with a Mini-Mental State Examination (MMSE) score greater than 10 to reliably and validly rate their own QOL. QOL assessment has been used by studies on the care and treatment of AD patients6,7.
1Pontifícia Universidade Católica de Campinas, Faculdade de Medicina, Disciplina de Neurologia, Campinas SP, Brazil; 2Pontifícia Universidade Católica de Campinas, Campinas SP, Brazil.
Correspondence: Lineu Corrêa Fonseca; Pontifícia Universidade Católica de Campinas, Faculdade de Medicina, Disciplina de Neurologia; Rua Sebastião de Souza, 205 - cj. 122; 13013-910 Campinas SP, Brasil; E-mail: lineu.fonseca@uol.com.br
Conflict of interest: There is no conlict of interest to declare.
Received 11 October 2014; Received in inal form 20 December 2014; Accepted 08 January 2015.
ABSTRACT
Objective: To investigate the relationships between quality of life (QOL) and clinical and electroencephalogram (EEG) aspects in patients with Alzheimer’s disease (AD). Method: Twenty-eight patients with mild or moderate AD, 31 with Parkinson’s disease (PD), and 27 normal controls (NC) were submitted to: CERAD neuropsychological battery, Hamilton Depression and Anxiety Rating Scales, Functional Activities Questionnaire, QOL scale for patients with AD, and quantitative EEG measures. Results: AD and PD patients had similar QOL (31.0 ± 5.8; 31.7 ± 4.8, respectively), worse than that of NC (37.5 ± 6.3). AD patients had lower global interhemispheric theta coherence (0.49 ± 0.04; 0.52 ± 0.05; 0.52 ± 0.05; respectively) than PD and NC. Multiple linear regression for QOL of AD patients revealed that global interhemi-spheric theta coherence, and Hamilton depression scores were signiicant factors (coeficients; 58.2 and -0.27, respectively; R2, 0.377).
Conclusion: Interhemispheric coherence correlates with QOL regardless of cognitive and functional variables and seems to be a neuro-physiological indicator of QOL in AD patients.
Keywords: Alzheimer’s disease, EEG, quality of life, Parkinson’s disease.
RESUMO
Objetivo: Investigar relações entre qualidade de vida (QV) e aspectos clínico-eletrencefalográicos (EEG) em pacientes com doença de Alzheimer (DA). Método: Vinte e oito pacientes com DA, 31 com doença de Parkinson (DP) e 27 controles normais (CN) foram submetidos a avaliações neurocognitivas, escala de depressão de Hamilton e de qualidade de vida para pacientes com DA, questionário de atividades funcionais e medidas do EEG. Resultados: A QV foi similar nos grupos DA e DP (31,0 ± 5,8; 31,7 ± 4,8, respectivamente), mas inferior ao CN (37,5 ± 6,3). No grupo DA houve menor coerência inter-hemisférica global teta (CIGT) do que em DP e CN (p < 0,05). Regressão múltipla linear para QV no grupo DA revelou a CIGT e a escala de Hamilton como fatores signiicativos (coeicientes; 58,2; -0,27, respectivamente; R2, 0,377).
Conclusão: A CIGT correlaciona-se com a QV independentemente de variáveis cognitivas e funcionais e parece ser um indicador neuroi-sológico da QV em pacientes com DA.
By assessing electrical brain activity, electroencephalo-grams (EEG) have many clinical applications, are inexpen-sive and risk-free, and many quantitative (qEEG) analyses be-came possible after the development of digital EEG. Some of
these analyses include analysis of absolute power in diferent
frequency bands of brain rhythms and analysis of coherence. Analysis of absolute power reveals the increases in theta and delta activities and decreases in alpha and beta powers that occur in AD patients8, and analysis of coherence shows
the temporal relationships between diferent regions, that is,
it measures functional connectivity between regions9. In
pa-tients with mild cognitive impairment or AD/PD dementia,
absolute power and coherence measurements correlate
sig-niicantly with performance in neuropsychological tests10,11.
Resting state with eyes closed qEEG may show the degen-erative changes caused by AD and is considered a noninva-sive method for diagnosing and assessing dementia6.
Depression and changes in the MMSE and Instrumental Activities of Daily Living are important factors associated with QOL in AD patients7,12. However, knowledge about QOL
factors in AD is limited. Linear regression analysis assessing these factors has shown that the self-rating QOL model ex-plains less than 50% of the variance4,7.
his study hypothesizes that qEEG variables can contribute
to the neurophysiological basics of AD and better characterize
QOL-related factors. here are no such studies in the literature. he objective of this study was to investigate possible
relationships between QOL and qEEG analyses of absolute power and coherence in AD patients and compare them with
those of PD patients and normal controls.
METHOD
Subjects
his study included a group of AD patients and two con
-trol groups, one with Parkinson’s disease patients and another
with individuals without neurological or psychiatric changes: (1) Group with AD included 28 patients that meet the
DSM IV (American Psychiatric Association, 1994)13 criteria
for dementia and the NINCDS/ADRDA criteria for probable AD14. he exclusion criteria were scoring less than eleven in the
MMSE, indicative of severe dementia, taking antipsychotics,
and having comorbidities that reduce life expectancy signii -cantly. Twelve patients were on acetylcholinesterase inhibitors
and four were on antidepressants. hey were all living at home;
(2) Group with PD included 31 patients with clinical di
-agnosis of probable PD according to the criteria provided by
Calne et al.15. All patients were on L-dopa and were evaluated
in the on phase;
(3) Normal control (NC) group included 27 individuals without any history of cognitive decline or previous neuro-logical or psychiatric disorder, matched with the AD group for gender distribution, age, and education level.
All study participants were recruited at the outpa-tient clinics of the Hospital e Maternidade Celso Pierro of
PUC-Campinas and had a closely related informant available.
Procedures
he patients and controls were submitted to the follow
-ing procedures: clinical-neurological assessment; CERAD
neuropsychological battery (Consortium to establish a
regis-try for Alzheimer’s Disease); Pfefer functional activities ques
-tionnaire; Neuropsychiatric Inventory; Hamilton Depression
Rating Scale (HDRS)16; Clinical Dementia Rating – CDR; ex
-ecutive function tests, Quality of life scale in Alzheimer’s dis-ease (QOL-AD), and qEEG.
he Neuropsychiatric Inventory assesses 10 behavioral
disturbances present in patients with dementia: delusions, hallucinations, dysphoria, anxiety, agitation/aggression, eu-phoria, disinhibition, irritability/lability, apathy, and aberrant
motor activity. he score of each item is given by multiplying
the frequency (range 1-4) by the severity (range 1-3), and the total score is given by adding the individual item scores.
he Pfefer functional activities questionnaire investi -gates the patients’ ability to carry out activities of daily living.
he score relects the severity of disability in each activity. Scores higher than ive indicate functional impairment. he
instrument has been validated for the Brazilian population17.
QOL was assessed by the patient’s version of the QOL scale for Alzheimer’s disease developed by Logsdon et al.5,
adapted and validated for the Brazilian population18. he
scale, structured with simple language and straightforward
answers, was designed to minimize the efects of the cog
-nitive decline in AD. he patients answered the questions
during an interview, answering thirteen 4-point Likert-type
questions (1 = poor and 4 = excellent). he total score ranges
from 13 to 52. Although QOL-AD may also be administered to caregivers, this study administered the instrument only to patients (QOL self-ratings) to investigate their perception and related it directly to the qEEG.
Brain computed tomography or magnetic resonance imaging and laboratory testing were also carried out on the patients to rule out other causes of dementia and
symp-tomatic Parkinsonism.
Electroencephalogram
The EEG procedures were the same as those used previously in another study19 that addressed other
ques-tions, had distinct purposes, and made other original sci-entific contributions.
he EEG was recorded with a resolution of 12 bits, 0.5-35 Hz ilters and 200 samples per second, using the
Braintech 3.0 equipment (EMSA), with impedance
main-tained below 10 kΩ. he exam was carried out with the pa -tients lying on their backs, in a silent environment with low
intensity lighting. he electrodes were placed according to
two electrodes placed 1 cm below (left side) and above (right side) the external angle of the eyelid, with the objective of
evaluating eye movements. he data referring to the elec -trodes Fp1, Fp2, F8, and F7 were not computed due to fre-quent contamination by artifacts related to eye movements.
he inter-connected ear lobe electrodes served as the refer
-ence. he data were recorded during approximately 12 min -utes, alternating resting periods with eyes closed with alert periods when the eyes were open, each period lasting 2
min-utes. he individual was stimulated to remain awake when
symptoms of somnolence appeared. Stretches of somnolence or sleep were excluded from the quantitative analysis.
About 25 epochs were selected for the quantita-tive EEG while alert and resting (eyes closed), each last-ing 2.56 s. Epochs with more than 100 µV on the elec-tro-oculogram were excluded from the means. After applying the Fast Fourier Transform, the absolute pow-ers (microvolts2/Hz) of 17 electrodes were studied (Fp2,
Fp1 and Oz were not included) in the following frequency bands: delta (0.8 to 3.9 Hz), theta (4.29 to 7.8 Hz), alpha (8.2 to 12.5 Hz) and beta (12.9 till 36.3 Hz). To obtain a normal distribution, the values for absolute power were substituted by their logarithms.
he absolute power averages were calculated for all the
electrodes together (global averages).
To analyze for coherence, this was deined as:
Cohxy( f) = [Rxy (f)]2 = [Gxy (f)] 2
Gxx(f) Gyy(f)
Where Gxy(f) denotes the spectral density of the cross-power and Gxx(f) and Gyy(f) are the respective spectral
den-sities of the power. he interhemispheric coherences be -tween the following pairs of homologue electrodes were
calculated: frontal left-right (F3-F4); mid temporal left-right (T3-T4) and occipital left-right (O1-O2). he global averag
-es for interhemispheric coherence were also calculated. he
frontal-occipital (F4-O2, F3-O1) average coherence was mea-sure for the intrahemispheric delta, theta, alpha and beta band coherences.
Individuals in the NC group underwent anamnesis, neu-rological examination, neurocognitive and behavioral assess-ments, and qEEG.
Data analysis
he continuous variables were expressed as mean and
standard deviation (SD), and the categorical variables were
expressed as frequencies (%). he student’s t-test, analysis of variance (ANOVA), and Pearson Chi-squared test were used to
compare the continuous variables and categorical variables. Multiple regression were used to determine the relation-ship between predictor variables and continuous outcome variables (dependent variables) using variables with p < 0.10 in the respective prior correlation analyses (independent
variables). he data were treated by the software Statistical Package for the Social Sciences (SPSS), version 22. he signii -cance level was set at 5%.
he software IBM SPSS 20.0 determined how QOL-AD
scores associated with the study cognitive and behavioral variables, and analyzed qEEG absolute power and
coher-ence in the Groups AD, PD, and NC at a signiicance level
of 5% (p < 0.05).
he efect size was measured by calculating Cohen’s f 2
within a multiple regression model20.
Approval by the Research Ethics Committee
he project was approved by PUC-Campinas’ Research
Ethics Committee under protocol number no. 0433/11. Appropriate ethical safeguards and protocols have been fol-lowed including agreement of patients or their relatives.
RESULTS
Sociodemographic and clinical aspects
Table 1 shows the sociodemographic data and results of
the Mini-Mental State Examination, semantic verbal luen
-cy, Neuropsychiatric Inventory, Pfefer functional activities questionnaire, and QOL-AD of the AD, PD, and NC groups.
Table 1. Age, gender, education level, Mini-Mental State Examination, verbal luency, Pfeffer functional activities questionnaire, Neuropsychiatric Inventory, Hamilton Depression Scale and Quality of Life – Alzheimer’s Disease Patient’s Version (QOL-AD) for the Alzheimer’s disease (AD), Parkinson’s disease (PD), and normal control (NC) groups.
Subjects AD
(N = 28)
PD (N = 31)
NC (N = 27)
Comparison (AD x NC)
p-value (AD x PD)
Age (years) 77.1 (5.6) 68.8 (10.4) 74.0 (6.5) 0.063 0.000*
Male/Female 9/19 21/10 10/17 0.635 0.004**
Education level (years) 3.2 (2.4) 4.2 (3.2) 6.5 (4.5) 0.001* 0.214
Mini-Mental State Examination 15.8 (3.9) 24.0 (4.7) 26.8 (2.0) 0.000* 0.000*
Verbal luency 5.8 (3.4) 10.7 (4.6) 14.4 (3.9) 0.000* 0.000*
Pfeffer questionnaire 18.4 (9.5) 4.6 (7.2) 0.5 (1.5) 0.000* 0.000*
Neuropsychiatric Inventory 19.0 (15.6) 14.2 (13.6) 2.9 (5.7) 0.000* 0.839
Hamilton Depression Scale 12.8 (7.3) 10.1 (7.9) 4.6 (4.3) 0.000* 0.171
QOL-AD 31.0 (5.8) 31.7 (4.8) 37.5 (6.3) 0.000* 0.673
he ages and gender distribution of the AD and NC groups did not difer signiicantly. However, the education level of the AD group was signiicantly lower than that of the
NC (t-test, p < 0.05).
he AD group performed worse in the MMSE and verbal luency test than the PD and NC groups (t-test, p < 0.05).
he AD group scored higher in the functional activities questionnaire than the PD and NC groups. However, the AD and PD groups scored similarly in the Hamilton Depression Scale and Neuropsychiatric Inventory; their scores were
higher than those of the NC group (t-test, p < 0.05).
he NC group had higher QOL-AD scores than the AD and PD groups. he scores of the latter two were similar
(t-test, p < 0.05).
Qualitative electroencephalogram
Comparative analysis of global absolute powers (delta, theta, alpha, and beta) showed that the theta band of the AD
group was higher than that of the NC but the diference was not signiicant (t-test, p = 0.079). he AD and PD theta bands did not difer (data not shown).
he delta, theta, alpha, and beta frontal-occipital (F4-O2, F3-O1) means of the AD, PD, and NC groups did not difer.
Table 2 shows that the mean global interhemispheric the-ta, alpha, and beta coherences of the AD group were smaller
than those of the PD and NC groups (t-test, p < 0.05).
Correlations between quality of life and qEEG
Pearson’s correlation coeicients between the QOL-AD
scale scores and the main cognitive, behavioral, and func-tional variables were calculated, as well as between the qEEG variables of the three groups (Table 3).
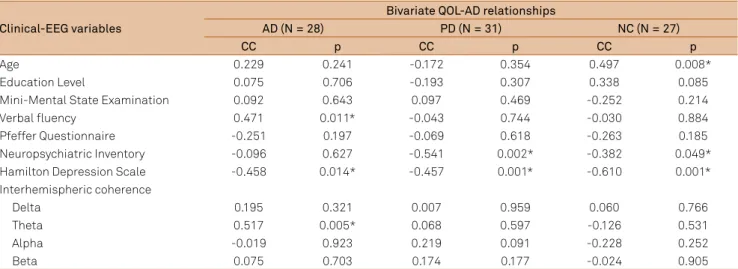
In the AD group, QOL-AD correlated positively with
se-mantic luency (CC = 0.472, p = 0.011). A signiicant negative
correlation between he QOL-AD of the three groups corre -lated negatively with their Hamilton scale scores (CC = 458,
p < 0.014). he QOL-AD of the PD and NC groups also corre -lated negatively with their Neuropsychiatric Inventory scores.
QOL-AD did not correlate signiicantly with the age, education
-al level, Mini-Ment-al State Examination, Pfefer Questionnaire,
and Neuropsychiatric Inventory of the three groups.
he QOL-AD of the AD group correlated positively with
their interhemispheric theta coherence (CC = 0.517, p = 0.005).
he qEEG and QOL-AD scores of the PD and NC groups
did not show correlation.
he multiple regression equation for the AD group showed that the signiicant factors for QOL-AD were inter -hemispheric theta global coherence and Hamilton depres-sion Scale score (p = 0.003) (Table 4). Age, education level,
verbal luency, Pfefer Questionnaire score, and other qEEG
measurements were excluded from the equation because
they were not signiicant. he Cohen’s f 2 index of 0.605 is
con-sidered of large efect.
Table 3. Pearson’s correlation coeficients (CC) between the total Quality of Life – Alzheimer’s disease (QOL-AD) scores and the clinical variables and qEEG of patients with Alzheimer’s disease (AD), Parkinson’s dsease (PD), and normal controls (NC) groups.
Clinical-EEG variables
Bivariate QOL-AD relationships
AD (N = 28) PD (N = 31) NC (N = 27)
CC p CC p CC p
Age 0.229 0.241 -0.172 0.354 0.497 0.008*
Education Level 0.075 0.706 -0.193 0.307 0.338 0.085
Mini-Mental State Examination 0.092 0.643 0.097 0.469 -0.252 0.214
Verbal luency 0.471 0.011* -0.043 0.744 -0.030 0.884
Pfeffer Questionnaire -0.251 0.197 -0.069 0.618 -0.263 0.185
Neuropsychiatric Inventory -0.096 0.627 -0.541 0.002* -0.382 0.049*
Hamilton Depression Scale -0.458 0.014* -0.457 0.001* -0.610 0.001*
Interhemispheric coherence
Delta 0.195 0.321 0.007 0.959 0.060 0.766
Theta 0.517 0.005* 0.068 0.597 -0.126 0.531
Alpha -0.019 0.923 0.219 0.091 -0.228 0.252
Beta 0.075 0.703 0.174 0.177 -0.024 0.905
*Pearson’s correlation coeficient, 2-tailed, p < 0.05.
Table 2. Interhemispheric global delta, theta, alpha, and beta coherences of the Alzheimer’s disease (AD), Parkinson’s disease (PD), and normal control (NC) groups.
Coherences AD
(N = 28)
PD (N = 31)
NC (N = 27)
Comparison (AD x NC)
p-value (AD x PD)
Delta 0.546 (0.050) 0.576 (0.064) 0.575 (0.064) 0.081 0.061
Theta 0.492 (0.043) 0.525 (0.055) 0.521 (0.053) 0.044* 0.021*
Alpha 0.474 (0.057) 0.505 (0.041) 0.526 (0.046) 0.000* 0.017*
Beta 0.414 (0.050) 0.449 (0.068) 0.443 (0.054) 0.046* 0.026*
According to multiple regression, the the Hamilton
Depression Scale score is the only signiicant factor for QOL-AD in the Groups PD and NC (p = 0.000 and p = 0.001, respectively).
DISCUSSION
his study conirmed, in an original way, the hypothesis
that a qEEG variable is associated with the QOL of AD patients
regardless of cognitive and behavioral aspects. his association
was not observed in the NC group or in a group with similar
QOL deterioration, such as the PD group, whose physiopathol
-ogy and qEEG difer from those of AD patients10,19.
he present study corroborates the well-known fact
that QOL is related to depression and the Neuropsychiatric
Inventory scores of patients with PD and normal controls21.
he present used the QOL-AD to investigate the pa
-tient’s perception of his situation because it may difer from
the caregiver’s perception, and the latter can be biased by several factors7,12,22.
he QOL-AD associated most signiicantly with the
Hamilton Depression Rating Scale, Neuropsychiatric Inventory, neuropsychological test that assesses various as-pects of orientation, memory, language, praxis, attention, and
executive function, and Rating of Awareness Deicits, even though they clear difer between studies7,12,23. QOL is weak
-ly correlated with cognition, and in some studies behavioral and psychological disturbances are more strongly associated with QOL than cognition or functional limitations4,12,23. he
patient’s QOL version also revealed associated factors that explain higher variance percentages (48.3%) than the carer-patient QOL ratings (37.5%)7.
In this study the QOL-AD ratings of AD patients were
lower than those of NC and similar to those of PD patients. As
mentioned previously, the study included sociodemographic, cognitive, and behavioral variables associated with QOL to investigate factors possibly associated with QOL-AD.
he QOL-AD of the AD group correlated negatively with
depression symptoms, in a way similar to other studies4,12,23.
However, the QOL-AD correlated positively with verbal lu -ency, but this is hard to compare with other studies because
other studies do not show cognitive their test results; correla -tions between cognitive aspects and QOL are uncommon7,9.
Other studies have not found associations between
QOL-AD and the Pfefer functional activities questionnaire or the
Neuropsychiatric Inventory7.
he study AD group had smaller interhemispheric theta, alpha, and beta band coherences than the NC group, a ind -ing corroborated by the literature20,24,25,26,27. Lower coherence
in AD patients stems from the loss of long corticocortical tracts necessary for functional interactions or from low cho-linergic coupling between cortical neurons28. Cortical areas
would be functionally disconnected, which could be inter-preted as neocortical “disconnection syndrome.” In AD pa-tients smaller alpha and beta band coherences are associat-ed with worse cognitive performance25.
The possible mechanisms behind the positive corre-lations between global interhemispheric coherence, spe-cifically in the theta band, and QOL-AD deserve investi-gation. In a masterful review, Klimesh29 found different
correlations between absolute theta and alpha power oscillations in cognitive processing. Better performance in cognitive tasks is related to two types of phenomena: one tonic, regarding an increase in alpha and decrease in
theta; and another phasic (event related), regarding a de -crease in alpha and an in-crease in theta, depending on the type of memory used.
On the other hand, Stein and Sarnthein30 emphasize
that diferent electrical brain activity frequencies are asso
-ciated with diferent scales of cortical integration. hese au -thors found that local interactions during visual processing involve gamma frequency dynamics, semantic interactions between the parietal and temporal cortices involve beta frequency dynamics, and that long amplitude interactions during internal mental processes involve theta or alpha
fre-quencies. he concept of QOL is speculated to depend on
this broad and internal integration of components possibly related to theta coherence.
he limitations of the present study included the relative -ly small number of cases and the heterogeneous use of acetyl-cholinesterase inhibitors and antidepressants medications in
the Group AD. Still, the present indings are important and
based on simple and easily available qEEG methods.
In conclusion, this is the irst report of a relationship be -tween low global interhemispheric theta-band coherence and low QOL-AD, regardless of cognitive and behavioral
vari-ables. his interhemispheric coherence can be objective -ly measured, and its correlation with QOL scores also con-tributes to the knowledge about the physiopathology of AD, probably related to impaired functional connection between broad cortical areas.
Table 4. Multiple regression and Cohen’s f 2 index for the total Quality of Life – Alzheimer’s Disease (QOL-AD) scores: predictor variable with signiicant effects for the 28 patients with Alzheimer’s disease.
Significant predictor R2 Coefficient Standardized coefficient 95%CI for coefficient p-value Cohen’s f 2
0.377 0.605
Interhemispheric theta coherence 58.229 0.425 11.962 104.496 0.016
References
1. Tedrus GMAS, Fonseca LC, Kange PM. Parkinson´s disease: impact of clinical and cognitive aspects on quality of life. Dement Neuropsychol. 2010;4(2):131-7.
2. Tedrus GMAS, Fonseca LC, Letro GH, Bossoni AS. Samara AB. Dementia and mild cognitive impairment in patients with Parkinson’s disease. Arq Neuropsiquiatr. 2009;67(2B):423-7. http://dx.doi.org/10.1590/S0004-282X2009000300010
3. World Health Organization Quality of Life Group - WHOQOL Group. The World Health Organization Quality of Life assessment (WHOQOL): position paper from the World Health Organization. Soc Sci Med. 1995;41(10):1403-9. http://dx.doi.org/10.1016/0277-9536(95)00112-K
4. Banerjee S, Smith SC, Lamping DL, Harwood RH, Foley B, Smith P et al. Quality of life in dementia: more than just cognition: an analysis of associations with quality of life in dementia. J Neurol Neurosurg Psychiatry. 2006;77(2):146-8. http://dx.doi.org/10.1136/jnnp.2005.072983
5. Logsdon RG, Gibbons LE, McCurry SM, Teri L. Assessing quality of life in older adults with cognitive impairment. Psychosom Med. 2002;64(3):510-9. http://dx.doi.org/10.1097/00006842-200205000-00016
6. Takeda A, Loveman E, Clegg A, Kirby J, Picot J, Payne E et al. A systematic review of the clinical effectiveness of donepezil, rivastigmine and galantamine on cognition, quality of life and adverse events in Alzheimer’s disease. Int J Geriatr Psychiatry. 2006;21(1):17-28. http://dx.doi.org/10.1002/gps.1402
7. Bosboom PR, Alfonso H, Eaton J, Almeida OP. Quality of life in Alzheimer’s disease: different factors associated with complementary ratings by patients and family carers. Int Psychogeriatr. 2012;24(5):708-21. http://dx.doi.org/10.1017/S1041610211002493
8. Chiaramonti R, Muscas GC, Paganini M, Müller TJ, Fallgatter AJ, Versari A et al. Correlations of topographical EEG features with clinical severity in mild and moderate dementia of Alzheimer type. Neuropsychobiology. 1997;36(3):153-8. http://dx.doi.org/10.1159/000119375
9. Thatcher RW, North D, Biver C. EEG and intelligence: relations between EEG coherence, EEG phase delay and power. Clin Neurophysiol. 2005;116(9):2129-41. http://dx.doi.org/10.1016/j.clinph.2005.04.026
10. Fonseca LC, Tedrus GMAS, Letro GH, Bossoni AS. Dementia, mild cognitive impairment and quantitative EEG in patients with Parkinson’s disease. Clinical EEG Neurosci. 2009;40(3):168-72. http://dx.doi.org/10.1177/155005940904000309
11. Fonseca LC, Tedrus GM, Prandi LR, Almeida AM, Furlanetto DS. Alzheimer’s disease: relationship between cognitive aspects and power and coherence EEG measures. Arq Neuropsiquiatr. 2011;69(6):875-81. http://dx.doi.org/10.1590/S0004-282X2011000700005
12. Conde-Sala JL, Garre-Olmo J, Turró-Garriga O, López-Pousa S Vilalta-Franch J. Factors related to perceived quality of life in patients with Alzheimer’s disease: the patient´s perception compared with that of caregivers. Int J Geriatr Psychiatry. 2009;24(6):585-94. http://dx.doi.org/10.1002/gps.2161
13. American Psychiatric Association. Diagnostic and statistical manual of mental disorders. 4th ed. Washington, DC: American Psychiatric Association; 1994.
14. McKhann G, Drachman D, Folstein M, Katzman T, Price D, Stadlan EM. Clinical diagnosis of Alzheimer’s disease: report of the NINCDS-ADRDA Work Group under the auspices of Department of Health
and Human Services Task force on Alzheimer’s disease. Neurology. 1984;34(7):939-44. http://dx.doi.org/10.1212/WNL.34.7.939
15. Calne DB, Snow BJ, Lee C. Criteria for diagnosing
Parkinson’s disease. Ann Neurol. 1992;32(S1 Suppl):S125-7. http://dx.doi.org/10.1002/ana.410320721
16. Hamilton M. A rating scale for depression. J Neurol Neurosurg Psychiatry. 1960;23(1):56-62. http://dx.doi.org/10.1136/jnnp.23.1.56
17. Herrera Jr EJ, Caramelli P, Silveira AS, Nitrini R. Epidemiologic survey of dementia in a community-dwelling Brazilian population. Alzheimer Dis Assoc Disord. 2002;16(2):103-8. http://dx.doi.org/10.1097/00002093-200204000-00007
18. Novelli MM, Nitrini R, Caramelli P. Validation of the Brazilian version of the quality of life scale for patients with Alzheimer’s disease and their caregivers (QOL-AD). Aging Ment Health. 2010;14(5):624-31. http://dx.doi.org/10.1080/13607861003588840
19. Fonseca LC, Tedrus GMAS, Carvas PN, Machado ECFA. Comparison of quantitative EEG between patients with Alzheimer’s disease and those with Parkinson´s disease dementia. Clin Neurophysiol. 2013;124(10):1970-4. http://dx.doi.org/10.1016/j.clinph.2013.05.001
20. Cohen J. A power primer. Psychol Bull. 1992;112(1):155-9. http://dx.doi.org/10.1037/0033-2909.112.1.155
21. Lemke MR. Depressive symptoms in Parkinson’s disease. European J Neurol. 2008;15(S1 Suppl1):21-5. http://dx.doi.org/10.1111/j.1468-1331.2008.02058.x
22. Arons AM, Krabbe PF, Schölzel-Dorenbos CJ, Wilt GJ, Rikkert MG. Quality of life in dementia: a study on proxy bias. BMC Med Res Methodol. 2013;13(1):110. http://dx.doi.org/10.1186/1471-2288-13-110
23. Edelman P, Fulton BR, Kuhn D, Chang Ch, Chang C. A comparison of three methods of measuring dementia-speciic quality of life: perspectives of residents, staff, and observers. Gerontologist. 2005;45(Suppl 1):27-36. http://dx.doi.org/10.1093/geront/45.suppl_1.27
24. Locatelli T, Cursi M, Liberati D, Franceschi M, Comi G. EEG coherence in Alzheimer’s disease.
Electroencephalogr Clin Neurophysiol. 1998;106(3):229-37. http://dx.doi.org/10.1016/S0013-4694(97)00129-6
25. Besthorn C, Förstl H, Geiger-Kabisch C, Sattel H, Gasser T, Schreiter-Gasser U. EEG coherence in Alzheimer disease. Electroencephalogr Clin Neurophysiol.1994;90(3):242-5. http://dx.doi.org/10.1016/0013-4694(94)90095-7
26. Adler G. Brassen S, Jajcevic J. EEG coherence in Alzheimer’s dementia. J Neural Transm. 2003;110(9):1051-8.
http://dx.doi.org/10.1007/s00702-003-0024-8
27. Sancari Z, Adeli H, Adeli A. Intrahemispheric, interhemispheric, and distal EEG coherence in Alzheimer’s disease. Clin Neurophysiol. 2011;122(5):897-906. http://dx.doi.org/10.1016/j.clinph.2010.09.008
28. Jeong J. EEG dynamics in patients with Alzheimer disease. Clin Neurophysiol. 2004;115(7):1490-1505. http://dx.doi.org/10.1016/j.clinph.2004.01.001
29. Klimesch W. EEG alpha and theta oscillations relect cognitive and memory performance: a review and analysis. Brain Res Rev. 1999;29(2-3):169-95. http://dx.doi.org/10.1016/S0165-0173(98)00056-3