ACPD
15, 28915–28937, 2015Climate modulation of the Tibetan Plateau
on haze in China
X. Xu et al.
Title Page
Abstract Introduction
Conclusions References
Tables Figures
◭ ◮
◭ ◮
Back Close
Full Screen / Esc
Printer-friendly Version Interactive Discussion
Discussion
P
a
per
|
Discussion
P
a
per
|
Discussion
P
a
per
|
Discussion
P
a
per
Atmos. Chem. Phys. Discuss., 15, 28915–28937, 2015 www.atmos-chem-phys-discuss.net/15/28915/2015/ doi:10.5194/acpd-15-28915-2015
© Author(s) 2015. CC Attribution 3.0 License.
This discussion paper is/has been under review for the journal Atmospheric Chemistry and Physics (ACP). Please refer to the corresponding final paper in ACP if available.
Climate modulation of the Tibetan Plateau
on haze in China
X. Xu1, T. Zhao2,3, F. Liu4,a, S. L. Gong5, D. Kristovich4, C. Lu6, Y. Guo1,7, X. Cheng2, Y. Wang1, and G. Ding1
1
State Key Laboratory of Severe Weather, Chinese Academy of Meteorological Sciences, Beijing, 100081, China
2
Collaborative Innovation Center on Forecast and Evaluation of Meteorological Disasters, Nanjing University of Information Science and Technology, Nanjing 210044, China
3
Key Laboratory for Aerosol-Cloud-Precipitation of China Meteorological Administration, Nanjing University of Information Science & Technology, Jiangsu, 210044, China
4
Climate and Atmospheric Science Section, Division of Illinois State Water Survey, Prairie Research Institute, University of Illinois at Urban-Champaign, Champaign, IL 61820, USA
5
Institute of Atmospheric Composition/Key Laboratory of Atmospheric Chemistry of China Meteorological Administration, Chinese Academy of Meteorological Sciences, Beijing, 100081, China
6
National Science Foundation, VA 22230, USA
7
Tiannan Observatory, Tianjin Meteorological Bureau, Tianjin 200350, China
a
ACPD
15, 28915–28937, 2015Climate modulation of the Tibetan Plateau
on haze in China
X. Xu et al.
Title Page
Abstract Introduction
Conclusions References
Tables Figures
◭ ◮
◭ ◮
Back Close
Full Screen / Esc
Printer-friendly Version Interactive Discussion
Discussion
P
a
per
|
Discussion
P
a
per
|
Discussion
P
a
per
|
Discussion
P
a
per
|
Received: 2 October 2015 – Accepted: 9 October 2015 – Published: 26 October 2015
Correspondence to: T. Zhao ([email protected])
ACPD
15, 28915–28937, 2015Climate modulation of the Tibetan Plateau
on haze in China
X. Xu et al.
Title Page
Abstract Introduction
Conclusions References
Tables Figures
◭ ◮
◭ ◮
Back Close
Full Screen / Esc
Printer-friendly Version Interactive Discussion
Discussion
P
a
per
|
Discussion
P
a
per
|
Discussion
P
a
per
|
Discussion
P
a
per
Abstract
Rapid increases in pollutant emissions in conjunction with stagnant meteorological con-ditions result in haze pollution in China. Recent frequent haze in China has attracted worldwide attention. Here we show a relationship between the haze events and Tibetan Plateau (TP)’s environment and climate changes. Based on observational data taken
5
over recent decades, we identify central-eastern China (CEC) as a climatological large-scale “susceptible region” of frequent haze, which is harbored by the TP with its impact on mid-latitude westerly winds. The observational and modeling studies demonstrate that the interannual variations in the thermal forcing of TP are positively correlated with the incidences of wintertime haze over CEC. Further analysis indicates that the
10
TP-climate warming induced changes in atmospheric circulation driving frequent haze events in CEC. The frequent haze occurrences in CEC are consistent with decreasing winter monsoon winds, intensifying downward air flows and increasing atmospheric stability in the lower troposphere over the CEC in association with upstream plateau’s thermal anomalies. Therefore, variations of haze in China are related to mechanical
15
and thermal forcing by the TP. Our results also suggest that implications of the large TP-topography for environment and climate changes should be taken into account for air pollution mitigation policies in China.
1 Introduction
Haze in poor visibility with high particulate matter (PM) or aerosol levels is a pervasive
20
air quality problem facing China, posing a major challenge for public health (Huang et al., 2014). The frequent haze pollution has been notable for hitting record high levels of PM pollution over central-eastern China (CEC) in history since 1961 (Ding and Liu, 2014). In January 2013, extremely severe and persistent haze events swept over much of CEC-region. A large area of CEC from the North China Plain, including Beijing,
ACPD
15, 28915–28937, 2015Climate modulation of the Tibetan Plateau
on haze in China
X. Xu et al.
Title Page
Abstract Introduction
Conclusions References
Tables Figures
◭ ◮
◭ ◮
Back Close
Full Screen / Esc
Printer-friendly Version Interactive Discussion
Discussion
P
a
per
|
Discussion
P
a
per
|
Discussion
P
a
per
|
Discussion
P
a
per
|
haze and smog for almost one month. It is estimated by the Chinese government that this wintertime haze covered a quarter of the total land area in China with 600 million people, half of the Chinese population, exposed to the haze air pollution (Gu, 2013). China’s National Meteorological Center released its first ever “haze” orange alert (CMA, 2010) in response to the air quality index frequently reaching hazardous levels for this
5
regional haze event. The PM2.5 (PM with an aerodynamic diameter less than 2.5 µm)
concentrations at 33 cities in the CEC region were more than 300 µg m−3 for longer
than half a month, and some monitors reported hourly peak PM2.5levels of 900 µg m− 3
, which is classified as “Beyond Index” (Gu, 2013). The suffering of those in China from haze and poor air quality has attracted worldwide attention (Wang et al., 2014; Pope III
10
and Dockery, 2013; Chen et al., 2013; Kan et al., 2011; Park et al., 2013; Zhao et al., 2013).
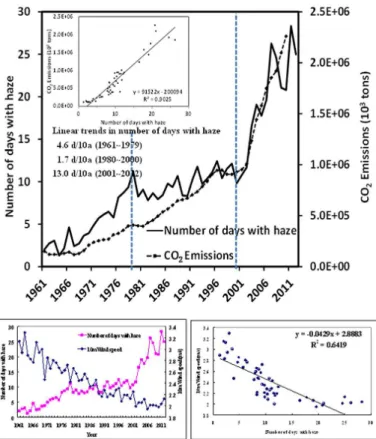
China has been experiencing increased air pollution, commonly attributed to the large increases in pollutant emissions associated with the rapid economic develop-ment. The huge increases in CO2emissions from fossil fuel combustion with the
cer-15
tain attendant aerosol loading have a direct physical link to more frequent haze occur-rences in situ in China (upper panel of Fig. 1). The regional emissions of air pollutants contribute largely to the haze pollution in CEC with the coefficient of determination,
R2=0.9025 between interannual variations of haze frequency and CO2 emission in
China (upper panel of Fig. 1). However, air quality is modulated by changes in
mete-20
orology and climate (Tagaris et al., 2009). In accompany with an unceasing increase in the Chinese pollutant emissions in recent decades, the significant interannual vari-ations of haze occurrences in CEC have evolved with the trends of slow ascending from the 1960s to 70s, less changing during the 1980s–1990s and sharply rising with a trend reaching 13.0d/10a going into the 21st century (upper panel of Fig. 1), implying
25
deter-ACPD
15, 28915–28937, 2015Climate modulation of the Tibetan Plateau
on haze in China
X. Xu et al.
Title Page
Abstract Introduction
Conclusions References
Tables Figures
◭ ◮
◭ ◮
Back Close
Full Screen / Esc
Printer-friendly Version Interactive Discussion
Discussion
P
a
per
|
Discussion
P
a
per
|
Discussion
P
a
per
|
Discussion
P
a
per
mination, R2=0.6419 passing the confidence level of 99.9 % (lower panel of Fig. 1).
The surface wind speed associated with East Asian monsoons has significantly weak-ened in both winter and summer in the recent three decades (Xu et al., 2006; Oey et al., 2013). The weakening of the East Asian monsoons could increase air pollutants mainly by the changes in atmospheric circulation and weather conditions (Zhu et al.,
5
2012; Niu et al., 2010). Weak advection of cold air, in conjunction with strong subsi-dence and stable atmospheric stratification, can easily produce a stagnation area in the lower troposphere resulting in regional pollutant accumulations, which are favor-able for the development of CEC haze events (Zhao et al., 2013). In addition, in the presence of high soil moisture, strong surface evaporation results in increases in the
10
near-surface relative humidity, which is also conducive to haze formation (Xiao et al., 2011).
It is generally accepted that meteorological conditions in China are closely connected to the large topography of Tibetan Plateau (TP) (Yanai et al., 1992; Xu et al., 2010; Wu et al., 2012; Ye and Wu, 1998). Precipitation, land surface temperature and surface
15
air temperature have increased on the TP over the past decades (Zhong et al., 2011). The TP has exhibited the largest surface radiative flux changes induced by aerosols (e.g. black carbon and dust) contaminating snow and ice compared to any other snow-and ice-covered regions in the world (Qian et al., 2011). The question remains whether the rapid changes in climate experienced by the TP could exert an influence on the
20
haze variations in the downstream CEC region, the lower flatlands harbored by the large TP-topography. The consequent processes linking the TP-climate change with the CEC haze pollution should be highly possible and worth investigating, even though it is obvious that increasing anthropogenic emissions of aerosols contribute to high haze frequency (Fig. 1). In this study, we attempt to determine the physical connection
25
ACPD
15, 28915–28937, 2015Climate modulation of the Tibetan Plateau
on haze in China
X. Xu et al.
Title Page
Abstract Introduction
Conclusions References
Tables Figures
◭ ◮
◭ ◮
Back Close
Full Screen / Esc
Printer-friendly Version Interactive Discussion
Discussion
P
a
per
|
Discussion
P
a
per
|
Discussion
P
a
per
|
Discussion
P
a
per
|
2 Data and method
In this study, we used the observational records from 1961 to 2012 of haze and surface wind archived at the China Meteorological Administration (CMA) and the meteorolog-ical variables of air temperature, winds and relative humidity from the reanalysis data generated by the US National Center for Environmental Prediction–National Center for
5
Atmospheric Research (NCEP/NCAR).
Following the studies of Yanai (1961), Yanai and Johnson (1993), Yanai and Tomita (1998), the apparent heat source (Q1) and apparent moisture sink (Q2) are calculated.
Atmospheric heat sources and moisture sinks are respectively gauged with theQ1and Q2. AsQ1includesQ2and radiative heating, here we concentrate only on the collective 10
effect of apparent heating (Q1) over the TP. The heat source column (in units of w m−2)
over the TP is obtained with both horizontal and vertical integration ofQ1over the
TP-area of 78–103◦E and 28–38◦N covering the most region with the altitude of higher
than 3000 m (left panel of Fig. 2) to form a one-dimensional variable representing the TP-thermal forcing. The correlation coefficients between the TP-heat source column
15
and the meteorological variables (U, V and W components of wind and air
tempera-ture) are calculated to build their horizontal and vertical distributions of correlations. Zonal, meridional and vertical components of the correlation vector are respectively derived through the correlation coefficients of the TP-heat source column toU,V and W components of vector of wind and air temperature, indicating the variations in wind 20
and air temperature induced by the TP-thermal forcing.
In the modeling study, we used the global air quality model system GEM-AQ/EC, which is an integration of gas phase chemistry and aerosol modules in the meteo-rological model GEM (Global Environmental Multiscale weather prediction model of Environment Canada). Full details of the development and evaluation of GEM-AQ/EC
25
Re-ACPD
15, 28915–28937, 2015Climate modulation of the Tibetan Plateau
on haze in China
X. Xu et al.
Title Page
Abstract Introduction
Conclusions References
Tables Figures
◭ ◮
◭ ◮
Back Close
Full Screen / Esc
Printer-friendly Version Interactive Discussion
Discussion
P
a
per
|
Discussion
P
a
per
|
Discussion
P
a
per
|
Discussion
P
a
per
gional variations of aerosols in East Asia are reasonably captured by the GEM-AQ/EC modeling compared to the observed aerosol concentrations and aerosol optical depth.
3 A climatological “susceptible region” for haze formation in China
Examination of ground-based observations of the frequency of haze events from 1961 to 2012 (CMA, 2010) reveals that the haze air pollution in China typically has the
high-5
est levels in the CEC region covering a vast area from the eastern edges of the TP and the Loess Plateau to China’s Pacific coast, and haze occurrences in CEC oscillate sea-sonally between the peak in winter and the low in summer (Fig. 2). Based upon these climate data, we could climatologically regard the CEC, with the lowlands harboured by the upstream plateaus of western China, as a large-scale “susceptible region” of
fre-10
quent haze events in China (left panel of Fig. 2). Upper panel of Fig. 3 shows that low average wind speeds tend to be coincident with the centers of pollutant haze events over the CEC (left panel of Fig. 2), reflecting the climatological “susceptible region” of haze occurrences in connection with a stagnation area in the lower troposphere in China.
15
Due to the influence of the TP terrain on the typical westerly winds in this region, the air flowing from the windward plateaus descends in a north–south oriented zone between about 110 and 125◦E (middle panel of Fig. 3). Accompanying this strong
downward current are weak winds in the near-surface layers that lie in the lee side of the plateaus. These air flow and wind condition lead to development of a “harbor” that
20
accumulates air pollutants in the CEC region. The weak wind and downward current areas coincide well with the centers of frequent haze events in China (middle and lower panels of Fig. 3). The “susceptible region” of haze events over the CEC region from the eastern edge of the plateaus to the lower flatlands is associated with the “harbor” effect of the unique TP topography under specific meteorological conditions that trap
25
ACPD
15, 28915–28937, 2015Climate modulation of the Tibetan Plateau
on haze in China
X. Xu et al.
Title Page
Abstract Introduction
Conclusions References
Tables Figures
◭ ◮
◭ ◮
Back Close
Full Screen / Esc
Printer-friendly Version Interactive Discussion
Discussion
P
a
per
|
Discussion
P
a
per
|
Discussion
P
a
per
|
Discussion
P
a
per
|
Because haze is climatologically mostly a winter phenomenon in the CEC (right panel of Fig. 2), the following analysis on the TP’s climate effect on haze pollution in CEC and the related mechanisms is focused on the winter season.
4 Relationships between TP’s thermal forcing and haze over CEC
As a vast elevated landmass, the TP acts thermodynamically as a synoptic-scale
win-5
tertime cooling source protruding into the free atmosphere (Qiu, 2008; Liu and Chen, 2000; Ruddiman and Kutzbach, 1989; Yeh et al., 1957). Aerosol transport and depo-sition have been increasingly dirtying and even melting the snow- and ice-dominated wintertime TP (Ramanathan and Carmichael, 2008; Xu et al., 2009). This process leads to decreases in the snow and ice albedos, which could be largely responsible for
10
climate change in the TP region (Hansen and Nazarenko, 2004). Consequently, the TP region, as a wintertime cooling source (negative values of apparent heat sourceQ1),
has been experiencing a warming trend over recent decades, especially since 2001 (upper left panel of Fig. 4).
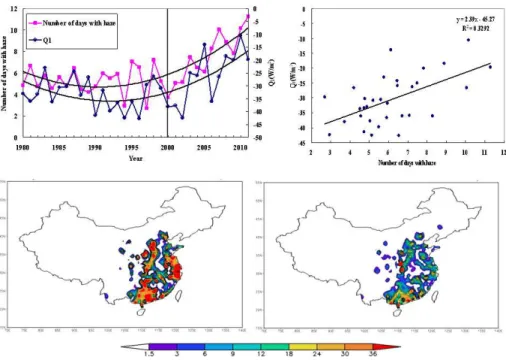
Against the backdrop of global climate change, the question may be posed: does the
15
warming of the TP region cause changes in the atmospheric environment in China re-sulting in more frequent haze events in the CEC? The historical data analysis indicates that a significant correlation exists between the wintertime cooling source represented by the apparent heat source columnQ1integrated over the TP and the number of haze
days averaged regionally in the CEC over recent decades (upper panel of Fig. 4). It is
20
also found in upper panel of Fig. 4 that the changes of wintertimeQ1over the TP were
reversed from cooling to warming in the late 1990s, which could be connected with the trends in haze occurrences with less changing over the 1980s–1990s and sharp increasing during the 21st century in China under the increases in pollutant emission levels (upper panel of Fig. 1). Based on the composite analysis on the haze frequencies
25
agree-ACPD
15, 28915–28937, 2015Climate modulation of the Tibetan Plateau
on haze in China
X. Xu et al.
Title Page
Abstract Introduction
Conclusions References
Tables Figures
◭ ◮
◭ ◮
Back Close
Full Screen / Esc
Printer-friendly Version Interactive Discussion
Discussion
P
a
per
|
Discussion
P
a
per
|
Discussion
P
a
per
|
Discussion
P
a
per
ment with the positively and negatively anomalous TP-cooling sources (lower panel of Fig. 4). The frequency of haze events over the CEC region is positively correlated with climatic warming over the TP.
5 The TP-warming inducing favorable meteorology for CEC’s haze
Further analyses provide information on the mechanisms relating climatic warming of
5
the TP and enhancement in haze occurrence in the CEC. The favorable meteorology for haze occurrences is well known to be lower wind speeds, weaker vertical mixing, stronger subsidence, higher air humidity and more stable low-level stratification. We are still pondering the question whether climatic warming of the TP could strengthen the aforementioned meteorological conditions downstream for frequent haze events in
10
the CEC to reveal the mechanism how thermal anomalies of the TP in climate change influence the incidence of haze over the CEC.
The East Asian winter monsoon, which climatologically prevails over the CEC, typi-cally maintains near-surface northeastern winds (Ding, 1994). In upper panel of Fig. 5, two horizontal components of the correlation vector are derived through two
correla-15
tion coefficients of Q1 to U and V surface wind components, respectively, where the
arrow length denotes the combined correlation with a longer arrow implying a better correlation, and the arrow direction means the direction of anomalous wind induced by the TP-thermal effect. The correlation vector over the CEC in upper panel of Fig. 5 indicates that the variations of thermal forcing over the TP could give rise to the
weak-20
ening winter monsoon winds (southwest wind anomalies) induced by changes of Q1
over the TP. Furthermore, the anomalous south wind components resulting from cli-mate change in the TP (positive correlations of Q1 to V wind components in upper panel of Fig. 5) can enhance transport of water vapor from the oceans to the CEC (Niu et al., 2010). By increasing the moisture in the lower troposphere driven by the strong
25
ACPD
15, 28915–28937, 2015Climate modulation of the Tibetan Plateau
on haze in China
X. Xu et al.
Title Page
Abstract Introduction
Conclusions References
Tables Figures
◭ ◮
◭ ◮
Back Close
Full Screen / Esc
Printer-friendly Version Interactive Discussion
Discussion
P
a
per
|
Discussion
P
a
per
|
Discussion
P
a
per
|
Discussion
P
a
per
|
the East Asian winter monsoon with weak advection of cold air, haze formation can be enhanced (Zhao et al., 2013; Xiao et al., 2011).
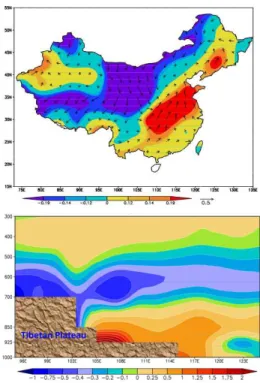
Upper panels of Fig. 6 present the results of composite analysis on vertical varia-tions in air temperature in five winters respectively with the most positive and the most negative anomalies in the TP cooling source. The air temperature changes with
up-5
per warmer and lower cooler are found in the middle and lower troposphere over the CEC region in winter with positiveQ1 anomalies on the TP, and an inverse structure
of the CEC air temperature changes in winter with negativeQ1 anomalies on the TP
(upper panel of Fig. 6). The TP’s warming and cooling anomalies could lead to a “warm shield” and a “cool shield” in the atmosphere over the CEC. The correlation analyses
10
of observation data over 1981–2012 confirm that the vertical structure of anomalous air temperature similar to that by induced the TP’s positive thermal effect (upper-left panel of Fig. 6) with a “warm shield” intensifying the subsidence in the lower tropo-sphere is responsible for the frequent haze occurrences over the CEC (lower panel of Fig. 6). Associated with the warming TP, the vertical variations of air temperature with
15
upper warmer and lower cooler could easily build an inversion layer in the atmosphere over the polluted CEC, which results in more stably stratified atmosphere in this region (Fig. 6). Heavy haze pollution processes in winter are highly related with the existence of atmospheric inversion layer (Xu et al., 2003).
The cumulative consequences of weakening winter monsoon winds, intensifying
20
downward air flows, a more humid and more stable atmosphere as the favorable me-teorological conditions for haze formation would be expected to strengthen the air pol-lutant “harbor” effect of the TP and increase the number and severity of haze events in the CEC. Therefore, the haze formation over CEC is significantly modulated by the TP’s climate change under the increase and even without changes in the current levels
25
ACPD
15, 28915–28937, 2015Climate modulation of the Tibetan Plateau
on haze in China
X. Xu et al.
Title Page
Abstract Introduction
Conclusions References
Tables Figures
◭ ◮
◭ ◮
Back Close
Full Screen / Esc
Printer-friendly Version Interactive Discussion
Discussion
P
a
per
|
Discussion
P
a
per
|
Discussion
P
a
per
|
Discussion
P
a
per
6 A sensitivity simulation experiment
In order to more convincingly demonstrate the connection of the TP-warming to the haze frequency over CEC, a sensitivity simulation by employing the global air quality model GEM-AQ/EC is designed to isolate the emission influence on interannual varia-tions of aerosols, where the monthly data of anthropogenic emissions by fossil fuel and
5
biomass burning as well as the sulfate emissions compiled using EDGAR2.0 (Gong et al., 2012) are introduced without any interannual changes from 1995 to 2004. The sensitivity simulation experiment of GEM-AQ/EC was configured with 28 hybrid verti-cal levels with the model top at 10 hPa. The horizontal model grid was configured with a global uniform resolution of 1◦
×1◦. GEM-AQ/EC is run with the fully nudged variables
10
of wind, temperature, pressure and water vapor of NCEP-reanalysis meteorology every 24 h from 1995 to 2004.
Haze and aerosol changes are controlled by both pollutant emission and meteorol-ogy, and the effects of meteorology are difficult to separate from aerosol observations. The 10-year GEM-AQ/EC simulation without interannual changes in the anthropogenic
15
emissions provides a possibility to identify the meteorological effect on the interannual variations of aerosols. To investigate the implications of TP’s climate change for in-terannual aerosol variations in CEC’s haze, a composite analysis of surface aerosol concentrations over CEC (Fig. 7) were performed for two winters with lower TP’s Q1
(1996, 2002) and two winters with higher TP’sQ1 (1998, 2003) during the simulation 20
period of 1995–2004 according to the interannual Q1 changes over the TP (Fig. 4).
Because the effect of emissions was singled out in the interannual aerosol variations modeled in the sensitivity simulation experiment, the simulated variations in aerosol concentrations over CEC could be purely attributed to the changes of meteorological drivers in the context of changing climate. The analysis results show that the TP heating
25
ACPD
15, 28915–28937, 2015Climate modulation of the Tibetan Plateau
on haze in China
X. Xu et al.
Title Page
Abstract Introduction
Conclusions References
Tables Figures
◭ ◮
◭ ◮
Back Close
Full Screen / Esc
Printer-friendly Version Interactive Discussion
Discussion
P
a
per
|
Discussion
P
a
per
|
Discussion
P
a
per
|
Discussion
P
a
per
|
formation, this sensitivity simulation confirmed that the frequent haze in China with the significantly interannual variations is closely related to thermal forcing by the TP, and climate change of the TP could intensify pollutant haze in China even without increases in the current anthropogenic pollutant emissions.
7 Conclusions
5
Based on observational data over the recent decades, we identify the CEC region, the lower flatlands along the eastern plateau edges in China as a climatological large-scale “susceptible region” of pollutant haze in connected with downward currents and weak near-surface winds in consequence of the “harbor” impact of large TP topography on mid-latitude westerlies. The climate analysis reveals that the increasingly frequent
10
haze in the CEC region is related with decreasing winter monsoon winds, intensify-ing descendintensify-ing air and increasintensify-ing atmospheric stability in the lower-troposphere over the CEC in association with plateau’s thermal anomalies. Climate impact of the TP’s mechanical and thermal forcing driving changes in atmospheric circulation and me-teorological conditions downstream is potentially contributing to the increasing trend
15
in haze events in China. A sensitivity simulation also confirms that the frequent haze in CEC with the significantly interannual variations is closely connected with thermal forcing by the TP.
The Chinese government has been making great strides in reducing emissions and mitigating air pollution. However, the interplay of China’s unique landform distribution
20
with climate change and its associated more extreme weather events could impair the effectiveness of air pollution control measures in China. With the influence of the TP climate change, the CEC region is facing a bigger challenge to realize air quality maintenance plan. The TP “harbor effect” and climate change should be considered in making decisions on the locations of new industrial facilities for development planning
25
“suscepti-ACPD
15, 28915–28937, 2015Climate modulation of the Tibetan Plateau
on haze in China
X. Xu et al.
Title Page
Abstract Introduction
Conclusions References
Tables Figures
◭ ◮
◭ ◮
Back Close
Full Screen / Esc
Printer-friendly Version Interactive Discussion
Discussion
P
a
per
|
Discussion
P
a
per
|
Discussion
P
a
per
|
Discussion
P
a
per
ble region” of haze and in turn reduce the number and severity of haze events in the central-eastern region of China.
In this preliminary study based on long-term observational data and a sensitivity sim-ulation experiment, we investigate a relationship between the haze pollution in China and TP’s environment and climate changes. The impacts of TP’s climate change on
5
air quality in China could be further studied on the shifts in weather patterns, pollutant emissions and chemical reaction to more comprehensively understand the meteorolog-ical drivers of air quality in a changing climate and also to consider the ocean-related impacts of climate change.
Acknowledgements. This research is jointly supported by the Projects of Nature Science Fund
10
of China (No. 41130960), Chinese National Science and Technology Project (2014BAC22B04), the projects of China Special Fund for Meteorological Research (GYHY201406001) and Envi-ronmental Protection (HY14093355; 201509001) in the Public Interest, Chinese Key Technolo-gies R&D Program (2014BAC16B00), Science and Technology Support Program of Jiangsu Province (BE2012771) and the Priority Academic Program Development of Jiangsu Higher
15
Education Institutions (PAPD). We acknowledge the review of Beth Hall (ISWS).
References
Chen, Y. Y., Ebenstein, A., Greenstone, M., and Li, H. B.: Evidence on the impact of sustained exposure to air pollution on life expectancy from China’s Huai River policy, P. Natl. Acad. Sci. USA, 110, 12936–12941, doi:10.1073/pnas.1300018110, 2013.
20
CMA: China Meteorological Administration, National meteorological standard of the People’s Republic China: observation and forecasting levels of haze, QX-T 113–2010, 2010 (in Chi-nese).
Ding, Y. H.: Monsoons over China, Kluwer Academic Publishers, Dordrecht, Boston, London, 1994.
25
ACPD
15, 28915–28937, 2015Climate modulation of the Tibetan Plateau
on haze in China
X. Xu et al.
Title Page
Abstract Introduction
Conclusions References
Tables Figures
◭ ◮
◭ ◮
Back Close
Full Screen / Esc
Printer-friendly Version Interactive Discussion
Discussion
P
a
per
|
Discussion
P
a
per
|
Discussion
P
a
per
|
Discussion
P
a
per
|
Gong, S. L., Lavoué, D., Zhao, T. L., Huang, P., and Kaminski, J. W.: GEM-AQ/EC, an on-line global multi-scale chemical weather modelling system: model development and evaluation of global aerosol climatology, Atmos. Chem. Phys., 12, 8237–8256, doi:10.5194/acp-12-8237-2012, 2012.
Gu, L.: Half of Chinese live in haze: report, China News, available at: http://www.ecns.cn/
5
cns-wire/2013/07-12/72889.shtml (last access: 12 July 2013) 2013.
Hansen, J. and Nazarenko, L.: Soot climate forcing via snow and ice albedos, P. Natl. Acad. Sci. USA, 101, 423–428, 2004.
Huang, R.-J., Zhang, Y., Bozzetti, C., Ho, K.-F., Cao, J.-J., Han, Y., Daellenbach, K. R., Slowik, J. G., Platt, S. M., Canonaco, F., Zotter, P., Wolf, R., Pieber, S. M., Bruns, E. A.,
10
Crippa, M., Ciarelli, G., Piazzalunga, A., Schwikowski, M., Abbaszade, G., Schnelle-Kreis, J., Zimmermann, R., An, Z., Szidat, S., Baltensperger, U., Haddad, I. E., and Prevot, A. S. H.: High secondary aerosol contribution to particulate pollution during haze events in China, Nature, 514, 218–222, doi:10.1038/nature13774, 2014.
Hung, C.-W. and Kao, P.-K.: Weakening of the winter monsoon and abrupt increase of winter
15
rainfalls over northern taiwan and southern china in the early 1980s, J. Climate, 23, 2357– 2367, doi:10.1175/2009JCLI3182.1, 2010.
Kan, H., Chen, R., and Tong, S.: Ambient air pollution, climate change, and population health in China, Environ. Int., 42, 10–19, doi:10.1016/j.envint.2011.03.003, 2011.
Liu, X. and Chen, B.: Climatic warming in the Tibetan Plateau during recent decades, Int. J.
20
Climatol., 20, 1729–1742, 2000.
Niu, F., Li, Z., Li, C., Lee, K.-H., and Wang, M.: Increase of wintertime fog in China: poten-tial impacts of weakening of the Eastern Asian monsoon circulation and increasing aerosol loading, J. Geophys. Res.-Atmos., 115, D00K20, doi:10.1029/2009jd013484, 2010.
Oey, L.-Y., Chang, M.-C., Chang, Y.-L., Lin, Y.-C., and Xu, F.-H.: Decadal warming of coastal
25
China Seas and coupling with winter monsoon and currents, Geophys. Res. Lett., 40, 6288– 6292, doi:10.1002/2013GL058202, 2013.
Park, S.-U., Cho, J.-H., and Park, M.-S.: Analyses of high aerosol concentration events (dense haze/mist) occurred in East Asia during 10–16 January 2013 using the data simulated by the Aerosol Modeling System, International Journal of Chemistry, 03, 10–26, 2013.
30
ACPD
15, 28915–28937, 2015Climate modulation of the Tibetan Plateau
on haze in China
X. Xu et al.
Title Page
Abstract Introduction
Conclusions References
Tables Figures
◭ ◮
◭ ◮
Back Close
Full Screen / Esc
Printer-friendly Version Interactive Discussion
Discussion
P
a
per
|
Discussion
P
a
per
|
Discussion
P
a
per
|
Discussion
P
a
per
Qian, Y., Flanner, M. G., Leung, L. R., and Wang, W.: Sensitivity studies on the impacts of Tibetan Plateau snowpack pollution on the Asian hydrological cycle and monsoon climate, Atmos. Chem. Phys., 11, 1929–1948, doi:10.5194/acp-11-1929-2011, 2011.
Qiu, J.: China: the third pole, Nature, 454, 393–396, 2008.
Ramanathan, V. and Carmichael, G.: Global and regional climate changes due to black carbon,
5
Nature, 1, 221–227, 2008.
Ruddiman, W. F. and Kutzbach, J. E.: Forcing of late Cenozoic Northern Hemisphere climate by plateau uplift in southern Asia and the American west, J. Geophys. Res., 94, 18409–18427, doi:10.1029/JD094iD15p18409, 1989.
Tagaris, E., Liao, K. J., Delucia, A. J., Deck, L., Amar, P., and Russell, A. G.: Potential impact
10
of climate change on air pollution-related human health effects, Environ. Sci. Technol., 43, 4979–4988, 2009.
Wang, Y., Zhang, R. Y., and Saravanan, R.: Asian pollution climatically modulates midlatitude cyclones following hierarchical modeling and observational analysis, Nature Commun., 5, 3098, doi:10.1038/ncomms4098, 2014.
15
Wu, G. X., Liu, Y., He, B., Q. Bao, Duan, A., and Jin, F.-F.: Thermal controls on the Asian summer monsoon, Scientific Reports, 2, 404, doi:10.1038/srep00404, 2012.
Xiao, Z.-M., Zhang, Y.-F., Hong, S.-M., Bi, X.-H., Jiao, L., Feng, Y.-C., and Wang, Y.-Q.: Es-timation of the main factors influencing haze, based on a long-term monitoring campaign in Hangzhou, China, Aerosol Air Qual. Res., 11, 873–882, doi:10.4209/aaqr.2011.04.0052,
20
2011.
Xu, B., Cao, J. J., Hansen, J., Yao, T., Joswiaa, D. R., Wang, N., Wu, G., Wang, M., Zhao, H., Yang, W., Liu, X., and He, J.: Black soot and the survival of Tibetan glaciers, P. Natl. Acad. Sci. USA, 106, 22114–22118, 2009.
Xu, M., Chang, C.-P., Fu, C., Qi, Y., Robock, A., Robinson, D., and Zhang, H.: Steady decline
25
of east Asian monsoon winds, 1969–2000: Evidence from direct ground measurements of wind speed, J. Geophys. Res., 111, D24111, doi:10.1029/2006JD007337, 2006.
Xu, X., Ding, G., Zhou, L., Zheng, X., Bian, L., Qiu, J., Yang, L., and Mao, J.: Localized 3D-structural features of dynamic-chemical processes of urban air pollution in Beijing winter, Chinese Sci. Bull., 48, 819–825, 2003.
30
ACPD
15, 28915–28937, 2015Climate modulation of the Tibetan Plateau
on haze in China
X. Xu et al.
Title Page
Abstract Introduction
Conclusions References
Tables Figures
◭ ◮
◭ ◮
Back Close
Full Screen / Esc
Printer-friendly Version Interactive Discussion
Discussion
P
a
per
|
Discussion
P
a
per
|
Discussion
P
a
per
|
Discussion
P
a
per
|
Yanai, M.: A detailed analysis of typhoon formation, J. Meteorol. Soc. Jpn., 39, 187–214, 1961. Yanai, M. and Johnson, R. H.: Impacts of cumulus convection on thermodynamic fields, in: The
Representation of Cumulus Convection in Numerical Models of the Atmosphere, edited by: Emanuel, K. A. and Raymond, D. J., Vol. 24., AMS Monograph, 39–62, 1993.
Yanai, M. and Tomita, T.: Seasonal and interannual variability of atmospheric heat sources and
5
moisture sinks as determined from NCEP–NCAR reanalysis, J. Climate, 11, 463–482, 1998. Yanai, M., Li, C. F., and Song, Z. S.: Seasonal heating of the Tibetan Plateau and its effects on
the evolution of the Asian summer monsoon, J. Meteorol. Soc. Jpn., 70, 319–351, 1992. Ye, D. Z. and Wu, G. X.: The role of the heat source of the Tibetan Plateau in the general
circulation, Meteorol. Atmos. Phys., 67, 181–198, 1998.
10
Yeh, T. C., Luo, S. W., and Chu, P. C.: The wind structure and heat balance in the lower tropo-sphere over Tibetan Plateau and its surrounding, Acta Meteorol. Sin., 28, 108–121, 1957. Zhao, T. L., Gong, S. L., Huang, P., and Lavoué, D.: Hemispheric transport and
influ-ence of meteorology on global aerosol climatology, Atmos. Chem. Phys., 12, 7609–7624, doi:10.5194/acp-12-7609-2012, 2012.
15
Zhao, X. J., Zhao, P. S., Xu, J., Meng, W., Pu, W. W., Dong, F., He, D., and Shi, Q. F.: Analysis of a winter regional haze event and its formation mechanism in the North China Plain, Atmos. Chem. Phys., 13, 5685–5696, doi:10.5194/acp-13-5685-2013, 2013.
Zhong, L., Su, Z., Ma, Y., Salama, M. S., and Sobrino, J. A.: Accelerated changes of environ-mental conditions on the Tibetan Plateau caused by climate change, J. Climate, 24, 6540–
20
6550, 2011.
ACPD
15, 28915–28937, 2015Climate modulation of the Tibetan Plateau
on haze in China
X. Xu et al.
Title Page
Abstract Introduction
Conclusions References
Tables Figures
◭ ◮
◭ ◮
Back Close
Full Screen / Esc
Printer-friendly Version Interactive Discussion
Discussion
P
a
per
|
Discussion
P
a
per
|
Discussion
P
a
per
|
Discussion
P
a
per
|
ACPD
15, 28915–28937, 2015Climate modulation of the Tibetan Plateau
on haze in China
X. Xu et al.
Title Page
Abstract Introduction
Conclusions References
Tables Figures
◭ ◮
◭ ◮
Back Close
Full Screen / Esc
Printer-friendly Version Interactive Discussion
Discussion
P
a
per
|
Discussion
P
a
per
|
Discussion
P
a
per
|
Discussion
P
a
per
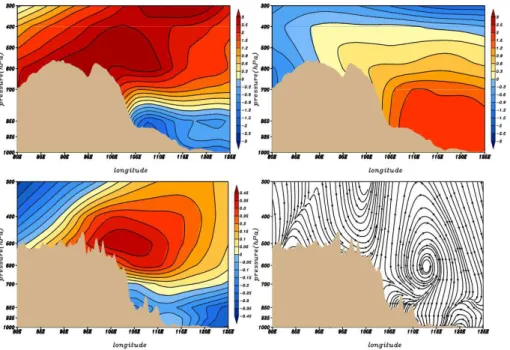
Figure 3.Surface wind speed distribution (m s−1) averaged over 1961–2012 in China with the
red rectangle marking the region for cross sections in the middle and lower panels (upper panel). Cross sections of horizontal wind speed (m s−1
; filled color contours) and vertical cir-culations illustrated by stream lines (middle panel) and zonal variations of annual haze event frequency (lower panel) at 27–41◦N averaged over 1961–2012. Note that near-surface vertical
ACPD
15, 28915–28937, 2015Climate modulation of the Tibetan Plateau
on haze in China
X. Xu et al.
Title Page
Abstract Introduction
Conclusions References
Tables Figures
◭ ◮
◭ ◮
Back Close
Full Screen / Esc
Printer-friendly Version Interactive Discussion
Discussion
P
a
per
|
Discussion
P
a
per
|
Discussion
P
a
per
|
Discussion
P
a
per
|
ACPD
15, 28915–28937, 2015Climate modulation of the Tibetan Plateau
on haze in China
X. Xu et al.
Title Page
Abstract Introduction
Conclusions References
Tables Figures
◭ ◮
◭ ◮
Back Close
Full Screen / Esc
Printer-friendly Version Interactive Discussion
Discussion
P
a
per
|
Discussion
P
a
per
|
Discussion
P
a
per
|
Discussion
P
a
per
Figure 5.The distributions of the interannual correlations of the apparent heat sourceQ1over the TP to the localV component of surface wind in winter over 1961–2012 (color shading). Ar-rows denote correlation vectors (showing both correlation coefficients ofQ1toUandV surface wind components) in China. The correlation coefficients of 0.12 (−0.12), 0.14 (−0.14) and 0.19 (−0.19) respectively passing the significance levels of 90, 95 and 99 %. A vertical section of the trends in vapour content (g kg−1 per 10 years) in winter over 1961–2012 averaged along
ACPD
15, 28915–28937, 2015Climate modulation of the Tibetan Plateau
on haze in China
X. Xu et al.
Title Page
Abstract Introduction
Conclusions References
Tables Figures
◭ ◮
◭ ◮
Back Close
Full Screen / Esc
Printer-friendly Version Interactive Discussion
Discussion
P
a
per
|
Discussion
P
a
per
|
Discussion
P
a
per
|
Discussion
P
a
per
|
Figure 6.Vertical sections of the anomalous air temperature (◦C) averaged along 27–41◦N in
ACPD
15, 28915–28937, 2015Climate modulation of the Tibetan Plateau
on haze in China
X. Xu et al.
Title Page
Abstract Introduction
Conclusions References
Tables Figures
◭ ◮
◭ ◮
Back Close
Full Screen / Esc
Printer-friendly Version Interactive Discussion
Discussion
P
a
per
|
Discussion
P
a
per
|
Discussion
P
a
per
|
Discussion
P
a
per
Figure 7.The percentages (%; contour lines) of differences of surface aerosol concentrations between winters of 1998 and 2003 with positive and winters of 1996 and 2002 with negative Q1anomalies on the TP relative to the surface aeorosol levels averaged over winters of 1996, 1998, 2002 and 2003 (µg m−3; color contours) modeled by the sensitivity simulation experiment