Business Intelligence in Insurance Brokerage Companies
–
a Tool for Decision-Makers
Alexandru Manole
Faculty of Finance and Accounting, Artifex University of Bucharest, Bucharest, Romania E-mail: alexandru.manole@gmail.com
Abstract This paper presents several applications of data analysis software in the insurance brokerage activity, particularly in matters related to the decision-making process. The study is based on a dataset loaded in a data warehouse, and several analysis procedures are presented, from the viewpoint of the managers of such company.
Key words Analysis, commission, warehouse, cube, premium
JEL Codes: G22, C88
1. Introduction
The use of business intelligence applications in the management of companies can offer a valuable toolbox for decision-making process in insurance brokerage companies. The information drawn from business intelligence applications comes in addition to operational level information, obtained through data processing in the company databases, and presented in the form of reports, which describe various facets of the activity of the company.
The insurance broker acts in a highly competition-driven environment, and needs timely information to substantiate his decision. The insurance agents must have accurate knowledge on the profile of the customer, while the managers have to be in permanent touch with the intelligence on the key, large (corporate, for example) customers, whose own network of relationships can boost the portfolio of insurance customers for the broker.
2.Literature review
data warehouse is loaded with a set of data, for exemplification and testing purposes.
4. Data analysis
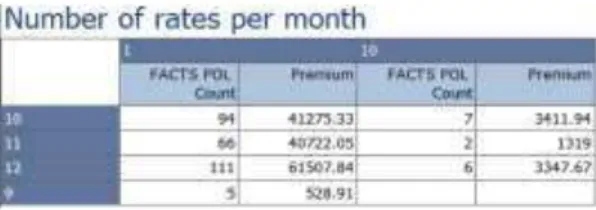
The analysis method that is to be applied in this paper is based on the additive model (see Manole 2015). The factors that will be taken into consideration at the first step are the time and the number of rates. The managers of the company are interested to see how their customers prefer to schedule their rates. One idea in this respect is that most insurance offers are granting a deduction from the total premium if the customers pay in a smaller number of rates, therefore it is important to have an image on the customers’ choices. Another possible analysis could reveal the following fact: if a customer acquires more policies, covering the same risk and object of insurance, for different periods (i.e. successive yearly car insurances), a change in the choice for a given number of rates can be a sign of modification in
customer’s financial situation. A model for such report is presented in the following
figure (the months appear as row headings:
Figure 1. Number of rates for contracts signed across a given range of months, as shown in Visual Studio Data Tools 2013 – selection
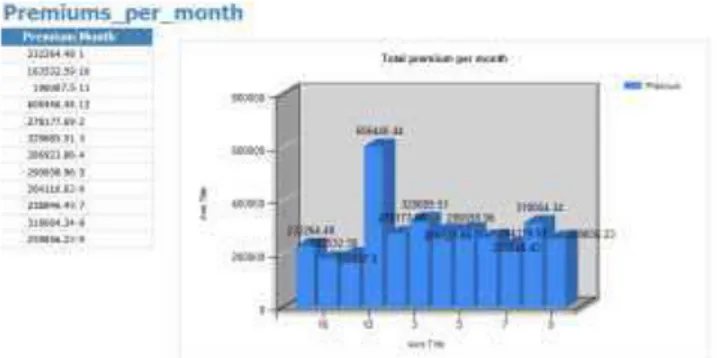
Figure 2. Dataset revealing the seasonality, per months, of the insurance premiums subscribed, as shown in Visual Studio Data Tools 2013
The second step in analyzing the seasonality of the business is to outline what the insurance types are providing the highest levels of premium subscribed in the top months of activity. Based on the data from figure 2, December appears to have the highest intensity of the activity, as far as the total value of premium subscribed is concerned. The dataset can be represented by using the following model:
Figure 3. Dataset revealing the predominant insurance type related to the most significant month, as shown in Visual Studio Data Tools 2013
The author’s experience in this type of business, in Romania, reveals that, indeed,
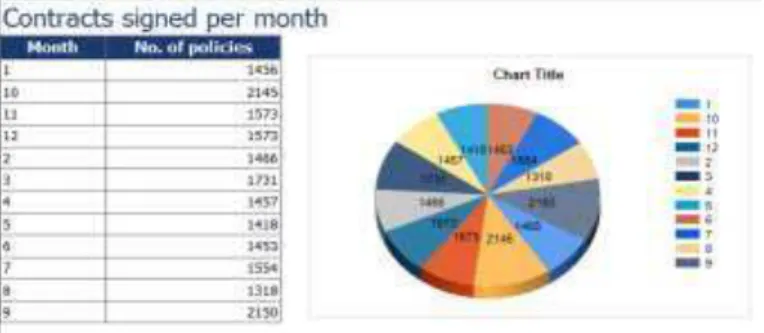
Figure 4. Dataset revealing the number of contracts per month, as shown in Visual Studio Data Tools 2013
From this viewpoint, the highest values are for September and October.
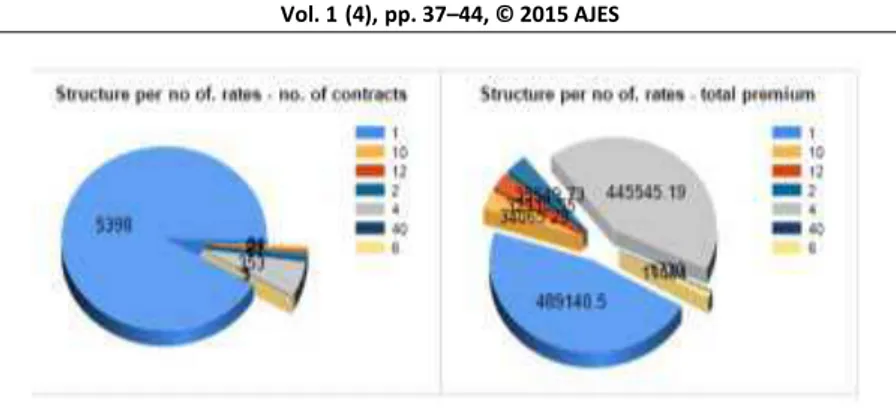
The next step in the analysis of customer preferences for scheduling the payment of the premium is to outline the structure, during the key months already determined, per number of rates assumed when the policy is signed. The number of rates is standardized, so the analysis will not provide highly granular data, possible to become difficult to be interpreted by the managers. By using the criteria/filter query instrument of the Visual Studio Data Tools, we can narrow the dataset to the three months considered above. The presentation of the data may be constructed as shown in the following model:
Figure 5b. Graphical representation of the dataset revealing the structure per number of rates, corresponding to the best months, as shown in Visual Studio Data
Tools 2013
One useful conclusion that might be extracted from this analysis is the fact that, while the number of policies and total premium record the greatest values for integrally paid premiums-single rate, in the situation of total premium centered analysis, the four-rate contracts have also a significant weight, similar to the integrally paid ones. To be noted, when interpreting this kind of results, the discounts applied by insurance companies for those accepting less rates are to be considered.
Another analysis direction, also in the scope of aiding the decision-makers, is based on another measure defined in the InBroker data warehouse: the revenues from commission (see Manole 2015).
This approach requires a separate cube, whose model, drawn from the InBroker data warehouse, is presented in the figure 6.
Together with the analysis based on premiums, this study should focus on the key dimensions of the company. The first example will pursue the contribution of each insurance type in the total commission. The model structure for this report is presented in the figure 7.
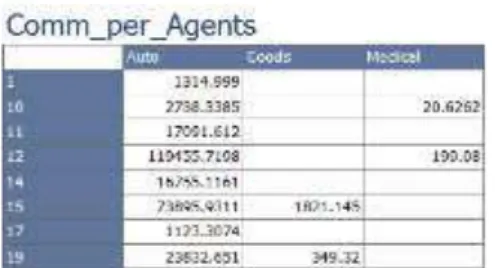
The next report proposed will show the contribution of the insurance agents to the achievement of company revenues (the commissions generated from the policies managed by the respective agent). The structure of the report is presented in the figure 8.
Figure 6. Physical model of the COMM cube, as shown in Visual Studio Data Tools 2013
Figure 8. Contributions of agents in total commissions, as shown in Visual Studio Data Tools 2013 - selection
The proposed model for such report is presented in the figure 9, together with the MDX query on which is based:
Figure 9. Report showing the commissions achieved per companies and types of insurance and MDX query, as shown in Visual Studio Data Tools 2013 - selection
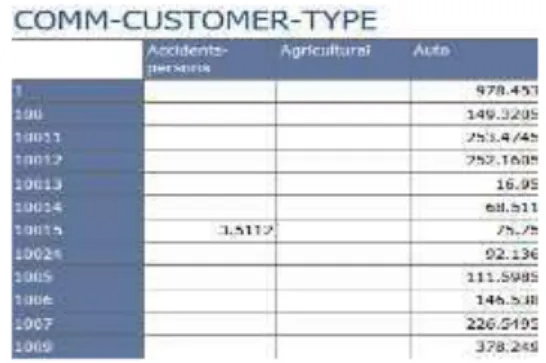
Also, a most important component of the business model of the insurance broker is the customer. Accurate knowledge on the reflection of this relationship in the activity measures is extremely important for the manager of the brokerage company. One aspect of this analysis is the structure of premiums subscribed by customers, per insurance types. The structure of such report might be presented as in the figure 10.
Figure 10. Report showing the commissions achieved per customers and types of insurance, as shown in Visual Studio Data Tools 2013 – selection
5. Conclusions
The complexity of data stored in the electronic archive of an insurance broker company represents, if properly managed by special software – OLTP and business intelligence application, in my opinion, offers a great deal information potential for the managers, able to help them make strategic decisions regarding their activity. Information drawn from business intelligence solutions, such the types presented in this paper, completes the operational information accessible through reports from OLTP software and has a more strategic-oriented character, taking into account the possibility to aggregate data across a larger time interval. The possibilities of analysis are virtually limited only by the dimensions and their levels/members.
References
Cebotarean, E. (2011). Business intelligence. Journal of Knowledge Management, Economics and Information Technology. Volume (Year): 1 (2011), Issue (Month): 2 (February), available at http://www.scientificpapers.org/wp-content/files/1102_
Business_intelligence.pdf
Manole, A. (2015). Some Considerations Regarding the Design and Implementation of Data Warehouse in Insurance Broker Management, Academic Journal of Economic Studies, 3, 115–125.
Manole, A. (2008). Sistemul informatic pentru modelarea deciziei financiar-contabile, Artifex Publishing House, Bucharest.
Muntean, M. (2012). Business Intelligence Approaches. University Library of Munich, Germany in MPRA Paper with number 41139.
Popa, Gh. et al. (2006). Microsoft SQL Server, Economica Publishing House, Bucharest